Abstract
Bore flaw is the important influencing factor to service life of gun barrel. Traditional manual detection method is tedious and imprecise. To improve the detection efficiency and accuracy, an intelligent bore peek and measurement system based on machine vision technology was developed. And a new kind of flaw image enhancement, image division, feature extraction and identification method is put forward. Curvelet transformation and direct grey mapping are adopted to enhance original image and reduce noise. PSNR results based on experiments verify the denoise effectiveness. Transitional areas of rifles and tail-end area of gas port are taken as example to illustrate the flaw image division principle. To extract the textural features from bore flaw images, grey level co-occurrence triangular matrix (GLCTM) theory is adopted and usual statistic functions are established. Six kinds of typical flaws are taken as experiment objects of texture extraction. The experiment results prove the credibility and accuracy of the proposed method in this paper.
1. Introduction
Barrel is the most important component of gun. The barrel’s service life decides the gun’s service life. In the handling, checking and operating process, barrel’s quality requirement is very strict. Bore flaw is the important influencing factor of barrel quality. Bore flaw detection by peek and measurement is the necessary item before firing. Bore flaw includes breakage, crack, corrosion, ablation, knock etc. Different bore flaw has different characteristic parameters [1, 2]. Traditional detection method of bore flaw is using optical bore peek instrument. Experienced technical personnel directly observe, analyze and identify. Traditional optical method results in personal errors inevitably. The rapid development of CCD technology provides a new kind of detection method for bore flaw. The photoelectric bore peek and measurement system put forward in this paper consists of CCD camera, image collection card, industrial control computer, control unit and locating device. It integrates the image collection, observation, storage, processing and analysis functions. Comparing with traditional detection method, intelligent bore peek and measurement system based on machine vision technology for gun barrel not only increase the efficiency, precision and intelligence, but also judge the type of bore flaw and measure the corresponding characteristic parameters automatically.
2. System Introduction
Fig. 1Intelligent bore peek and measurement system based on machine vision technology for gun barrel

Intelligent bore peek and measurement system based on machine vision technology for gun barrel is shown as Figure 1. The industrial control computer controls the working process of stepping motor and drives the CCD camera to rotate in gun barrel. The CCD camera collects the bore images. The image collection card transmits the bore images into digital signals.
3. Image enhancing of bore flaw based on curvelet transformation and direct grey mapping
The collected images of bore flaw include noises inevitably because of external factors. The purpose of image enhancing is to remove noise and enhance contrast. Comparing with traditional wavelet transformation, curvelet transformation not only includes dimensional parameters and displacement parameters, but also adds directional parameters. Curvelet transformation presents the image edges precisely. The comparison of edge approximation between wavelet transformation and curvelet transformation is shown as Figure 2.
Fig. 2Comparison of edge approximation
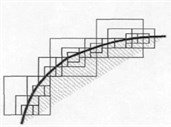
a) Wavelet transformation
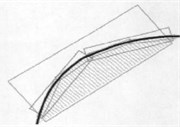
b) Curvelet transformation
3.1. Basic steps of image enhancing based on curvelet transformation
The principle of image enhancing and noise reduction based on curvelet transformation is: firstly, apply curvelet transformation to collected images and generate series of curvelet coefficients; secondly, select suitable threshold quantification method to calculate new curvelet coefficients; finally, apply curvelet reverse transformation to quantification coefficients and generate enhanced images [3]. Suitable thresholds are important to image noise reduction. D.J threshold method is selected to calculate the coefficient thresholds of all layers.
where j is the jth layer, n is the signal sampling length, σ is the noise standard deviation. Experiment processes denote that the estimation of σ is more precise in the decomposition coefficients of maximum layer.
where C is the maximum layer coefficient of curvelet transformation.
Conventional threshold quantization methods include soft threshold and hard threshold. Soft threshold function is continuous, has no discontinuity points, generate smooth enhanced images, but has applicable limitation. Hard threshold function has discontinuity points and there are ringing and pseudo Gibbs phenomena [4]. Aiming to the defects of soft threshold method and hard threshold method, a new kind of continuous threshold quantization method is put forward in this paper. Its function expression is:
where 0<λ1<λ<λ2, T(x)=ax3+bx2+cx+d is a cubic polynomial. According to the continuous and derivative relationship, formula (4) can be obtained.
Then, the expression of T(|W|) is:
If 0<λ1<λ<λ2, the values of λ1 and λ2 can be selected according to practical situations. When the curvelet decomposition coefficient is small and approach to λ1, it falls smoothly and retains the continuity. When the curvelet decomposition coefficient is more than threshold λ, image’s details can be reserved by adjusting λ2.
3.2. De-noise experiments and results analysis
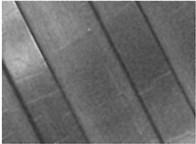
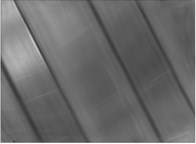
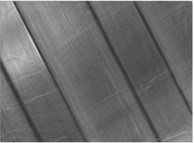
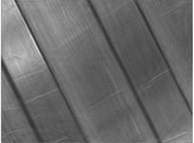
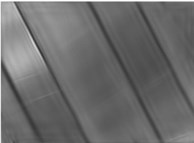
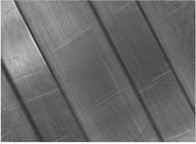
Apply de-noise experiments with different methods to a bore flaw image. The results are shown in Figure 4. In Figure 4, (a) is the original bore flaw image including noise, (b)~(h) are the image enhancing results of mean filtering method, Wiener adaptive filtering method, curvelet soft-threshold method, curvelet hard-threshold method, wavelet soft-threshold method, wavelet hard-threshold method, curvelet continuous-threshold method. The corresponding values of Peak Signal-to-Noise Ratio (PSNR) are shown as Table 1.
Fig. 4De-noise results of bore flaw image
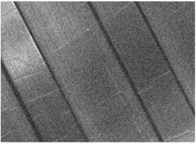
a)
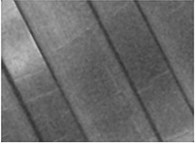
b)
c)
d)
e)
f)
g)
h)
Table 1Results of Peak Signal-to-Noise Ratio (PSNR)
Figure | a | b | c | d | e | f | g | h |
PSNR/dB | 68.1183 | 78.8319 | 79.2760 | 80.7861 | 80.2053 | 80.3514 | 79.5007 | 81.3795 |
Comparing the de-noise images and the values of Peak Signal-to-Noise Ratio (PSNR), the following conclusions can be obtained: 1) The detail information of enhancing images based on airspace methods is inclined to lose. For example, the small cracks in (b) and (d) are ambiguous. 2) Comparing with the airspace methods, the frequency-domain methods have better de-noise effects. Comparing with wavelet transformation, curvelet transformation not only has good de-noise effect, but also protects the images’ detail information. 3) The de-noise effect of continuous threshold quantification method is better than soft-threshold quantification method and hard-threshold quantification method. 4) As shown in Table 1, the de-noise method put forward in this paper has highest Peak Signal-to-Noise Ratio (PSNR), protect the images’ detail information and has best de-noise effect.
4. Transitional area transaction and division of bore flaw image
In the barrel of rifle gun, the height differences among rifles result in shadows in transitional areas. There are grey discontinuous alternating stripes in bore flaw images, which cause difficulties in image analysis. In the barrel of Self-Propelled Gun, there are gas ports in bore flaw images. Image division should be carried out first. In this paper, binary-state mathematic morphology is adopted to treat the rifles’ transitional area and flaw images of gas ports.
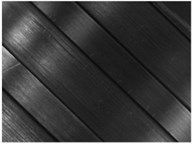
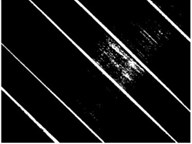
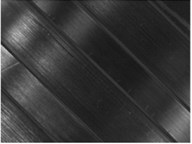
Division of rifles’ transitional areas includes two following steps [6]: 1) Global threshold division. The purpose of global threshold division for transitional area is to realize binaryzation for image. The threshold selection is determined by the practical situation of image. 2) Remove small target. Usually, the divided area of image is minor than the transitional area. The remove algorithm is binary-state mathematic morphology. After dividing the image of transitional areas, the removing areas should be filled up to guarantee that the whole image is grey continuous. Take the grey average of rifles’ transitional areas as the filled grey value. Figure 5 shows the experiment processes and results of rifles’ transitional areas of bore flaw image.
Fig. 5Transaction of rifles’ transitional areas
a)
b)

c)
d)
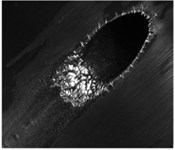
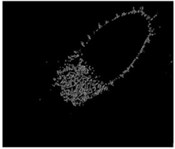
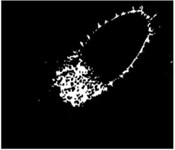
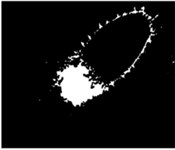
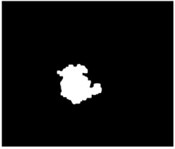
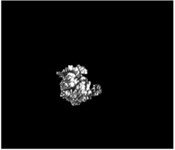
Fig. 6Division processes and results of a flaw image of gas port image
a)
b)
c)
d)
e)
f)
In Figure 5, (a) is the original bore flaw image, (b) is the image after global threshold division, (c) is the image after removing small targets, (d) is the final processing result. The gas ports are the important components of air exhauster of Self-Propelled Gun. The tail-end of gas port usually exists ablation, which result in irregular edges. The division of tail-end area of gas port from the whole image should be finished first. The edge detection process projects the local edges of gas ports using edge enhancing operator. Define the edge intensity and set the threshold to extract the set of edge points. The edge detection process can be finished by convolution of airspace difference. Select the Robert operator as the difference operator. If the detected edges are not closed, closure operation should be carried out according to mathematical morphology to generate closed hole. Fill up the closed hole and divide the tail-end area from the bore flaw image. Then, cut-in operation should be carried out to eliminate the noise of gas port edge and divide the flaw area from the gas port image. Figure 6 shows the division processes and results of a flaw image of gas port image.
5. Textural features extraction of flaw image based on grey level co-occurrence triangular matrix
The key of bore flaw identification is image characteristics extraction. Statistical information shows that there are fourteen kinds of bore flaws in barrel. To describe the image characteristics accurately, grey level co-occurrence triangular matrix (GLCTM) is adopted to extract the textural features. Specific parameters include entropy, angle second moment, contrast and correlation [7]. The bore flaws of barrel belong to disorder textures. The corresponding texture analysis method is statistical analysis method. The extraction process of flaw image includes image texture expression and image texture description.
5.1. Image texture expression
Suppose the greys of two image elements on angle θ and distance d are i0 and j0, the corresponding probability is p(i0,j0,d,θ). As for fixed angle θ and distance d, p(i,j,d,θ), (i,j=1,…,L, L is the grey level of flaw image) is an element, all the element compose the grey level co-occurrence matrix (GLCTM) P(i,j,d,θ).
where S is the set of coupled image elements with specific spatial relationships, # is the element number in set. From the above formula, we can see that the numerator is the number of coupled image elements whose greys are i0 and j0, the denominator is the summation of the coupled image elements. Therefore, the matrix P(i,j,d,θ) is normalized. Set the interval is 45° and the distance is d, four GLCTM s can be defined as:
x1-x2=0,|y1-y2|=d,I(x1,y1)=i,I(x2,y2)=j},
x1-x2=d,y1-y2=-d,orx1-x2=-d,y1-y2=d,
The above GLCTM s reflects the distributions of image grey levels and describe the dependent relationships of grey level in space. By selecting different angels and distances, more minute characteristics of textures can be expressed.
5.2. Image texture description
Based on the image texture expression of GLCTMs, fourteen second-order statistic functions are defined to describe the flaw image texture. Angular second moment, contrast, correlation and entropy are four usual statistic functions describing texture characterizes of bore flaw image.
Suppose:
The first statistic function is angular second moment, whose expression is:
The angular second moment reflects the uniformity or smoothness of image grey. When the values of GLCTM elements distribute about principal diagonal, the local greys of flaw image are uniform, the textures are minute, the value of angular second moment is big. Otherwise, the value of angular second moment is small. The second statistic function is contrast, whose expression is:
The contrast represents the texture identification of flaw image and corresponds to the inertia moment about principal diagonal of GLCTM. The contrast value is bigger, the texture of flaw image is more obvious. The contrast value is smaller, the texture of flaw image is more ambiguous. The third statistic function is correlation, whose expression is:
where and are mean and variance of , and are the mean and variance of . The correlation reflects the local grey dependence of image and corresponds to the similar degree of GLCTM elements on line or row. When the GLCTM elements are uniform, the value of correlation is bigger. When the GLCTM elements are non-uniform, the value of correlation is smaller. The fourth statistic function is entropy, whose expression is:
The entropy value represents the information quantity of flaw image. It is the characteristic parameter of image randomness and shows the complexity of image textures. The image textures are more complex, the values of have little differences.
5.3. Experiment results analysis
Select third-level little ablation, first-level middle ablation and third-level middle ablation as the first group of experiment objects. There are rifles in the corresponding bore flaw images. Select second-level shelly crack, third-level shelly crack and second-level gully as the second group of experiment objects. There is no rifle in the corresponding bore flaw images. The experimental images are shown as Figure 7.
Fig. 7Experimental images
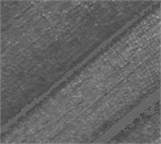
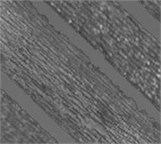
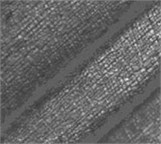
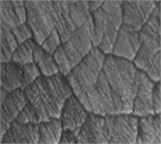
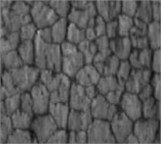
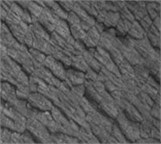
In the GLCTM calculation process, set the grey level as 64, set the distance as 4, set the angle as 0°, 45°, 90° and 135°, resolve the characteristic parameters of bore flaw images under all angles and calculate the mean of characteristic parameters. The generated texture characters have no relationships with specific angles. The statistical results are shown as Table 2.
Table 2Statistical results of characteristic parameters
Group | Flaw type | Angular second moment | Contrast | Entropy | Correlation |
First | Third-level little ablation | 0.0211 | 6.8775 | 0.0413 | 4.3299 |
First-level middle ablation | 0.0144 | 9.5002 | 0.0359 | 4.7905 | |
Third-level middle ablation | 0.0092 | 11.9946 | 0.0306 | 4.9812 | |
Second | Second-level shelly crack | 0.0050 | 17.2229 | 0.0156 | 5.5751 |
Third-level shelly crack | 0.0044 | 18.4310 | 0.0099 | 5.7911 | |
Second-level gully | 0.0043 | 22.8134 | 0.0129 | 5.7767 |
In the first group of experiment objects, the damage degrees are more serious, the local grays of flaw images are more uneven, the flaw damages are more distinct, the local correlations of image greys are more inferior, the flaw textures are more complex. The angular second moment, contrast, entropy, correlation reflect the grey uniformity, texture identification, texture complexity, grey correlation separately. The statistical results of characteristic parameters of the first group are consistent with the flaw description. Specific representations include that the value s of the angular second moments decrease gradually, the contrast values increase gradually, the entropy values increase gradually, the correlation values decrease gradually. In the second group of experiment objects, the statistical results of characteristic parameters of second-level shelly crack and third-level shelly crack are consistent with the above rules. Comparing with shelly crack, the gully damage moves along lengthwise direction. There is no obvious change on surface textures. The corresponding contrast varies clearly. Other three statistical results vary minutely. The variation amplitudes also accord with the above rules.
6. Conclusions
1) Curvelet transformation theory is applied to image decomposition. Combining with the continuous threshold quantization method, the basic steps of image de-noising are proposed based on the characteristic analysis of noise distribution. According to the image characteristics, the direct grey scale mapping transformation function is selected to enhance the contrast of bore flaw image.
2) Based on the characteristic analysis of bore flaw image, the processing method of rifles’ transition area is put forward to resolve the discontinuous problem of image grey. Edge detection theory and binary-state mathematics morphology are adopted to divide the flaw image of gas port. And the affection of whole architecture to image analysis results is eliminated. The characteristics of usual bore flaws are analyzed. The GLCTM theory is adopted and proper statistic functions are selected to extract the texture characteristics of flaw images. The experiment results prove the credibility and accuracy of the proposed method in this paper.
References
-
Fu Jianping, Zhang Lihua, Lei Jie, Wu Dinghai Study of the gun bore panoramic spying equipment based on machine eyespot. Journal of Gun Launch and Control, Vol. 6, 2012, p. 88-91, (in Chinese).
-
Gou Wentao, Xie Weiqing Cartridge case surface defect detection system design based on machine vision. Journal of Ordnance Equipment Engineering, Vol. 37, Issue 2, 2016, p. 105-108, (in Chinese).
-
Po D. D. Y., Do M. N. Directional multiscale modeling of images using the contourlet transform. IEEE Transactions on Image Processing, Vol. 15, Issue 6, 2006, p. 1610-1620.
-
Do M. N., Vetterli M. The contourlet transform: an efficient directional mulfiresolution image representation. IEEE Transactions on Signal Processing, Vol. 14, Issue 12, 2005, p. 2091-2106.
-
Liu Zhiwei, Zhou Dongao, Lin Jiayu Image segmentation based on saliency detection. Computer Engineering and Science, Vol. 38, Issue 1, 2016, p. 144-147, (in Chinese).
-
Brosnan T., Sun D. W. Improving quality inspection of food products by computer visional review. Journal of Food Engineering, Vol. 61, Issue 1, 2004, p. 3-16.
-
Jiao Liang, Hu Guoqing, Jahangir Alam S. M. Classification system of random texture ceramic tiles based on machine vision. Computer System Application, Vol. 25, Issue 3, 2016, p. 93-100, (in Chinese).
