Abstract
The paper proposes a method for solving optimal control operating parameters of oil stratum: the arrangement of injection and production wells; regulation works well in setting of the two-phase filtration. Depending on the optimization of the planning horizon on the basis of the proposed method gives the prediction of increasing production by 27 % in the long-term planning up to 60 % for short-term planning.
1. Introduction
For optimal control modes of operation, instead of the oil reservoir equations of state in the form of a system of ordinary differential equations, it is necessary to take the differential equations in partial derivatives [1-3]. The complexity of solutions increases sharply with increasing the size of the problem: a fixed two-dimensional, two-dimensional non-stationary, non-stationary two-dimensional two-phase, three-dimensional multiphase transient performances. The real solution is for the two-dimensional unsteady multiphase flow model.
2. System model
We consider the following differential operators:
stationary phase filtration;
transient single-phase filtration;
two-phase filtration. Here:
vector variables: the pressure of the non-wetting phase; pressure wetting phase; water saturation.
For this kind of state equations is the only acceptable method of numerical solution of optimization problems. Numerical methods of optimal control based on the reduction to a nonlinear programming problem [4]. Most methods of organized sequential process of unconditional minimization of an auxiliary, variable from step to step function of many variables. In the case where the solution of the problem of unconstrained minimization using local methods, local optimal control problems were obtained.
3. Numerical scheme
In the construction of numerical methods for solving problems of optimal control of continuous systems (1), go to their discrete approximations. We consider the discrete analogs of differential operators D1, D2, D3, which denote Δ1, Δ2, Δ3, respectively. A discrete analogue Δ1 is based on a five-point difference pattern. Discrete analogues Δ2, Δ3 are seven-spotted and implicit difference scheme. For them, the difference grid is entered:
The difference in the solution network nodes is denoted by the vector Y=(Fnij). Control actions u(t,r) are also taken at certain points in time tl and space rk does not necessarily coincide with the reins of the difference grid (5). The finite-dimensional control vector is to be denoted as U=(ulk)=(ul1k,...,ulmk). Trust functionality is the result of some algebraic operations on values Y, U. Thus, instead of infinite-dimensional problems, there is a finite mathematical programming problem with the objective function:
and restrictions are determined by the solution of differential operators (b = 1 or 2 or 3):
as well as additional restrictions on the variables and constraints associated with the specifics of the optimized process:
When drawing up the discrete approximations of the original system, one can enter special hypotheses about the nature of change management within the integration interval by applying different interpolation operators. It is usually fairly linear interpolation.
The specificity of the problem (6) - (9) is the inability to differentiate, in general, the objective function and multi-extremal problems. Therefore, the main problem is the choice of the appropriate method of numerical solution of the optimization problem. Let us consider as an option for solving the problem of genetic algorithms, coping with non-differentiable functions and multi-extremality.
Next, we consider the problem of non-stationary two-phase filtration of liquids in water-oil formulation [5]:
Po-Pw=Pc,Sw+So=1,
where f={w,o} – the index for the wetting and non-wetting phase; Sf – saturation of the pore volume phase f; Pc – capillary pressure. It is believed that there between Sf and Pc the functional dependence λf(r)=kf(r)/μf,γf=ρfg,r∈Ω⊂ˉΩ3;Pf(r) – pressure at the point r∈Ω; ˉΩ – filtering domain with boundary Γ; n – outward normal; kf – diagonal tensor absolute permeability; h – seam thickness; Z – the depth; μf - The viscosity of the liquid; ρf – density of the liquid; g – acceleration of gravity; Qf – power sources; φ(r)=φ° ; – porosity; – volumetric coefficient; – characteristic pressure.
A criterion for the optimal control problem will be a maximum of oil production during the period of time . It is controlled by the placement of production and injection wells, as well as the regulation of debits on both types of wells. Optimized functional is of the form:
where – coordinate water pressure and oil wells, respectively; – well productivity; – water-saturation oil wells. The optimization is performed with the following regime-technological indicators:
where – flowing bottom hole pressure associated with the flow and pressure in the computational cell model Peaceman [6].
4. Computational experiments
This problem can be solved on a 256×256 grid. In this dimension of the problem, the direct numerical problem solution is highly time-consuming. Therefore, it uses the approach to the approximation of solutions of radial functions. A correction calculation, associated with the solution of the finite-difference problem, is carried out on a 32×32 grid by the multigrid method with three nested grids. With this approach, while solving the optimization problem becomes quite affordable (10-30 minutes) for a typical computer.
Fig. 1Convergence of iterative process
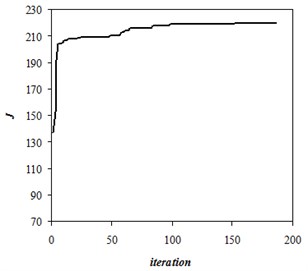
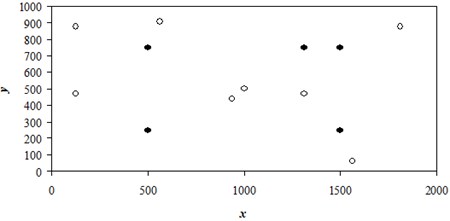
Fig. 2Optimal location of wells
Examples are given for the formation of a rectangular with dimensions 2000 h 1000 m and an average thickness of 10 m. The configuration of the reservoir with the possibility of constructing a curvilinear grid makes no fundamental difficulty in solving the optimization problem.
Consider the relatively short-term planning period = 1.6 years. We consider 5 production and 8 water pumping wells for the reservoir. The convergence of the iterative process is shown in Figure 1.
Here the produced oil volume is related to the time reached by optimizing the value of = 219.8 which means the average daily production in cubic meters. Compared to the original value = 137 of the production volume increased by more than 60 %. The found location of wells is shown in the following Figure 2.
Hydrodynamics of filtering the non-wetting liquid (water) is shown in Figure 3. Here, the arrows show the direction of water movement in the reservoir at the injection wells.
Isolines water saturation corresponds to the end point in time and is shown in Figure 4.
Fig. 3Golf course non-wetting liquid
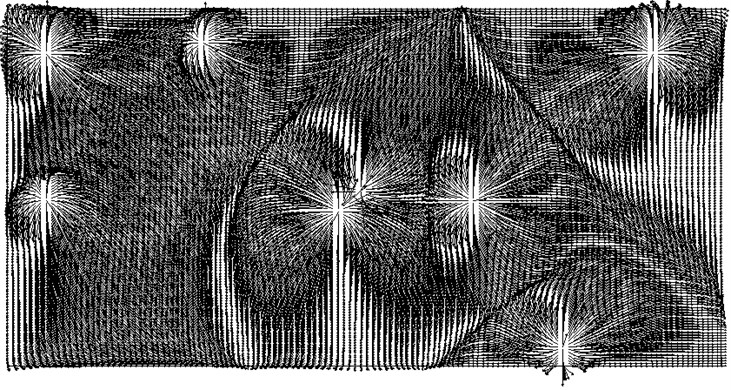
Fig. 4Distribution of water saturation in final time T = 1.6 years
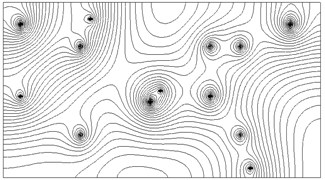
Fig. 5Initial location of wells
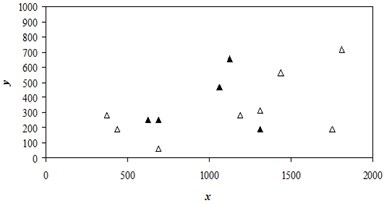
Here the results of calculations are shown for a more long-term planning period = 16 years. The initial (random) location of wells is given in Figure 5.
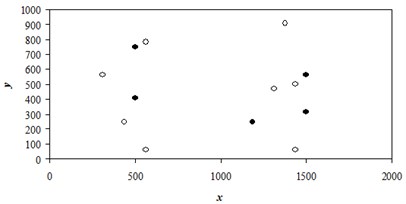
In the process of optimizing the value increased from 75 to 95 cubic meters per day (Fig. 6). The optimized placement of wells is shown in Fig. 7.
Coordinates intensity sources and wells over time are shown in Table 1.
Fig. 6Change of Quality Score in iterations
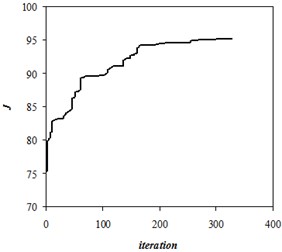
Fig. 7Optimized placement of wells
Others obtained the coordinates of location of sources and changing their intensity over time for other planning periods. The efficiency dependence of the planning horizon is shown in Figure 8.
Figure 8 shows the average values for the total planning time. For the planning period = 16 drop in average daily production data is shown in Figure 9.
If the operation is used to determine formation characteristics calculation results obtained for the = 1.6 and shown in Table 2, we obtain the mean value = 58.2, lower than = 95. Parish oil is reduced in this case due to premature flooding wells.
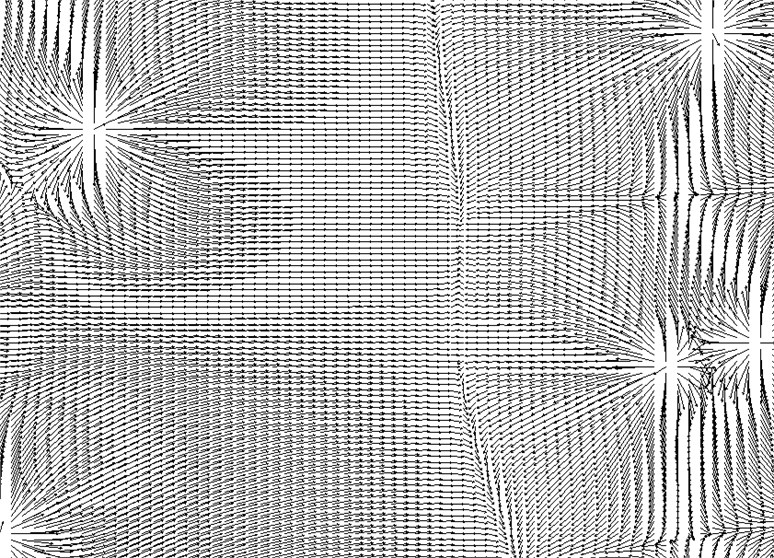
The final distribution of water saturation is shown in Figure 10, and Figure 11 shows the water flow in the reservoir.
Fig. 8Efficiency dependence of planning horizon
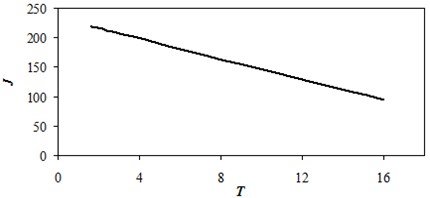
Fig. 9Change of average daily production data
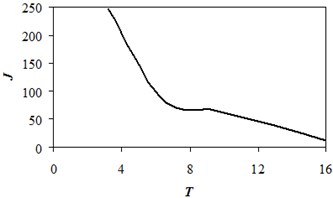
Table 1Formation characteristics calculation results obtained for the T = 1.6
0 | 3.2 | 6.4 | 9.6 | 12.8 | 16 | ||||
1 | 437.5 | 250 | 0.004046 | 0.014797 | 0.025548 | 0.036299 | 0.04705 | 0.057802 | |
2 | 562.5 | 62.5 | 0.006339 | 0.011923 | 0.017506 | 0.02309 | 0.028673 | 0.034257 | |
3 | 1312.5 | 468.75 | 0.011417 | 0.014016 | 0.016615 | 0.019214 | 0.021813 | 0.024411 | |
4 | 1437.5 | 62.5 | 0.011417 | 0.017213 | 0.023009 | 0.028805 | 0.034601 | 0.040397 | |
5 | 312.5 | 562.5 | 0.00243 | 0.014373 | 0.026316 | 0.038259 | 0.050202 | 0.062145 | |
6 | 562.5 | 781.25 | 0.010797 | 0.018065 | 0.025333 | 0.032602 | 0.03987 | 0.047138 | |
7 | 1375 | 906.25 | 0.004228 | 0.014123 | 0.024018 | 0.033913 | 0.043808 | 0.053703 | |
8 | 1437.5 | 500 | 0.011417 | 0.019833 | 0.028249 | 0.036664 | 0.04508 | 0.053496 | |
1 | 1500 | 562.5 | –0.00512 | –0.01946 | –0.03379 | –0.04813 | –0.06246 | –0.0768 | |
2 | 500 | 750 | –0.00512 | –0.01733 | –0.02953 | –0.04174 | –0.05394 | –0.06615 | |
3 | 1187.5 | 250 | –0.04161 | –0.04865 | –0.05569 | –0.06272 | –0.06976 | –0.0768 | |
4 | 500 | 406.25 | –0.00512 | –0.01946 | –0.03379 | –0.04813 | –0.06246 | –0.0768 | |
5 | 1500 | 312.5 | –0.00512 | –0.01946 | –0.03379 | –0.04813 | –0.06246 | –0.0768 | |
Table 2Formation characteristics calculation results obtained for the T = 1.6
0 | 3.2 | 6.4 | 9.6 | 12.8 | 16 | ||||
1 | 125 | 468.75 | 0.075135 | 0.06543 | 0.055725 | 0.04602 | 0.036315 | 0.02661 | |
2 | 937.5 | 468.75 | 0.027135 | 0.035399 | 0.043663 | 0.051927 | 0.060191 | 0.068455 | |
3 | 1312.5 | 468.75 | 0.02765 | 0.035383 | 0.043116 | 0.050848 | 0.058581 | 0.066314 | |
4 | 1625 | 93.75 | 0.027135 | 0.0291 | 0.031064 | 0.033029 | 0.034993 | 0.036958 | |
5 | 125 | 906.25 | 0.075015 | 0.073703 | 0.072391 | 0.071079 | 0.069767 | 0.068455 | |
6 | 562.5 | 906.25 | 0.027135 | 0.027126 | 0.027117 | 0.027109 | 0.0271 | 0.027091 | |
7 | 1000 | 500 | 0.036329 | 0.033154 | 0.02998 | 0.026805 | 0.02363 | 0.020455 | |
8 | 1812.5 | 906.25 | 0.027139 | 0.035402 | 0.043666 | 0.051929 | 0.060192 | 0.068455 | |
1 | 500 | 750 | –0.0768 | –0.0768 | --0.0768 | –0.0768 | –0.0768 | –0.0768 | |
2 | 1437.5 | 750 | –0.0768 | –0.0768 | –0.0768 | –0.0768 | –0.0768 | –0.0768 | |
3 | 1500 | 250 | –0.01547 | –0.0275 | –0.03952 | –0.05155 | –0.06357 | –0.07559 | |
4 | 500 | 250 | –0.0768 | –0.0768 | –0.0768 | –0.0768 | –0.0768 | –0.0768 | |
1 | 125 | 468.75 | 0.075135 | 0.06543 | 0.055725 | 0.04602 | 0.036315 | 0.02661 | |
Fig. 10Distribution of water saturation in final time T = 16 years
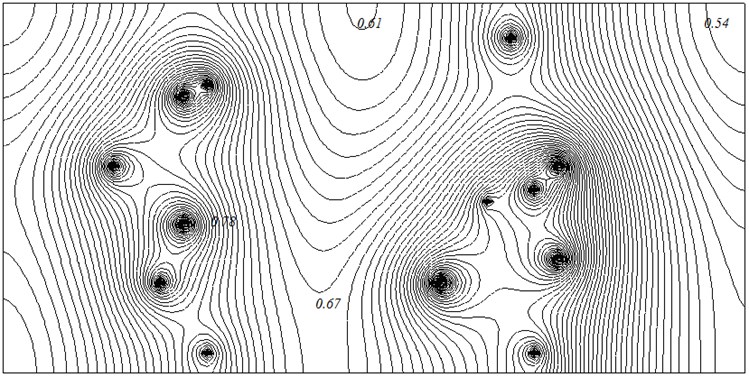
Fig. 11Water flow in reservoir (T = 16 years)
The results of optimization calculations show that the problem solution of optimal placement and adjustment of wells in the formulation of the two-phase filtration, significantly improve the performance of the oil reservoir. It is not the principal difficulty setting other than optimality criteria and additional restrictions. The task of the three-phase to two-dimensional filtering and quasi-three-dimensional productions is also real.
5. Conclusions
On the basis of the implemented genetic algorithm, combined coding operators of crossing and selection for operators of domination, a method for solving problems of optimal control of the operational parameters of the oil reservoir was developed: arrangement of injection and production wells; regulation of wells directed by two-phase filtration. Depending on the planning horizon optimization mode gives a prediction to increase production by 27 % (long-term planning for 16 years) to 60 % (short-term planning for 1.6 years).
References
-
Riahi Danilel N. Mathematical Modeling and Simulation in Hydrodynamic Stability. World Scientific Publishing Co., USA, 1996, p. 200.
-
Chanson H. Applied Hydrodynamics: An Introduction to Ideal and Real Fluid Flows. CRC Press, Taylor and Francis Group, Leiden, The Netherlands, 2009, p. 478.
-
Economides Michael J., Nolte Kenneth G. Reservoir Stimulation. Wiley, USA, 2000, 856 p.
-
Evtushenko Y. G. Methods for Solving Extreme Problems and Their Use in Optimizing Systems. Nauka, Moscow, 1982, p. 432, (in Russian).
-
Fables K. S., Cochin I. N., Maksimov V. M. Underground Fluid Mechanics: A Textbook for High Schools. Nedra, Moscow, 1993, p. 416, (in Russian).
-
Kanevskaya R. D. Mathematical Modeling of Hydrodynamic Processes of Hydrocarbon Field Development. Institute of Computer Science, Moscow-Izhevsk, 2003, p. 128, (in Russian).
