Abstract
Sloshing problems are highly non-linear problems and obtaining an accurate solution with numerical simulations is difficult and requires long simulation times. For this reason, sloshing experiments are important to understand the sloshing characteristics of liquid and to validate the theoretical and numerical studies in this field. In this study, an experimental setup which can input sine or random inputs to a sloshing system is designed and verified for different input amplitudes and frequencies. Then, the effect of vibration frequency and amplitude on the amplitudes of wave height and sloshing force are investigated. The effect of base motion frequency and the sloshing natural frequency on sloshing characteristics is also investigated.
1. Introduction
The solution of sloshing problems is becoming more important, recently. Engineers and researchers have the need to solve sloshing problems for different kind of engineering applications. For instance, the solution of sloshing problem can help to optimize the performance of tuned liquid dampers or to make the transportation process of fluids safer. But analytical solutions are only possible with restricting assumptions on the fluid behavior and motion amplitudes. Therefore, numerical solutions are frequently used to solve sloshing problems. Theoretical and numerical solutions were performed mostly employing the potential flow theory, shallow water theory and using linear models [1]. However, these mathematical models are only valid for small deformations since they use simplified linear theories [2]. Due to large set of assumptions and non-linear nature of the sloshing problem, these mathematical models require experimental verification. Therefore, sloshing experiments are used frequently to validate the numerical solutions and to predict the free surface motion and to determine sloshing forces.
Designing an experiment for sloshing requires simulating the desired input correctly. Measurement of liquid sloshing characteristics is a challenging task. Liquid sloshing is fast and may result in complex movement which may be hard to measure, especially on the free surface. The difficulty of fuel level measurements for cars on the road is an example of this situation [3]. Measurement of wave height is important for comparison of numerical analysis and experiment results. In literature, wave height is measured with capacitance probes or ultrasonic sensors [3, 4]. However, the measurement with capacitance probe is a contact measurement method and the capacitance probe may affect the sloshing. Additionally, when using the ultrasonic sensors, it should not be forgotten that the ultrasonic sensor does not measure a single point but it gives a mean water value over the area where the ultrasonic wave is directed. Sloshing force is another crucial parameter and usually measured with load cells [5]. Pressure is also frequently measured in sloshing experiments [6], but it will not be measured in this experiment.
2. Experimental setup
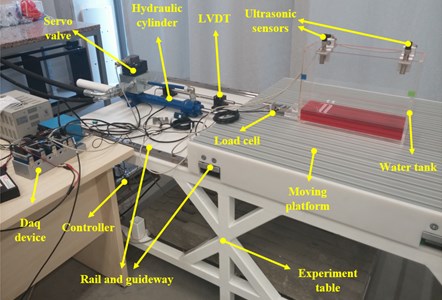
An experimental setup is designed to investigate the sloshing characteristics of water for different test cases. There are mainly two tasks that the setup should perform. First, the experimental setup should simulate the displacement input to the test specimen at desired frequencies and amplitudes. Second, it should be capable of collecting experimental data via a variety of sensors such as LVDT, load cell and ultrasonic sensors. So the required test setup can be examined under four major components; structural parts, actuation system, sensors and data acquisition system. The designed experimental setup and sensors are shown in Fig. 1.
An experiment table is necessary to mount the other components of experimental setup on it and the table should isolate the components from any other vibration sources. Additionally, the table should be able to withstand high dynamic and static loadings and it should be ergonomic to work on it. During the design of the table, natural frequency analysis was also conducted and the first 3 natural frequencies and mode shapes of table were calculated. The predicted natural frequencies from COMSOL™ analysis are much higher than the desired motion frequencies. Consequently, it was determined that the dynamic and static properties of the designed experiment table is suitable for this work.
The top surface of the experiment table is covered with 10 mm polyamide plate. Four guideways and two rails are mounted carefully on the experiment table. These components are the moving components of the experimental setup. The parallelism between the two rails are crucial to implement desired input motion to the system correctly. These guideways and rails have high loading capacity and low friction. The last component of the moving platform is the aluminums profiles which are attached on the linear guideways. A water tank is manufactured from 10 mm Plexiglas. It is transparent, rigid and easy to connect for ultrasonic sensors and load cell. The structural design is completed after this step.
A hydraulic shaker is used to provide the desired displacement input such as sine or random vibration to the moving platform. In order to actuate the moving platform, an electrohydraulic pump generates high oil pressure. Then, the servo valve controls the hydraulic cylinder motion directing this high pressure oil with the control signal produced by the controller. Hydraulic cylinder is attached to the moving platform and an LVDT sensor is also attached to the moving platform to measure the displacement of the platform. The measured displacement of the platform and the desired input signal from the computer are send to the controller. Controller uses these two signals and generates the control signal transmitted to servo valve through a PD control algorithm.
Fig. 1Experimental setup and sensors

Different sensors are located on the system to measure position of the platform, water height and the sloshing force with respect to time. The position of moving platform is measured by the LVDT. Ultrasonic sensor is used to track the water height at the desired point along the tank width. It measures the mean distance at target area with the flight time of sound waves. An s-type load cell is used to measure the sloshing force. Load cell. The frictional and inertial forces should be considered measuring the sloshing force.
Data acquisition hardware and software are used to transmit measured sensors data to computer and generate desired input signal to the system. A National Instruments™ data acquisition chassis, four analog output modules and an analog input module are used as data acquisition hardware. Different types of analog input modules are chosen for suitable types of sensor output signal such as voltage and current. Analog output module is used to control the input signal of experiment setup. Finally, the data acquisition chassis establishes the connection between computer and I/O modules. The whole system is controlled on computer with a Labview™ code. Starting and stopping of experiments, instant data monitoring, data recording operations are done by this software automatically.
A few tests are conducted to validate the proper functioning of experimental setup for different test cases. The position data of moving platform obtained from LVDT is investigated for several different input frequencies and amplitudes. In the light of these tests, it is came out that the experimental setup works properly as planned. It can simulate sine signal input at desired frequencies and amplitudes.
3. Sloshing experiments
The sloshing characteristic of the water in a rectangular tank will be investigated with the designed test setup. The water wave height data and sloshing force data will be collected during this investigation. The water wave height is measured with ultrasonic sensor and the ultrasonic sensor is placed 47 mm away from the nearest tank wall. Additionally, the net sloshing force is measured with load cell. However, it is not possible to obtain the net sloshing force by making only one measurement because of the inertial force of water tank. Therefore, two measurements, with water and without water, are made with the same input for all of the cases. Then, the net sloshing force is obtained by subtracting these 2 measurements each other. Also, it should be mentioned that the water tank is not directly paced on the moving platform since this would introduce measurement of the friction force between the tank and the moving platform. Therefore, small spheres are placed between the tank and the platform.
The water in a rectangular tank has a natural sloshing frequency depending on water height and tank length. Eq. (1) shows how the sloshing natural frequency is calculated for a given water height [5]. Also, it should be remembered that the below formula is accurate for small amplitude sloshing. For Eq. (1), f is sloshing natural frequency, g is gravity, a is tank width and h is water height:
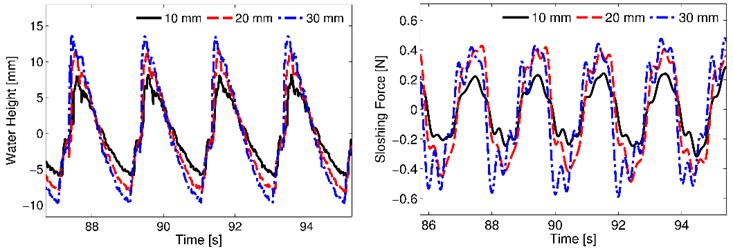
In this section, each test case is conducted for one constant frequency and different input amplitudes. The different input amplitudes are shown in legends for given graphs. Case 1 is conducted for 0.5 Hz input frequency and 10 mm, 20 mm and 30 mm input amplitudes. The water height is 15 mm for case 1 which has 0.5 Hz sloshing natural frequency. Fig. 2 shows the water height and sloshing force results for case 1. The wave height for 10 mm input amplitude is about 5-6 mm and it increases with the input amplitude. It raises to 10 mm for 20 mm input amplitude and 12 mm for 30 mm amplitude. The sloshing force amplitude has also similar attitude with water wave height. The sloshing force is about 0.2 N for 10 mm input amplitude. Then, the sloshing force raises to 0.4 N for 20 mm input amplitude. Finally, it raises to 0.45 N for 30 mm input amplitude. It can be said that both wave height and sloshing force increases with the input amplitude. However, it can be seen that the increase in wave height and sloshing force is not linearly proportional to increase in input amplitude.
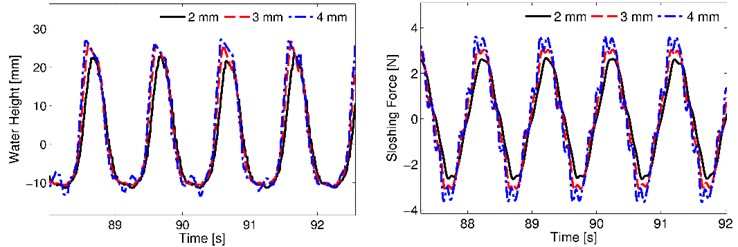
The second case is conducted with 1 Hz input motion frequency and 1 Hz sloshing natural frequency of water. The water level height for 1 Hz sloshing frequency is 65 mm. Fig. 3 shows the results for case 2. The wave heights for 2 mm, 3 mm and 4 mm input amplitude are about 22 mm, 25 mm and 27 mm in sequence. Additionally, the sloshing forces are 2.5 N, 3 N, 3.5 N, respectively. The results for case 2 are similar to case 1. On the other hand, water height and sloshing force amplitudes are much higher than case 1 despite the serious decrease of motion amplitudes.
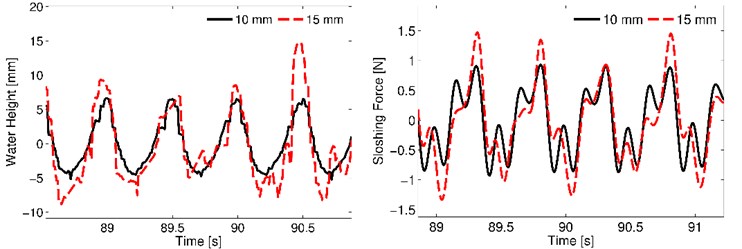
The third and last case is conducted with 2 Hz amplitude motion frequency. However, the water height in the tank is 65 mm and the natural frequency for this water height is equal to 1 Hz. The results for case 3 is shown in Fig. 4. The water height is about 5 mm for 10 mm input amplitude and it changes between 5-15 mm for 15 mm input amplitude. Moreover, the sloshing force is about 0.9 N for 10 mm input amplitude and it changes between 1 and 1.5 N for 15 mm input amplitude.
Fig. 2Results for 0.5 Hz motion frequency

Fig. 3Results for 1 Hz motion frequency

Fig. 4Results for 2 Hz motion frequency

In case 3, the water level heights are the same as case 2 and the input amplitudes in case 3 are about three to four times larger in comparison to case 2. However, the wave height and sloshing force are significantly lower in case 3 when compared to case 2. This is due to difference in motion frequency and sloshing natural frequency of water for this case. The sloshing natural frequency and motion frequency are both equal to 1 Hz for case 2 but the frequencies are not equal for case 3. The sloshing natural frequency of water is equal to 1 Hz and the motion frequency is 2 Hz for case 3. Therefore, the sloshing force and wave height values are low for case 3. For example, the sloshing force at the smallest input amplitude of 2 mm is 2.5 N for case 2 and the sloshing force is smaller than 1.5 N at the biggest input amplitude of 15 mm for case 3.
4. Conclusions
An experimental setup for investigation of sloshing is designed, manufactured and validated. It is used to investigate the liquid sloshing in a rectangular tank for sine input in this study. However, a building structure can be established on the experimental setup and the response reduction due to a tuned liquid damper also can be investigated with this test setup. Not only sine signal but also earthquake or random vibration signals can be used as desired input. Consequently, the test setup can be used in large set of single axis vibration tests.
Wave height and sloshing force are the parameters which was measured to understand the sloshing characteristic of liquid. Amplitudes of these parameters can be preferred being large or small accordingly constraints and purpose of the applications. So it is important to know that when the large amplitudes of water height and sloshing force occurs. Increasing the amplitude of the motion increases the amplitudes of wave height and sloshing force. However, the increase rate of wave height and sloshing force is considerably smaller than the increase in the input amplitude. In addition to this, the closeness of the motion frequency and the sloshing natural frequency of water has more impact on the sloshing characteristic than the motion frequency and amplitude. If the values of these mentioned two frequencies are the same or close, large sloshing forces and wave heights can be obtained.
References
-
Marivani M., Hamed M. S. Numerical study of slat screen pattern effect on design parameters of tuned liquid dampers. Journal of Fluids Engineering, Vol. 136, Issue 6, 2014, p. 201-212.
-
Marivani M., Hamed M. S. Numerical modeling of sloshing motion in a tuned liquid damper outfitted with a submerged slat screen. International Journal for Numerical Methods in Fluids, Vol. 65, Issue 7, 2011, p. 834-855.
-
Terzic J., Nagarajah C. R., Alamgir M. Fluid level measurement in dynamic environments using a single ultrasonic sensor and support vector machine (SVM). Sensors and Actuators A: Physical, Vol. 161, Issues 1-2, 2010, p. 278-287.
-
Pal P., Bhattacharyya S. K. Sloshing in partially filled liquid containers-numerical and experimental study for 2-D problems. Journal of Sound and Vibration, Vol. 329, Issue 21, 2010, p. 4466-4485.
-
Reed D., Yu J., Yehi H., Gardarsson S. Investigation of tuned liquid dampers under large amplitude excitation. Journal of Engineering Mechanics, Vol. 124, Issue 4, 1998, p. 405-412.
-
Li H., Li J., Zong Z., Chen Z. Numerical studies on sloshing in rectangular tanks using a tree-based adaptive solver and experimental validation. Ocean Engineering, Vol. 82, Issue 3, 2014, p. 20-31.
