Abstract
A FSI (fluid-structure interaction) numerical simulation was performed to investigate the flow field around a flexible flapping fin using an in-house developed CFD/CSD solver. The three-dimensional fluid-structure interaction of the flapping locomotion was achieved by loosely coupling preconditioned Unsteady Reynolds-Averaged Navier-Stokes (URANS) solutions and non-linear co-rotational structural solutions. The CSD solver was developed specifically for high flexible flapping fins by considering the large geometric nonlinear characteristics. Validation of benchmark tests illustrated the high-fidelity of the developed methodology. Then effect of flexural angles, flexural amplitude and flapping frequency in terms of Strouhal number were evaluated. Results demonstrated that different flexural angles will present different flow fields, and thus significantly varied thrust generation and pressure distribution. The thrust does not increase monotonically with flexural angles. The thrust is also found to increase with increasing Strouhal number while propulsive efficiency peaks within the range of 0.20.4, which lies in the middle of the range observed in nature. The appropriate combination of flexibility and Strouhal number illustrates higher efficiency and gives instruction for further design of flexible flapping fins.
1. Introduction
Underwater robot designs inspired by the behavior, physiology, and anatomy of fishes have been actively investigated in the past two decades due to their fascinating energy efficiency and outstanding ability in military and civil applications [1-5].
Owing to the fact that fish fins are flexible and tend to deform during flight [6], researchers have been focusing on the fin flexibility and thus experiments were conducted. Heathcote [7] performed a water tunnel study of the effect of spanwise flexibility on the thrust, lift and propulsive efficiency of a rectangular wing oscillating in pure heave. Thrust was dramatically enhanced due to its spanwise flexibility. Marais [8] investigated the effect of chordwise foil flexibility in the dynamical features of flapping-based propulsion by measuring the wake of a flexible foil undergoing pitching oscillations. It was shown that the average thrust is up to three times greater for the flexible foil than for the rigid foil. Lauder [9] conducted DPIV experiments to study the mechanics of locomotion of a bluegill Sunfish pectoral fin and noted that the fin generates thrust throughout the fin beat cycle, and that the upper and lower edges each produce distinct simultaneous leading edge vortices.
Also, progress was made for numerical analysis of flexible flapping fins to simulate and fully understand the unsteady flow structure. Deng [10] conducted a numerical study to investigate the effect of chordwise flexion on the propulsive performance of a two-dimensional flexible flapping foil using an in-house developed Unsteady Reynolds-Averaged Navier-Stokes solver. It was shown that propulsive efficiency is beneficial from the chordwise flexibility. A fluid-structure interaction model with an immersed-boundary method was used by Tian [11] to study the flow energy extraction by a flexible plate. Four systems were investigated in this work and power efficiency was enhanced by proper flexibility. Numerical simulations were used by Dong [12] to investigate the flow associated with a bluegill sunfish pectoral fin during steady forward motion. The simulations indicated that high propulsive performance was achieved by active and passive fin deformation and noted a complex attached tip vortex by connecting the vortex dynamics and fin kinematics with the surface distribution of the force on the fin.
Although there have been a number of experimental and numerical investigations, very few focused on the three-dimensional fluid-structure interactions of flexible fins and the effect of flexion patterns on propulsion performance of flexible fins. In this paper, an in-house computational approach was presented by combining preconditioned Navier-Stokes solutions and non-linear co-rotational structural solutions, aiming to accurately develop three-dimensional fluid-structure interaction of flexible flapping fins. Benchmark results from earlier researchers proved the high-fidelity of the mode. The unsteady aerodynamic mechanisms and effect of flexion on flexible flapping fins were comprehensively investigated in this study.
This paper is organized as follows. The exact closed-form equations of fluid and structure are derived in the next section. The coupling strategy, data transfer strategy and dynamic mesh method are discussed in the third section. Benchmark results are adopted for validation and effect of flexion on flexible flapping wings is discussed in the next two sections, followed by the conclusion in the last section.
2. Numerical methodology
2.1. Computational dynamics
Considering the unsteady flow structure and low-Reynolds-number characteristics of flexible flapping fins, arbitrary Lagrange Euler and preconditioned method was developed. The dual time-stepping three-dimensional preconditioned Navier-Stokes equations can be written in ALE form as:
whereandare the pseudotime and physical time, respectively , . Preconditioning matrix is:
where , is the convective fluxes, is the viscous fluxes, is the motion of the control volume , and denote, respectively, the time-varying velocity and the normal vector of the control volume contour. In Eq. (1), , is the preconditioning matrix which is employed to solve the system stiff problem, since the solver we primitively developed was to solve compressible flow. Here and designate the pseudo and physical time, respectively.
In the present study, is arbitrarily defined, corresponding to the so-called Arbitrary Lagrangian Eulerian (ALE) formulation. The KW-sst turbulence model is employed to close the N-S equations.
A detailed description of the in-house programmed URANS solver can be found in [13, 14].
2.2. Co-rotational finite element analysis
The flexible flapping fins exhibit highly nonlinear dynamic behavior. Total Lagrangian (TL), Update Lagrangian (UL) and Co-rotational (CR) formulation are three main methods for geometric nonlinear finite element analysis [15]. Currently, the co-rotational formulation has been extensively applied to geometric nonlinear analysis due to its efficiency and universality. The general form of in-house dynamic finite element equations is:
where is the nodal DOF vector, is the velocity vector and the acceleration vector. , , are mass stiffness matrix, damping matrix and tangent stiffness matrix, respectively. A fin-deform based three-node triangular shell element with 18 degree of freedom was developed by combining the optimal membrane element (OPT) and discrete Kirchhoff triangle (DKT) plate bending element, considering the geometric nonlinear analysis of thin flexible flapping fins with large rotation and small strain. Newton-Raphson iteration algorithms combined with an automatic load controlled technology were used for solving nonlinear equations. The detailed description of the co-rotational nonlinear finite element method can be found in [15-17].
3. Fluid-structure interaction
3.1. Coupling strategy
A staggered second-order accurate coupling algorithm by Farhat [18] was used which allows exchanges of motion (the kinematics mapping from the structure solver to the fluid solver) and loads (from the fluid to the structure solver) at the fluid-structure interface. Fig. 1 illustrates the loose-coupling process. In view of the fact that the domains and meshes of the two solvers are non-conformal, the mapping of these incompatible domains and meshes was based on RBF (radial based function) method that interpolates data between the structural and the aerodynamic domains.
Fig. 1Coupling process and data exchange

3.2. Coupling strategy
In view of the inherent large flapping motions, an efficient and robust dynamic mesh strategy was required for the flapping motion and the mesh motion caused by the structure deformation. In this paper, a RBF-based deformable overset grid proposed by Deng et al [19] was employed and is roughly addressed here as:
1. Overset mesh strategy is used for large flapping motion
2. RBF method is used for local structure deformation
3.3. Outline of Fluid-structure interaction
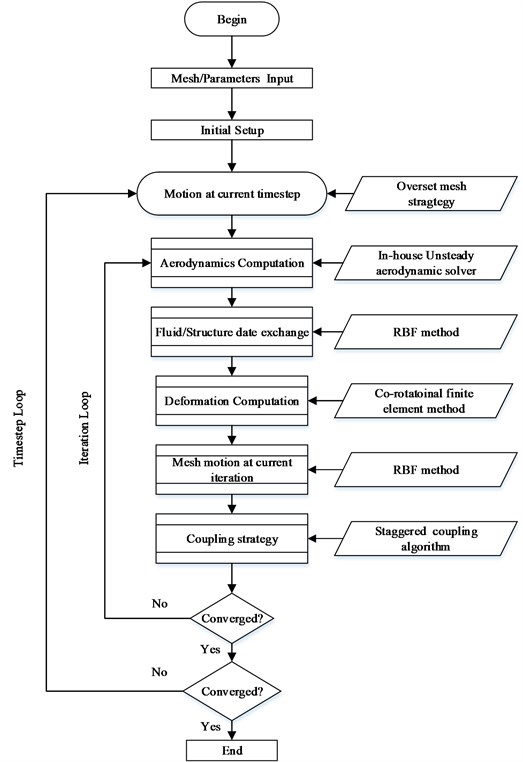
To fully understand the process, a step-by-step solution procedure to solve the system of FSI equations is given as follows:
1. Meshes and calculation parameters are input and initialized at the beginning.
2. A new timestep is set up based on flow and structure characteristics. A detail selection of timestep is introduced in chapter 5.2.
3. Rigid motion is defined at current timestep and the position and orientation of the global/flapping frames are calculated. The previous timestep variables such as displacements and forces are then updated.
4. Aerodynamic and structure computations are carried out at current timestep using in-house fluid-structure interaction solver. Usually several iterations are needed in one timestep.
5. Displacements and forces are transferred at fluid/structure interfaces using RBF and coupling methods after each iteration.
6. After all the iterations in one timestep, check the convergence for the current timestep by evaluating the forces transferred form fluid solver and calculated in the structure solver using convergence tolerance. If the solution is not converged, return to the beginning of current step and choose a revised tiemstep; if it does, proceed to the next time step.
Key steps of the in-house CFD/CSD method is highlighted in Fig. 2.
Fig. 2Outline of fluid-structure interaction
4. Solver validation and test analysis
The focus of this part is to assess the accuracy of the CFD/CSD method for flexible flapping fins. Two benchmark tests here were carried out: (1) a 2-D chordwise flexible foil experiment and (2) a 3-D flapping-wing experiment.
4.1. 2-D chordwise flexible foil
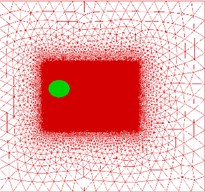
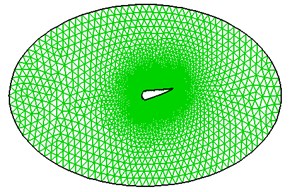
The unsteady flow structure around a 2-D chordwise flexible foil was simulated in the in-house CFD/CSD solver. A benchmark validation was carried out based on the result from [8], with main parameters listed in Table 1. The computational overset mesh system (see Fig. 3) was created using an unstructured mesh with a refinement at the boundary layer region of 1. The mesh was moved entirely during the computation following the specific pitching motion.
Table 12-D chordwise flexible foil parameters from [8]
Parameter | Value |
Chord | 23 mm |
Width | 5 mm |
1035 | |
0.3 | |
Amplitude | 7.5 mm |
Pitching angle | 7.5° |
Fig. 3a) Overset grid system and b) flexible foil at certain moment
a)
b)
A comparison of vortex distribution between Marais’s experiment and present FSI solver is presented in Fig. 4(a) and (b). As can be seen, the time varying vortex distributions are in reasonably good agreement with the experiment results. The slight differences of vortex distances suggest that the unsteady flow structure around flapping wings and wing stiffness distribution and deformation are difficult to precisely simulate. Overall, it can be seen that the computed result shows good agreements.
Fig. 4Comparison of vortex distribution between a) Marais’s experiment [8] and b) present solver
![Comparison of vortex distribution between a) Marais’s experiment [8] and b) present solver](https://static-01.extrica.com/articles/17186/17186-img5.jpg)
a)
![Comparison of vortex distribution between a) Marais’s experiment [8] and b) present solver](https://static-01.extrica.com/articles/17186/17186-img6.jpg)
b)
4.2. 3-D spanwise flapping wing
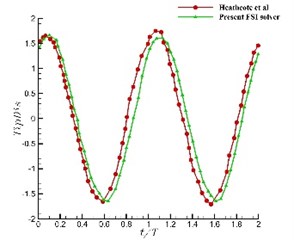
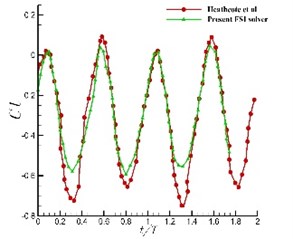
A spanwise 3-D flexible flapping-wing was simulated to further demonstrate the accuracy of the CFD/CSD solver. Experiments were conducted by Heathcote from [7] in a water tunnel on a straight, untapered wing, in pure plunging motion at Reynolds numbers ranging from 10,000 to 30,000. The main parameters are listed in Table 2.
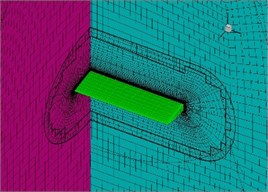
Fig. 5 shows the overset grid system of the computational domain around the wing, with structured meshes about 6 million cells and a refinement at the boundary layer region. The overset mesh grid system moved according to the specified motion law and result comparisons are illustrated in Fig. 6(a) and 6(b).
Table 23-D spanwise flexible wing parameters from [7]
Parameter | Value |
Wing section | NACA0012 |
Chord | 100 mm |
Length | 300 mm |
30000 | |
Reduced frequency | 1.8 |
Incoming velocity | 0.3 m/s |
Elastic modulus | 210 GPa/250 kPa |
Fig. 5a) Overset grid system for 3-D wing model and b) CSD meshes
a)

b)
Fig. 6a) Tip distance and b) thrust coefficient comparison
a)
b)
As shown in Fig. 6, both the normalized vertical displacements and the thrust coefficients are in good agreement with the measurements. Both phase and amplitude agreements demonstrated that the present FSI-based model is capable to reasonably predict the flexible wing.
It is seen that the above computed results showed good agreements with experiment data from both cases. However, slight difference in both lift and thrust coefficients especially the peak values suggested that wing stiffness distribution and deformation are difficult to extremely precisely simulate despite the complex flow structure. In general, agreements in both phase and amplitude demonstrate that the present FSI-based model is capable of reasonably predicting the flexion of flexible wings.
In the meanwhile, three main aspects can be considered for future investigations on the accuracy:
(1) Fluid turbulence models can be modified specifically for flapping motions to improve precision.
(2) Co-rotational finite elements can be further improved considering the large geometric nonlinear characteristics and dynamics.
(3) High accuracy algorithms can be developed at the interface of fluid-structure interaction instead of the current loose coupling.
5. Effect of flexibility on the propulsive performance
5.1. Computational setup
So far we have addressed that the present FSI model is robust and efficient in modeling aeroelastic structural dynamics and aerodynamics of flexible fins. In this section, an extensive discussion was discussed on how the inherent flexibility of flapping fins affects its aerodynamic performance in terms of the flow structure, the force-production and efficiency. A high flexible fin with NACA0015 as its section was presented in the study to explore the effect of flexion on the propulsive performance and aerodynamic efficiency of fins, with schematic in Fig. 7 and main parameters in Table 3.
Fig. 7Schematic of high flexible fin (unit/mm, half model)
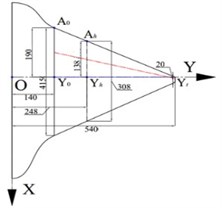
Table 3High flexible fin parameters
Parameter | Value |
Fin section | NACA0015 |
Pitching angle | 10°-30° |
Plunging angle | 10°-30° |
2000-20000 | |
Frequency | 1.8 |
Incoming velocity | 0.1-1 m/s |
5.2. Motion law illustration
The kinematic model of flapping fins was constructed based on natural flyers and former experiments. Two main basic motions were considered to describe the flapping fin movement: (1) flapping about the axis, described by the fin plunging angle, and (2) rotating about the axis, described by the fin pitching angle. The equations of motion were specified here in Eq. (3-4):
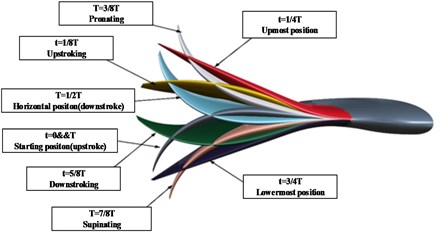
In detail, the preconditioned motion of flapping fins that contains eight main phases is illustrated in Fig. 8 with main features introduced as follows.
1. Flapping and twisting. Fins rotate about their spanwise and chordwise axis, generating flapping and twisting motions. Downstroke and upstroke are the basic motions the fin makes whilst flapping. Twisting is the primary method of controlling the fin’s angle of attack. It is also how the fin pronates and supinates as it goes through the full flap cycle.
2. Downstroke and upstroke. The downstroke consists of the fin moving from its highest positive fin flap angle, through to the most negative fin angle (1/4-3/4). The upstroke is the opposite of this motion (3/4-1/4). The combination of a full downstroke and upstroke makes a flapping cycle.
3. Pronation and supination. In natural flyers, the leading edges are always strong. Therefore, leading edges are always some phase angles ahead of rear parts. At the end of a downstroke, leading edges are rotated through a large angle such that the incidence angle remains constant through the subsequent upstroke. The top surface of the fin then becomes the bottom surface. This process is the supination of the fin. At the end of the upstroke, the fin rotates through a similar angle in the opposite direction, so that the leading edge is still leading and the surfaces have again switched; this is the pronation of the fin.
Fig. 8Illustration of motion of high flexible fin (half model)
To investigate and fully understand the effect of flexion on the propulsive performance and aerodynamic efficiency of flexible flapping fins, computations were conducted by measuring low/medium/high flexible models. An extensive investigation on the effect of flexion was then conducted. Different flapping frequencies and fin flexibilities were studied to find out the effect of these parameters on propulsive performance and aerodynamic efficiency.
Usually, a proper grid is chosen based on trade-offs between computational accuracy and computational costs. Considering the fact that meshes in CFD analysis are usually more refined than those in CSD meshes. In this study, a fine grid (30×24×10 elements), medium grid (60×48×10 elements) and coarse grid (15×12×5 elements) were initially chosen for CSD empirically. Also, a fine grid (60×48×10 elements), medium grid (120×96×20 elements) and coarse grid (30×24×5 elements) were initially chosen for CFD, respectively. The simulation results of these grids show that the result of coarse grid is less accurate than the others and the medium grid costs less than that of fine grid. Thus, medium grid, which is accurate enough, was chosen.
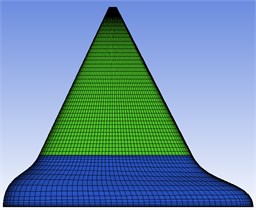
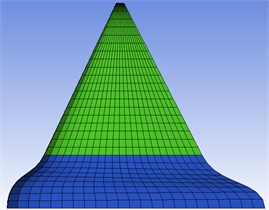
Fig. 9 shows the CFD (60×48×10 elements) and CSD (30×24×5 elements) meshes used in this paper.
Fig. 9a) CFD meshes and b) CSD meshes
a)
b)
In CFD analysis, only half model was used considering the symmetrical characteristics. Velocity inlet and pressure outlet boundary were adopted to simulate the farfield boundaries. In CSD analysis, all degrees of freedom were set stationary for inner part of the fin, while the outer part of the fin moved according to the motion law.
Different parameters and a time step of 0.001 were used for all the simulations.
First, flexion was studied in cases with different and . In order to investigate the effect of flexion on thrust, computation is operated on 10°, 15°, 20°, 25°, 30° and 10°, 15°, 20°, 25°, 30°. Plots of thrust coefficient against and is show in Fig. 10 for different flexibilities. It is shown that increases with the increment of flapping angle and twisting angle. Among the two angles, the thrust increases faster with the same increment of twisting angle than that of flapping angle, which means that the twisting angle plays a more important role on thrust performance.
Fig. 10Thrust coefficient for different plunging and pitching angles
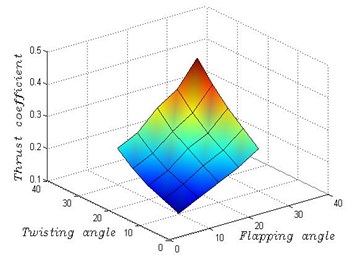
Fig. 11Efficiency for different flexibility and Strouhal number
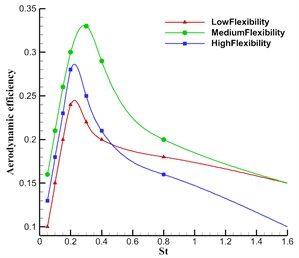
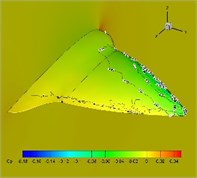
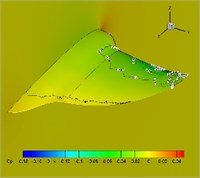
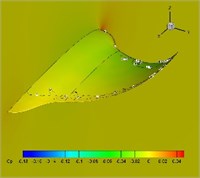
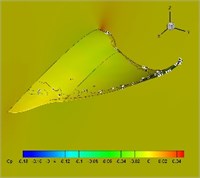
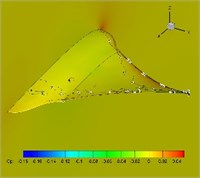
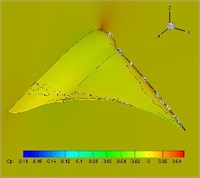
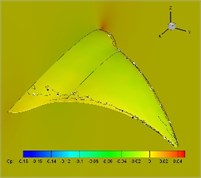
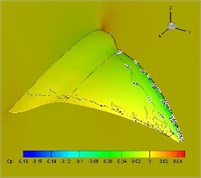
Fig. 12Pressure coefficient distribution in one cycle (plunging angle = 25°, pitching angle = 25°, Strouhal number = 0.5)
a)0.125
b)0.25
c)0.375
d)0.5
e)0.625
f)0.75
g)0.875
h)0/1
A further study of the relationship between frequency, flexion and efficiency was carried out. Aerodynamic efficiency is plotted as a function of flapping frequencies. In this paper, 0.05 Hz, 0.1 Hz, 0.15 Hz, 0.2 Hz, 0.3 Hz, 0.4 Hz and 0.8 Hz. It is seen that the aerodynamic efficiency firstly increases sharply with increasing flapping frequency and displays a decreasing trend afterwards. Peak efficiency is a matter of appropriate combination of frequency and flexion, which lies in 0.2-0.4. Also, the efficiency increases and then decreases when Strouhal number goes up within the same flexible model and peaks within the range of 0.2 0.4, which lies in the middle of the range observed in nature. The efficiency of the intermediate flexible fin is significantly higher than that with low flexibility and high flexibility. Therefore, it can be concluded that the flexibility can offer significant efficiency benefits, which agrees with other studies referred to in the introduction.
Distribution of pressure coefficient in one cycle with 25-degree flapping angle and twist angle is presented in Fig. 12. It is found from the figure that upper surfaces of the highly flexible wings present large lift loss, which partially explains the reason of thrust decreases.
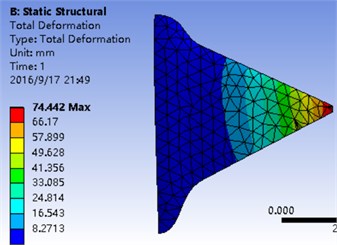
Total deformation distribution at the end of one cycle is presented in Fig. 13. As can be seen, structures of fins deform under the pressure computed in CFD analysis. The maximum deformation is shown at the tip of fins, which is in accord with the structure stiffness distribution. Also, the maximum deformation suggests that medium flexion can maintain its structure under pressure and keep good aerodynamic and structural performances.
Fig. 13Total deformation distribution at the end of one cycle (plunging angle = 25°, pitching angle = 25°, Strouhal number = 0.5)
6. Conclusions
A FSI numerical simulation was performed to investigate the flow field around a flexible flapping fin using an in-house developed CFD/CSD solver. Validation of benchmark tests illustrated the high-fidelity of the developed methodology. Besides, the unsteady aerodynamic mechanisms and effect of flexion on flexible flapping fins were comprehensively investigated in this study. The effect of flexural angles, flexural amplitude and flapping frequency in terms of Strouhal number were then evaluated. Results indicated that (a) the thrust production and power consumption does not increase monotonically with flexural angles at the same flapping frequency and (b) the most efficient flight envelope was found within the range of 0.2 0.4, corresponding to the operating regime of the flyers and swimmers in nature. The appropriate combination of frequency and flexibility of flexible flapping fins exhibit the maximal flapping efficiency which gives instruction for further design of flexible flapping fins.
References
-
Lauder G. V. Recent advances and new directions. Annual Review of Marine Science, Vol. 7, 2015, p. 521-545.
-
Sfakiotakis M., Lane D. M., Davies J. B. C. Review of fish swimming modes for aquatic locomotion. IEEE Journal of Oceanic Engineering, Vol. 24, Issue 2, 1999, p. 237-252.
-
Liao J. C., Beal D. N., Lauder G. V. Fish exploiting vortices decrease muscle activity. Science, Vol. 302, Issue 5650, 2003, p. 1566-1569.
-
Fish F. E., Lauder G. V. Passive and active flow control by swimming fishes and mammals. Annual Review of Fluid Mechanics, Vol. 38, 2006, p. 193-224.
-
Weis F. Quick estimates of flight fitness in hovering animals, including novel mechanisms for lift production. Journal of Experimental Biology, Vol. 59, Issue 1, 1973, p. 169-230.
-
Lauder G. V. Flexible fins and fin rays as key transformations in ray-finned fishes. Great Transformations in Vertebrate Evolution, Vol. 31, 2015.
-
Heathcote S., Wang Z., Gursul I. Effect of spanwise flexibility on flapping wing propulsion. Journal of Fluids and Structures, Vol. 24, Issue 2, 2008, p. 183-199.
-
Marais C., Thiria B., Wesfreid J. E. Stabilizing effect of flexibility in the wake of a flapping foil. Journal of Fluid Mechanics, Vol. 710, 2012, p. 659-669.
-
Lauder G. V., Madden P. G. A., Mittal R. Locomotion with flexible propulsors: I. Experimental analysis of pectoral fin swimming in sunfish. Bioinspiration and Biomimetics, Vol. 1, Issue 4, 2006, p. 25-34.
-
Deng S., Xiao T. Effect of flexion on the propulsive performance of a flexible flapping wing. Proceedings of the Institution of Mechanical Engineers, Part G: Journal of Aerospace Engineering, 2015, p. 0954410015623304.
-
Tian F., Young J., and Lai J. Improving power-extraction efficiency of a flapping plate: from passive deformation to active control. Journal of Fluids and Structures, Vol. 51, Issue 27, 2014, p. 384-392.
-
Dong H., Bozkurttas M., Mittal R. Computational modelling and analysis of the hydrodynamics of a highly deformable fish pectoral fin. Journal of Fluid Mechanics, Vol. 645, 2010, p. 345-373.
-
Shen Y., Cai H. Aerodynamic characteristics of multiple flapping wing configurations. Journal of Vibroengineering, Vol. 18, Issue 3, 2016, p. 1839-1848.
-
Xiao T., Ang H. S., Yu S. A preconditioned dual time-stepping procedure coupled with matrix-free LU-SGS scheme for unsteady low speed viscous flows with moving objects. International Journal of Computational Fluid Dynamics, Vol. 21, Issues 3-4, 2007, p. 165-173.
-
Felippa C. A., Haugen B. A unified formulation of small-strain corotational finite elements: I. Theory. Computer Methods in Applied Mechanics and Engineering, Vol. 194, Issue 21, 2005, p. 2285-2335.
-
Yang J., Xia P. Corotational nonlinear dynamic analysis of thin-shell structures with finite rotations. AIAA Journal, Vol. 53, Issue 3, 2014, p. 663-677.
-
Chimakurthi S. A Computational Aeroelasticity Framework for Analysing Flapping Wings. The University of Michigan, 2009.
-
Farhat C., Lesoinne M. Two efficient staggered algorithms for the serial and parallel solution of three-dimensional nonlinear transient aeroelastic problems. Computer Methods in Applied Mechanics and Engineering, Vol. 182, Issue 3, 2000, p. 499-515.
-
Deng S., Xiao T., Oudheusden B. A dynamic mesh strategy applied to the simulation of flapping wings. International Journal for Numerical Methods in Engineering, Vol. 106, Issue 8, 2016, p. 664-680.
About this article
This work has been supported by Research Fund of State Key Laboratory of Mechanics and Control of Mechanical Structures (Grant No. 1001-IZD15001-1505 MCMS-0415G01) and China Postdoctoral Science Foundation (Project Number 2014M551592).
