Abstract
The nonlinear seismic responses of steel buildings with perimeter moment resisting frames (MRF), modeled as complex 3D MDOF systems, are calculated and the ductility demands, ductility reduction factors and the force reduction factors (R), are studied. Equivalent 3D models with spatial MRF, two-dimensional models, and equivalent SDOF systems (SD), are also considered. Results indicate that the global and local force reduction factors significantly vary from one structural representation to another and that they are much larger for the SD models. One of the reasons for this is that, although there is equivalence between the SD and MDOF models, the dissipated energy and the number of incursions in the inelastic range are significantly larger for the SD models. In addition, while for the SD models total plasticization occurs, for the SAC and EQ models, even for significant yielding, plastic hinges are developed only in a relatively small number of structural members; therefore, using the R factors of the SD models may be conservative. According to the results obtained in this research for the more realistic representation of the steel building (3D), the value of 8 suggested in many codes for the R factor for ductile MRF cannot be justified. It is only justified for the SD systems. The implication of this is that non-conservative designs may be obtained if so large value is used. More transparence is needed in the codes regarding the magnitude and the components involved in the R factor.
1. Introduction
Even though in current building codes, the inelastic behavior of structures is explicitly considered by using nonlinear methods, shifting away from the traditional elastic analysis, simplified procedures like the Static Lateral Force Method (SLFM), are broadly used. Most of the major seismic building codes around the world permit the use of this procedure for regular structures with relatively short periods. Thus, conventional seismic design considered in seismic codes is essentially force-based with a final check on displacements. In the mentioned procedure, the force (also called modification or strength) reduction factor (R) represents one of the most controversial issues. It plays an important role in the determination of the design seismic forces of any building structural system since it allows for a reduction of the elastic strength demands, which produces that structures behave in elastically under the action of moderate and severe earthquakes.
The R factor mainly depends on the capacity of the structures to dissipate energy due to inelastic behavior of the material and on the structural over strength [1-4]. This factor can mathematically be expressed as:
where Rμand RΩ are the ductility reduction factor and the structural over strength, respectively. The first of these two factors represent the capacity of a structure to dissipate energy. It is particularly important for steel structures since the beneficial effect of ductility (μ) is supposed to come from different sources. Although the concept of ductility is constantly used in the profession, at present there is no an engineering definition of it in the specifications and codes and there is no unanimity in the profession on how to define it; it is used in an indirect way in design [5]. It is worth to mention that the force reduction factors prescribed in seismic codes are intended to account for damping in addition to energy dissipation capacity and over strength, and that the level of reduction of the elastic force demands is importantly derived from observations of the performance of different structural systems during past earthquakes.
For steel buildings, among the different structural systems, moment resisting frames (MRF) have been the most popular because they provide maximum flexibility for space utilization and because of their high ductility capacity. The characteristics of the basic structural system, however, have significantly changed over the years in some developed countries like USA. Because of the fragility of weak-axis connections and economic considerations, the standard practice during the recent past (after the 80 s) in USA has been to build steel buildings with MRF only on two frame lines in each direction, usually at the perimeter (PMRF). The redundancy of the buildings, however, is tremendously reduced. In Mexico, it is common to use steel buildings with MRF at the perimeter and at the interior (SMRF) in both horizontal directions. Due to the large number of fully restrained connections (FRC) of this system, its redundancy is expected to be greater than those of the systems with only PMRF although the structural analysis is more complicated. Comparison of the performance of these two structural systems, in terms of force reduction factors is undoubtedly of great interest to the profession and therefore it is addressed in this research. Equivalent models with SMRF are considered for this purpose.
An important issue that deserves our attention is that steel buildings with PMRF are usually designed as plane frames to resist the total lateral seismic loading, ignoring the presence of interior gravity frames (IGF). Modeling the buildings as plane frames may not represent the actual behavior of the structure since their dynamic properties in terms distribution of mass and stiffness and energy dissipation characteristics may be quite different. Moreover, the participation of some elements is not considered and the contribution of some vibration modes is ignored. The estimation of the ductility demands and the force reduction factors of steel buildings with PMRF and SMRF, modeled as complex three-dimensional (3D), and the comparison with those of 2D and equivalent single degree of freedom (SDOF) systems, constitutes the primary objective of this paper.
2. Literature review
There have been many studies regarding the evaluation of the μ demands and the R factor for SDOF systems. This factor was first introduced in ATC-3-06 [6] in the late 70 s and was used to reduce the elastic base shear calculated by elastic analysis according to a 5 % damped acceleration response spectra. Other of the first investigations was conducted by Newmark and Hall [7]. They proposed a procedure to relate Rμ and μ by constructing the inelastic response spectra from the basic elastic design spectra. Hadjian [8] studied the reduction of the spectral accelerations to account for the inelastic behavior of structures. Miranda and Bertero [9] proposed simplified expressions to estimate the inelastic design spectra as a function of the maximum tolerable ductility, the period of the system and the soil conditions of the site. Ordaz and Perez-Rocha [10] proposed a rule to estimate strength-reduction factors for SDOF elasto-plastic oscillators. Borzi and Elnashai [11] derived values of the strength reduction factors needed for pre-determined levels of ductility. Arroyo-Espinoza and Terán-Gilmore [12] from the study of the dynamic response of SDOF systems proposed expressions to estimate strength reduction factors. Levy et al. [13] used an equivalent linearization approach to derive approximate harmonic equivalent stiffness and damping for bilinear systems in the context of earthquake resistant. Karmakar and Gupta [14] performed a parametric study to estimate the dependence of strength reduction factors on strong motion duration, earthquake magnitude, geological site conditions, and epicentral distance for elastoplastic oscillators. Karmakar and Gupta [15] proposed a new model to estimate strength reduction factor spectrums in terms of a pseudo-spectral acceleration spectrum and ductility demand ratio for elastoplastic oscillators.
More recently, Ayoub and Chenouda [16] developed response spectra plot for inelastic degrading structural systems subjected to seismic excitations. They proposed constitutive models for degrading structures which were calibrated against experimental data. Rupakhety and Sigbjörnsson [17] presented ground-motion prediction equations for ductility demand and inelastic spectral displacement of constant-strength perfectly elastoplastic SDOF oscillators. Sanchez-Ricart [18] reviewed the backgrounds that support the values of the reduction factor in the United States, Europe and Japan. It was concluded that the design reduction factor cannot be deduced directly from the performance of the buildings after real earthquakes since the performance implicitly includes the design structural over strength. In spite of the important contributions of these studies on the evaluation of force reduction factors, most of them were limited to SDOF systems. They did not consider the inelastic behavior and energy dissipation of the structural elements existing in actual systems. Reyes-Salazar and Haldar [19-22] found that moment resisting steel plane frames are very efficient in dissipating earthquake-induced energy and that the dissipated energy has an important effect on the structural response. Reyes-Salazar [23] showed that the values of strength reduction factors depend on the amount of dissipated energy, which in turn depends on the plastic mechanism formed in the frames as well as on the loading, unloading and reloading process at plastic hinges.
A significant number of studies have also been carried out about the evaluation of the μ and R factors for multi degree of freedom (MDOF) systems. Nassar and Krawinkler [24] studied the relationship between force reduction factors and ductility for SDOF and simplified (three-story single-bay) MDOF systems. Santa-Ana and Miranda [25] studied the strength reductions factors for several steel frames modeled as plane MDOF systems considering different soil conditions. Elnashai and Mwafy [26] investigated the relationship between the lateral capacity, the design force reduction factor, the ductility factor and the over strength factor for reinforced-concrete buildings. Reyes-Salazar [23] studied the ductility capacity of plane steel moment-resisting frames; local, story and global ductility were considered. It was shown that using SDOF systems to estimate the ductility capacity may be a very crude approximation. Medina and Krawinkler [27] presented an evaluation on drift demands of regular moment resisting frame structures subjected to ordinary ground motions considering the uncertainty due to differences in the frequency content of the ground motions. In a related study, Medina and Krawinkler [28] studied the strength demands relevant for the seismic design of moment-resisting frames. Cai et al. [29] estimated ductility reduction factors for MDOF systems by modifying ductility reduction factors of SDOF systems through a modification factor. Karavasilis et al. [30] proposed simplified expressions to estimate the behavior factor of plane steel moment resisting frames. Chopra [31] studied the force reduction factors for MDOF systems modeled as shear buildings and its corresponding equivalent SDOF systems. Mollaioli and Bruno [32] developed constant ductility spectra for SDOF and MDOF systems. Ceylan et al. [33] estimated the strength reduction factor for prefabricated industrial structures having a single story, one and two bays. Ganjavi and Hao [34] studied the seismic response of linear and nonlinear MDOF systems subjected to a group of earthquakes recorded on alluvium and soft soils, considering different shear strength and stiffness distribution patterns. Kumar et al. [35, 36] investigated the influence of the frequency content of ground motions, as well as structural parameters and the level of inelasticity, on the inter-story shear and inter-story drift demands in frames designed according to Eurocode 8. Abdollahzadeh and Banihashemi [37] evaluated the response modification factors of dual moment resistant frame with buckling restrained braced (BRB); the tentative value of 10.47 was suggested for ASD method. Lopez-Barraza et al. [38] studied the reduction of the response in terms of inter-story drifts for plane frames with rigid and post-tensioned connections. Rivera et al. [39] evaluated the effect of the dissipated energy on the reduction of the seismic response of plane steel frames modeled as MDOF systems and equivalent SDOF systems. Abdollahzadeh and Faghihmaleki [40] studied some methods of seismic rehabilitation of steel structures of medium moment frame with braces considered in the seismic provisions for steel structures (ANSI/AISCF). Reyes-Salazar et al. [41] studied the ductility reduction factor (Rμ) for buildings with moment resisting steel frames (MRSF) which were modeled as complex MDOF systems, considering an intermediate level of inelastic structural deformation. They showed that the ductility reduction factors associated to global response parameters may be quite different than those of local response parameters. However, this study was for an intermediate level of inelastic deformation and the over strength factor was not considered. Serror et al. [42] numerically evaluated the values of both damping and ductility reduction factors for steel moment resisting frames with supplemental linear viscous dampers. Hetao et al. [43] investigated the influence of cumulative damage on seismic response modification factors, taking into account the cumulative damage due to hysteretic energy absorption and a new method was developed for improved estimates of the response modification factors. Abdi et al. [44] proposed an equation to determine response modification factors for steel structures equipped with viscous damper devices.
In most of the above-mentioned studies regarding the evaluation of force reduction factors for MDOF systems, plane shear buildings, plane moment resisting steel frames or a limited level of inelastic deformation were considered. It is important to emphasize that modeling buildings as plane frames may not represent their actual behavior since the participation of some elements is not considered and the contribution of some vibration modes are ignored. In addition, limited level of inelastic deformation is not associated to the ductility capacity and consequently to the maximum force reduction factors. Moreover, in most of the studies, the ductility demands or the force reduction factors were evaluated in terms of global response parameters. By using the advancement in computer technology, it is now possible to estimate the seismic responses of buildings by modeling them as complex three-dimensional (3D) MDOF systems with thousands of degrees of freedoms, applying the seismic loadings in time domain as realistically as possible. Then, the accuracy of estimating the force reduction factors, or any related parameter, for simplified systems can be evaluated by comparing the results with those obtained from the complex formulation.
3. Objectives
As stated earlier, the primary objective of this paper is to estimate the ductility demands and the force reduction factors of steel buildings modeled as complex-3D-MDOF systems. The particular case of steel buildings with PMRF is considered. The specific objectives are:
1. Estimate the ductility demands (μ) of steel buildings with PMRF modeled as 3D systems. An equivalent 3D structural representation of steel buildings with spatial SMRF is also considered. The results are compared with those of 2D structural representations and with those of equivalent SDOF systems. Several levels of structural deformations are considered.
2. Calculate and compare the ductility reduction factors (Rμ) for the four above mentioned structural representation. The comparison is made in terms of global (inter-story base shear) and local (axial load and bending moment) response parameters.
3. Calculate the values of the force reduction factors (R) for the four above mentioned structural representations and compare them with the values specified in the codes.
4. Methodology
4.1. Parameters of the study
Two steel building models and twenty strong seismic motions are considered in the study. Four structural representations are used: complex 3D buildings with PMRF, equivalent complex 3D buildings with SMRF, 2D models, and equivalent SDOF systems. The ductility demands, ductility reduction factors and force reduction factors for Global (inter-story shears) and local response parameters (resultant forces at particular structural members) are considered. The used seismic motions are scaled up to get several levels of structural deformations. The Ruaumoko computer program [45] is used to perform the required step by step nonlinear seismic analyses, where the Newmark Constant Average Acceleration Method is used to numerically evaluate the seismic response. The lumped mass matrix, Rayleigh Damping and large displacement effects are also considered. No strength degradation member, bilinear behavior with 5 % of the initial stiffness in the second zone and concentrated plasticity are assumed in the analysis. The interaction axial load-bending moment is given by the yield interaction surface proposed by Chen and Atsuta [46].
4.2. Structural models
4.2.1. SAC models (3D buildings with PMRF)
Several steel model buildings were designed, as part of the SAC steel project [47], by three consulting firms. They considered 3-, 10 - and 22- level buildings. The 10- level building has a single-level basement and the 22-level building has a 2-level basement. These buildings are supposed to satisfy all code requirements existed at the time of the project development for the following three cities: Los Angeles (Uniform Building Code 1997) [48], Seattle (Uniform Building Code 1997) [48] and Boston (Building Officials & Code Administration) [49]. The 3- and 10- level buildings located in the Los Angeles area are considered in this study for numerical evaluations to address the issues discussed earlier. They will be denoted hereafter as Models SAC1 and SAC2, respectively and, in general, they will be referred as the SAC Models. They are considered to be bench mark models and have been used in many investigations. The fundamental periods of Models SAC1 and SAC2 are estimated to be 1.02 and 2.34 sec. respectively. The elevations of the models are given in Fig. 1(a) and 1(d) and their plans are given in Fig. 1(b) and 1(e). The particular elements to study the response in terms of local responses parameters are given in Fig. 1(c) and 1(f) for Models SAC1 and SAC2, respectively. In these figures, the PMRF are represented by continuous lines and the interior gravity frames (GF) by dashed lines. The connections in the steel buildings are assumed to be fully restrained and perfectly pinned for the PMRF and the GF, respectively. For Model SAC2, the PMRF meet at a corner.
Fig. 1Elevation, plan and element location for Models SAC1 and SAC2
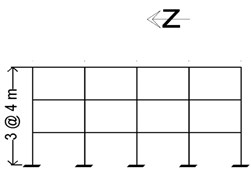
a) Elevation SAC1
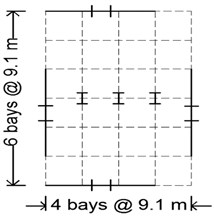
b) Plan SAC1
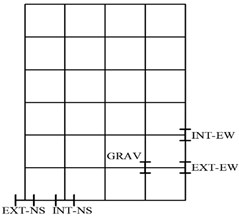
c) Studied elements SAC1
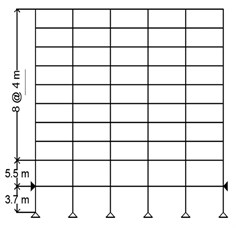
d) Elevation SAC2
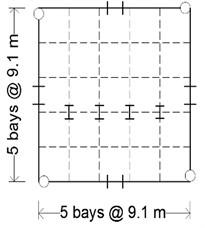
e) Plan SAC2
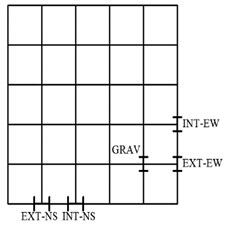
f) Studied elements SAC2
In this case, the beam-to-column connections are considered to be pinned to eliminate weak axis bending Fig. 1(e). As it can be seen, the buildings are essentially symmetrical in plan, thus no significant torsional moments are expected to occur. Sizes of beams and columns, as reported [47], are given in Table 1 for the two models. The columns of the PMRF of Model SAC1 are fixed at the base while those of Model SAC2 are pinned, as considered in the FEMA report. In all these frames, the columns are made of steel Grade-50 and the girders are of A36 steel. For both models, the columns in the GF are considered to be pinned at the base. All the columns in PMRF bend about the strong axis and the strong axes of the gravity columns are oriented in the N-S direction, as indicated in Fig. 1(b) and 1(e)). The designs of the PMRF in the two orthogonal directions were practically the same. The damping is considered to be 3 % of the critical damping. The buildings are modeled as complex MDOF systems. Each column is represented by one element and each girder of the PMRF is represented by two elements, having a node at the mid-span. The slab is modeled by near-rigid struts, as considered in the FEMA study [47]. Each node is considered to have six degrees of freedom when the buildings are modeled in three dimensions. Additional information about the models can be obtained from the FEMA report [47].
4.2.2. EQ models (3D buildings with SMRF)
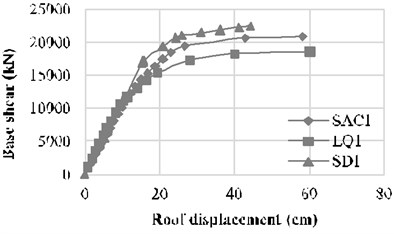
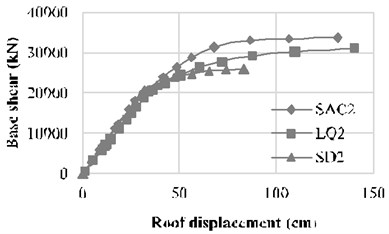
The equivalent 3D buildings (EQ) with SMRF models are designed in such a way that their fundamental period, total mass and lateral stiffness are fairly the same as those of the corresponding buildings with PMRF. The member properties of the equivalent buildings are selected for one direction, say the N-S direction, and then in order to keep the equivalence as close as possible for both horizontal directions, the same properties are assigned to the other direction. The member properties of the EQ models are selected by considering the beam and column properties of the PMRF oriented in the direction under consideration, in addition to those of the beams and columns of the perpendicular (transverse) PMRF. It must be noted that the columns of the transverse frames will bend with respect to their minor axis. The ratio of moments of inertia, or plastic moments, between beams and columns was tried to keep as close as possible for the two structural systems. The same was considered for the case of interior and exterior columns. The equivalent 3D models are referred, in general, as EQ Models and, in particular, as Models EQ1 and EQ2 for the 3- and 10-level buildings, respectively. Their fundamental periods of lateral vibration are estimated to be 1.08 and 2.42 sec, respectively. Fig. 2 shows the pushover curve for the SAC and EQ models.
Fig. 2Pushover curves; a) 3-level models, b) 10-level models
a)
b)
4.2.3. D models
For seismic analysis and design purposes, steel buildings with PMRF are modeled as plane frames. In this process, it is assumed that, for a given horizontal direction, half of the seismic loading is supported by each of the PMRF oriented in that direction. Thus, half of the total mass is assigned to each PMRF, which constitutes the plane model. The fundamental periods of vibration are estimated to be 1.13 and 2.46 sec. for the 3- and 10-level models, respectively.
To evaluate the accuracy of this practice, the seismic response in terms of ductility demands and force reduction factors are estimated for 2D structural representation and compared to those of the SAC models. In order to consider the more realistic loading condition, the 3D models are simultaneously excited by the three seismic components of the earthquakes considered; the 2D models are obviously excited by one horizontal component at a time and the vertical component. The pushover curve for this model is not presented in Fig. 2, but, as expected, its ordinate values (base shear) are essentially half of those of the SAC model.
Table 1Beam and columns sections for the SAC models
Model | Moment resisting frames | Gravity frames | |||||
Story | Columns | Girder | Columns | Beams | |||
Exterior | Interior | Below penthouse | Others | ||||
1 | 1 \ 2 | W14×257 | W14×311 | W33×118 | W14×82 | W14×68 | W18×35 |
2 \ 3 | W14×257 | W14×312 | W30×116 | W14×82 | W14×68 | W18×35 | |
3 \ Roof | W14×257 | W14×313 | W24×68 | W14×82 | W14×68 | W16×26 | |
2 | –1 / 1 | W14×370 | W14×500 | W36×160 | W14×211 | W14×193 | W18×44 |
1 / 2 | W14×370 | W14×500 | W36×160 | W14×211 | W14×193 | W18×35 | |
2 / 3 | W14×370 | W14×500, W14×455 | W36×160 | W14×211, W14×159 | W14×193, W14×145 | W18×35 | |
3 / 4 | W14×370 | W14×455 | W36×135 | W14×159 | W14×145 | W18×35 | |
4 / 5 | W14×370, W14×283 | W14×455, W14×370 | W36×135 | W14×159, W14×120 | W14×145, W14×109 | W18×35 | |
5 / 6 | W14×283 | W14×370 | W36×135 | W14×120 | W14×109 | W18×35 | |
6 / 7 | W14×283, W14×257 | W14×370, W14×283 | W36×135 | W14×120, W14×90 | W14×109, W14×82 | W18×35 | |
7 / 8 | W14×257 | W14×283 | W30×99 | W14×90 | W14×82 | W18×35 | |
8 / 9 | W14×257, W14×233 | W14×283, W14×257 | W27×84 | W14×90, W14×61 | W14×82, W14×48 | W18×35 | |
9 / Roof | W14×233 | W14×257 | W24×68 | W14×61 | W14×48 | W16×26 | |
4.2.4. SDOF (SD) models
One equivalent SDOF model is considered for the 3- and 10-level buildings. They will be particularly denoted hereafter as Models SD1 and SD2, respectively, and as SD models in general. These systems have a SDOF in each horizontal direction. The elevation and plan of these systems are shown in Fig. 3. The weight of the equivalent SDOF system is the same as the total weight of its corresponding MDOF system and its lateral stiffness is selected in such a way that its natural period is the same as the fundamental natural period of its corresponding MDOF system. In order to have the equivalence in both horizontal directions, square hollow structural sections were used for columns. They were HSS26×26×1/2 and HSS22×22×1/2 for the 3- and 10-level models, respectively. The damping ratio is selected to be the same for the SAC and the SD models. The yielding strength for the SD model was determined from a pushover analysis; the corresponding pushover curve is also given in Fig. 2. It must be noted that in a strict sense, the SD models are not the typical SDOF systems studied in the structural dynamics textbooks since axial forces can be developed in the columns under the action of horizontal excitations.
4.3. Earthquake loading
The responses of a structure excited by different earthquake time histories, even when they are normalized with respect to the same response parameter, are expected to be different reflecting their different frequency content. To study the responses of the models comprehensively and to make meaningful conclusions, they are excited by twenty recorded earthquake motions in time domain with different frequency contents. Starting from the basic records, the earthquakes are scaled up in such a way that the models develop a maximum inter-story displacement of 1 %, 2 %, 3 %, 4 % and 5 % for the 3-level model and of 1 %, 2 % and 3 % for the 10-level model. The characteristics of these earthquake time histories are given in Table 2. As shown in the table, the predominant periods of the earthquakes vary from 0.11 to 0.62 sec, which reflects a different frequency contents. The predominant period for each earthquake is defined as the period where the largest peak in the elastic response spectrum occurs, in terms of pseudo accelerations. The earthquake time histories were obtained from the Data Sets of the National Strong Motion Program (NSMP) of the United States Geological Surveys (USGS). Additional information on these earthquakes can be obtained from this data base.
Table 2Earthquake records, N-S component
No | PLACE | DATE | STATION | T (sec) | ED (km) | M | PGA (cm/sec2) |
1 | Landers, California | 28/06/1992 | Fun Valley, Reservoir 361 | 0.11 | 31 | 7.3 | 213 |
2 | Mammoth Lakes, California | 27/05/1980 | Convict Creek | 0.16 | 11.9 | 6.3 | 316 |
3 | Victoria | 09/06/1980 | Cerro Prieto | 0.16 | 37 | 6.1 | 613 |
4 | Parkfield, California | 28/09/2004 | Parkfield; JoaquinCanyon | 0.17 | 14.8 | 6.0 | 609 |
5 | PugetSound, Washington | 29/04/1965 | Olympia Hwy Test Lab | 0.17 | 89 | 6.5 | 216 |
6 | Long Beach, California | 10/03/1933 | UtilitiesBldg, Long Beach | 0.20 | 29 | 6.3 | 219 |
7 | Sierra El Mayor, Mexico | 04/04/2010 | El centro, California | 0.21 | 77.3 | 7.2 | 544 |
8 | Petrolia/Cape Mendocino, California | 25/04/1992 | Centerville Beach, Naval Facility | 0.21 | 22 | 7.2 | 471 |
9 | Morgan Hill | 24/04/1984 | GilroyArraySta #4 | 0.22 | 38 | 6.2 | 395 |
10 | Western Washington | 13/04/1949 | Olympia Hwy Test Lab | 0.22 | 39 | 7.1 | 295 |
11 | San Fernando | 09/02/1971 | Castaic - Old Ridge Route | 0.23 | 24 | 6.6 | 328 |
12 | Mammoth Lakes, California | 25/05/1980 | Long Valley Dam | 0.24 | 12.7 | 6.5 | 418 |
13 | El Centro | 18/05/1940 | El Centro – ImpVall Irr Dist | 0.27 | 12 | 7.0 | 350 |
14 | Loma Prieta, California | 18/10/1989 | Palo Alto | 0.29 | 47 | 6.9 | 378 |
15 | Santa Barbara, California | 13/08/1978 | UCSB Goleta FF | 0.36 | 14 | 5.1 | 361 |
16 | Coalinga, California | 02/05/1983 | Parkfield Fault Zone 14 | 0.39 | 38 | 6.2 | 269 |
17 | Imperial Valley, California | 15/10/1979 | Chihuahua | 0.40 | 19 | 6.5 | 262 |
18 | Northridge, California | 17/01/1994 | Canoga Park, Santa Susana | 0.60 | 15.8 | 6.7 | 602 |
19 | Offshore Northern, California | 10/01/2010 | Ferndale, California | 0.61 | 42.9 | 6.5 | 431 |
20 | Joshua Tree, California | 23/04/1992 | Indio, Jackson Road | 0.62 | 25.6 | 6.1 | 400 |
5. Objective 1: ductility demands
5.1. Ductility definitions
The seismic responses in terms of ductility demands for the structural representations above mentioned are calculated and discussed. A definition of this parameter is needed here for this purpose. In the context of seismic analysis of SDOF systems, ductility can be conceptually defined as the ratio of the maximum inelastic displacement (Dmax) to the yield displacement (Dy). Dmax is calculated as the maximum displacement that the system undergoes during the application of the complete seismic loading and Dy as the displacement of the system when it yields for the first time. For MDOF systems, since there are many alternative to define Dmax and Dy, there is no unanimity in the profession on how to calculate them. Global ductility for MDOF systems, typically is expressed as the ratio of the maximum absolute lateral displacement of the roof after the complete application of the loading to the absolute lateral displacements of the roof when yielding occurs by the first time.
Table 3Statistics for story ductility demands (μS)
Model (1) | Drift (%) (2) | Level (3) | μS,SAC | μS,EQ | μS,2D | μS,SD | |||||||||||||
N-S | E-W | N-S | E-W | N-S | E-W | N-S | E-W | ||||||||||||
MV (4) | COV (5) | MV (6) | COV (7) | MV (8) | COV (9) | MV (10) | COV (11) | MV (12) | COV (13) | MV (14) | COV (15) | MV (16) | COV (17) | MV (18) | COV (19) | ||||
Level 3 | 1 | 1 | 1.00 | 0 | 1.00 | 0 | 1.00 | 0 | 1.00 | 0 | 1.17 | 14 | 1.21 | 15 | 1.87 | 32 | 1.85 | 27 | |
2 | 1.00 | 0 | 1.00 | 0 | 1.05 | 10 | 1.08 | 8 | 1.21 | 17 | 1.20 | 14 | |||||||
3 | 1.00 | 0 | 1.00 | 0 | 1.24 | 19 | 1.29 | 19 | 1.32 | 25 | 1.28 | 20 | |||||||
2 | 1 | 1.18 | 16 | 1.25 | 20 | 1.32 | 24 | 1.36 | 24 | 1.92 | 29 | 2.09 | 22 | 3.82 | 38 | 3.53 | 43 | ||
2 | 1.17 | 18 | 1.10 | 14 | 1.76 | 28 | 1.72 | 26 | 1.96 | 29 | 1.95 | 21 | |||||||
3 | 1.26 | 27 | 1.21 | 27 | 2.27 | 30 | 2.24 | 28 | 2.20 | 34 | 2.20 | 28 | |||||||
3 | 1 | 1.41 | 15 | 1.58 | 27 | 1.86 | 33 | 1.83 | 41 | 2.42 | 29 | 2.64 | 26 | 5.17 | 43 | 4.89 | 42 | ||
2 | 1.37 | 21 | 1.39 | 24 | 2.43 | 30 | 2.27 | 36 | 2.35 | 30 | 2.42 | 26 | |||||||
3 | 1.58 | 32 | 1.64 | 34 | 3.06 | 29 | 2.93 | 34 | 2.68 | 30 | 2.69 | 34 | |||||||
4 | 1 | 1.80 | 24 | 1.94 | 37 | 2.23 | 37 | 2.12 | 46 | 2.88 | 32 | 3.02 | 30 | 6.22 | 47 | 5.59 | 48 | ||
2 | 1.67 | 25 | 1.58 | 37 | 2.83 | 36 | 2.59 | 39 | 2.72 | 35 | 2.72 | 29 | |||||||
3 | 2.00 | 31 | 1.97 | 40 | 3.65 | 36 | 3.38 | 33 | 2.92 | 33 | 3.09 | 34 | |||||||
5 | 1 | 1.85 | 38 | 2.23 | 42 | 2.43 | 42 | 2.48 | 50 | 3.13 | 34 | 3.22 | 31 | 6.73 | 58 | 5.99 | 50 | ||
2 | 2.32 | 42 | 1.94 | 39 | 3.09 | 41 | 2.97 | 46 | 2.89 | 35 | 2.88 | 31 | |||||||
3 | 1.99 | 42 | 1.96 | 38 | 3.89 | 41 | 3.87 | 39 | 3.12 | 34 | 3.24 | 39 | |||||||
Level 10 | 1 | 1 | 1.00 | 0 | 1.00 | 0 | 1.00 | 0 | 1.00 | 0 | 1.00 | 0 | 1.00 | 0 | 1.70 | 28 | 1.86 | 43 | |
2 | 1.00 | 0 | 1.00 | 0 | 1.00 | 0 | 1.00 | 0 | 1.06 | 10 | 1.05 | 10 | |||||||
3 | 1.00 | 0 | 1.00 | 0 | 1.00 | 0 | 1.00 | 0 | 1.02 | 5 | 1.01 | 6 | |||||||
4 | 1.01 | 5 | 1.01 | 4 | 1.00 | 0 | 1.00 | 0 | 1.01 | 4 | 1.01 | 4 | |||||||
5 | 1.02 | 7 | 1.02 | 7 | 1.00 | 0 | 1.00 | 0 | 1.02 | 6 | 1.00 | 0 | |||||||
6 | 1.00 | 0 | 1.00 | 0 | 1.00 | 0 | 1.00 | 0 | 1.02 | 5 | 1.01 | 3 | |||||||
7 | 1.07 | 15 | 1.07 | 14 | 1.08 | 16 | 1.08 | 16 | 1.00 | 0 | 1.00 | 1 | |||||||
8 | 1.27 | 27 | 1.26 | 27 | 1.31 | 26 | 1.31 | 26 | 1.02 | 5 | 1.05 | 11 | |||||||
9 | 1.39 | 30 | 1.36 | 29 | 1.68 | 36 | 1.66 | 36 | 1.05 | 9 | 1.20 | 24 | |||||||
2 | 1 | 1.11 | 15 | 1.11 | 16 | 1.08 | 16 | 1.09 | 17 | 1.27 | 30 | 1.55 | 26 | 3.75 | 47 | 3.68 | 55 | ||
2 | 1.11 | 17 | 1.08 | 14 | 1.06 | 12 | 1.04 | 10 | 1.64 | 27 | 1.73 | 29 | |||||||
3 | 1.16 | 22 | 1.16 | 22 | 1.07 | 14 | 1.07 | 14 | 1.40 | 29 | 1.52 | 27 | |||||||
4 | 1.32 | 34 | 1.30 | 34 | 1.15 | 23 | 1.15 | 23 | 1.34 | 31 | 1.49 | 28 | |||||||
5 | 1.41 | 35 | 1.39 | 35 | 1.17 | 24 | 1.18 | 25 | 1.37 | 33 | 1.40 | 30 | |||||||
6 | 1.20 | 25 | 1.19 | 23 | 1.13 | 20 | 1.12 | 19 | 1.35 | 31 | 1.26 | 27 | |||||||
7 | 1.48 | 37 | 1.47 | 37 | 1.44 | 34 | 1.45 | 35 | 1.15 | 22 | 1.13 | 25 | |||||||
8 | 2.15 | 37 | 2.09 | 37 | 2.19 | 32 | 2.20 | 31 | 1.29 | 32 | 1.31 | 41 | |||||||
9 | 2.42 | 40 | 2.31 | 41 | 2.95 | 39 | 2.92 | 39 | 1.49 | 33 | 1.89 | 48 | |||||||
3 | 1 | 1.35 | 35 | 1.36 | 35 | 1.33 | 36 | 1.35 | 37 | 2.06 | 43 | 2.75 | 45 | 5.45 | 49 | 5.22 | 54 | ||
2 | 1.39 | 39 | 1.35 | 38 | 1.34 | 41 | 1.31 | 40 | 2.71 | 73 | 3.10 | 91 | |||||||
3 | 1.47 | 38 | 1.45 | 38 | 1.34 | 42 | 1.35 | 42 | 2.21 | 59 | 2.47 | 77 | |||||||
4 | 1.79 | 41 | 1.75 | 40 | 1.38 | 42 | 1.37 | 41 | 2.15 | 61 | 2.25 | 66 | |||||||
5 | 1.84 | 43 | 1.79 | 42 | 1.31 | 33 | 1.32 | 33 | 2.08 | 59 | 1.95 | 59 | |||||||
6 | 1.50 | 37 | 1.46 | 38 | 1.16 | 21 | 1.15 | 20 | 2.14 | 62 | 1.76 | 67 | |||||||
7 | 2.06 | 46 | 2.04 | 46 | 1.55 | 35 | 1.58 | 33 | 1.72 | 63 | 1.74 | 71 | |||||||
8 | 3.47 | 45 | 3.43 | 44 | 2.33 | 48 | 2.29 | 49 | 1.96 | 77 | 2.33 | 93 | |||||||
9 | 4.02 | 42 | 3.83 | 42 | 3.38 | 50 | 3.25 | 50 | 2.40 | 71 | 2.80 | 84 | |||||||
For nonlinear static analysis, this definition works well but for seismic time history analysis it may give unreasonable large values [50, 23]. Since global ductility should represent the overall structural inelastic deformation, it is more appropriate to define it in terms of relative lateral displacements [7, 45, 51]. In this study, global ductility (μG) is defined as the average of the story ductility values (μS), which in turn is defined, similarly to the case of SDOF, as:
where, for a given story, Dmax is the maximum inelastic inter-story lateral displacement (drift) after the application of the complete time history of an earthquake, and Dy is the interstory displacement when yielding occurs in the inter-story for the first time. The latter is calculated by using nonlinear static analysis (pushover).
Fig. 3Elevation and plan of the equivalent SD models
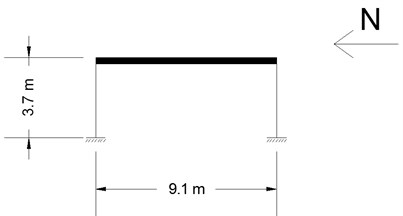
a) Elevation
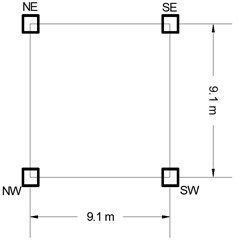
b) Plan
5.2. Results for story ductility (μS)
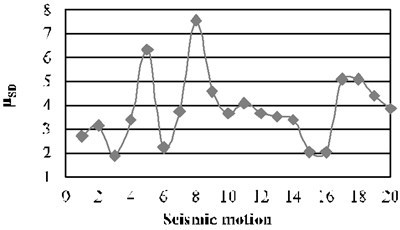
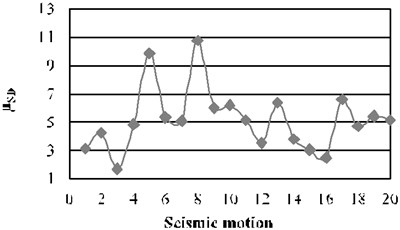
For a given direction and story, the story ductility demands, as defined by Eq. (2), are estimated. For the case of the 3D models (SAC and EQ models), the ductility values are obtained for all the plane frames oriented in the direction under consideration and then the resulting values are averaged over all the frames. Additional subscripts are added to the µS symbol to differentiate the results from one structural representation to another. Thus, μS,SAC, μS,EQ, μS,2D, and μS,SD are used to represent the story ductility demands for the SAC, EQ, 2D and SD models, respectively. The μS,SACvalues for the N-S direction of the 3-level building and drifts of 2 % and 3 % are presented in Figs. 4(a) and 4(b), respectively. The corresponding values of μS,EQ, μS,2Dand μS,SDare given in Figs. 4(c) and 4(d), Figs. 4(e) and 4(f), and Fig. 4(g) and 4(h), respectively. Similar results were also developed for the 10-level buildings, but are not shown. A value equal to unity in the plots means that the maximum inter-story displacement was not beyond of the yielding displacement of the story under consideration. It can be observed that, for a given building, level of deformation and story, the values of μS,SAC, μS,EQ, μS,2Dand μS,SDsignificantly vary from one seismic motion to another without showing any trend, even though the level of deformation was approximately the same for each of the seismic motions. It reflects the contribution of the frequency content of the seismic motions on the structural responses. It is also observed that for the 3-level building, for a given level of deformation and story, the values of story ductility tend to increase with the story level for most of the cases. This tendency is not clearly observed for the 10-level building reflecting the influence of the structural complexity on the story ductility demands. The maximum values, however, occur for the last two stories in the case of the SAC and EQ models, indicating, as for the 3-level building, a significant contribution of the higher modes in the response.
Results as those of Fig. 4 were also developed for the E-W direction and for other levels of structural deformation, but are not shown. Only the results in terms of the fundamental statistics (mean value MV and coefficient of variation COV) are presented and discussed (Table 3). The results of the table corroborate what observed from individual plots in the sense that the story ductility values for the four structural representations are, in general, larger for the upper stories. For both of the models, the values increase with the level of deformations. It is also shown that, for a given building and structural system, the MV and COV parameters are quite similar for both horizontal directions. The uncertainty in the estimation tend to increase with the level of deformation and it can be quite significant, it reaches values larger than 70 in some cases.
Fig. 4Story ductility values for the 3-level building, N-S direction
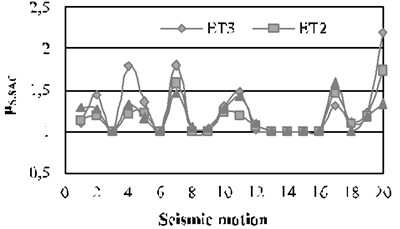
a) SAC, 2 %
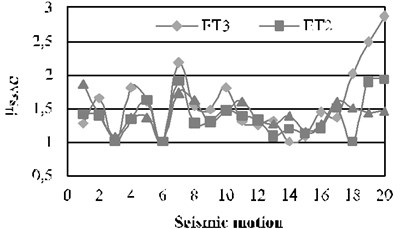
b) SAC, 3 %
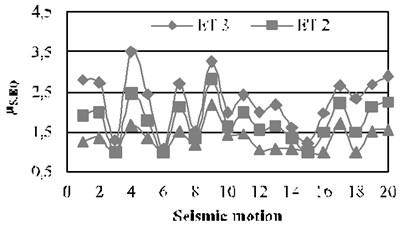
c) EQ, 2 %
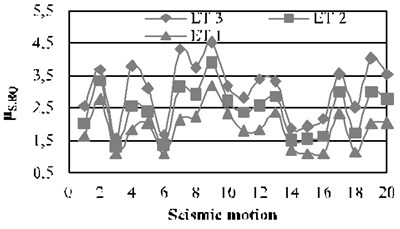
d) EQ, 3 %
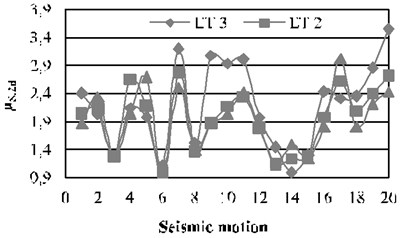
e) 2D, 2 %
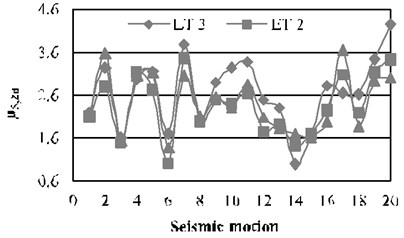
f) 2D, 3 %
g) SD, 2 %
h) SD, 3 %
For the case of the MDOF representations of the 3-level building, the maximum ductility demand mean values for Story 3 occurs for the EQ model (3.89) which in turn are slightly larger than those of the 2D model, followed by those of the SAC models. However, for Stories 1 and 2 the largest values occur, in general, for the 2D models (3.13), followed by those of the EQ and SAC models. For the 10-level building, smaller values of deformations (1 % and 2 %) and Stories 1 through 6, the largest values occur for the 2D models (1.73), but for the upper stories (7 to 9) the maximum values are for the EQ model (2.95). For the deformation of 3 % and the first six stories, the maximum values are for the 2D structural representation (3.10) followed by those of the SAC and the EQ models while for the upper stories the maximum values are for the SAC models (4.02) followed by those of the EQ and 2D models. From the results of the SD models, it is clearly observed that the mean values are, in all cases, much larger than those of the MDOF representations. Values greater than six are observed in many cases. The implication of this is that, as stated earlier, the structural complexity significantly influences the story ductility demands.
5.3. Global ductility (μG)
It is assumed in this research that the maximum deformation capacity for the SAC buildings is given for the drifts of 5 % and 3 %, for the 3- and 10-level buildings, respectively. Thus, the global ductility capacity (μG) is associated to these levels of deformations. The values of μG, as defined earlier in Section 5.1, are calculated for the four structural representations and for the corresponding above mentioned levels of deformations; the results are presented in Table 4. The results are similar to those of μS in the sense that for a given building and structural system, the MV and COV parameters are quite similar for both horizontal directions.
The uncertainty in the estimation of μG can be considerable, reaching values larger than 60 in some cases (2D models). For the 3-level building, the mean values of μG are slightly larger for the EQ model than for the 2D model, which in turn can be considerable larger than those of the SAC model, while for the 10-level model, the values are larger for the 2D model followed by those of the SAC and EQ models.
Table 4Statistics for global ductility values (μG)
Earth | μG,SAC | μG,EQ | μG,2D | μG,SD | ||||||||||||
3-level | 10-level | 3-level | 10-level | 3-level | 10-level | 3-level | 10-level | |||||||||
N-S | E-W | N-S | E-W | N-S | E-W | N-S | E-W | N-S | E-W | N-S | E-W | N-S | E-W | N-S | E-W | |
1 | 2.11 | 3.31 | 1.69 | 1.64 | 2.27 | 2.02 | 1.53 | 1.53 | 2.24 | 2.61 | 1.00 | 1.00 | 3.53 | 3.23 | 4.88 | 3.77 |
2 | 1.84 | 1.62 | 2.40 | 2.33 | 2.48 | 2.23 | 1.85 | 1.82 | 3.99 | 2.41 | 1.24 | 1.76 | 4.68 | 6.26 | 2.46 | 3.76 |
3 | 1.42 | 1.62 | 1.55 | 1.53 | 1.22 | 3.93 | 1.27 | 1.29 | 1.59 | 3.13 | 4.75 | 7.20 | 1.80 | 4.98 | 10.93 | 9.53 |
4 | 3.67 | 3.00 | 2.15 | 2.08 | 2.78 | 3.05 | 1.62 | 1.61 | 3.96 | 3.29 | 1.17 | 1.22 | 5.89 | 8.92 | 5.84 | 2.43 |
5 | 2.76 | 2.00 | 2.50 | 2.42 | 3.77 | 2.86 | 1.74 | 1.73 | 3.72 | 2.94 | 1.78 | 1.20 | 12.91 | 3.86 | 5.58 | 3.05 |
6 | 1.27 | 1.26 | 1.94 | 1.86 | 1.61 | 3.95 | 1.72 | 1.70 | 1.61 | 2.94 | 4.39 | 5.54 | 6.77 | 4.27 | 7.19 | 10.92 |
7 | 1.28 | 1.60 | 2.06 | 2.01 | 4.29 | 2.32 | 1.47 | 1.44 | 4.09 | 2.12 | 2.52 | 2.02 | 7.24 | 2.94 | 7.23 | 9.18 |
8 | 1.21 | 2.47 | 2.24 | 2.27 | 7.12 | 7.30 | 1.98 | 1.97 | 2.80 | 5.19 | 2.99 | 4.63 | 19.65 | 15.19 | 5.22 | 4.07 |
9 | 1.38 | 1.32 | 1.93 | 1.91 | 3.74 | 2.97 | 1.78 | 1.77 | 3.43 | 2.99 | 1.00 | 1.14 | 6.19 | 3.38 | 5.54 | 3.99 |
10 | 2.95 | 2.26 | 2.86 | 2.85 | 2.68 | 3.44 | 2.18 | 2.07 | 3.21 | 3.12 | 4.45 | 2.73 | 8.02 | 8.09 | 4.97 | 4.10 |
11 | 2.21 | 1.77 | 1.96 | 1.88 | 3.86 | 2.33 | 1.75 | 1.74 | 3.74 | 2.33 | 1.62 | 1.11 | 8.95 | 5.06 | 7.85 | 4.52 |
12 | 2.25 | 2.79 | 1.37 | 1.33 | 2.78 | 3.07 | 1.04 | 1.04 | 2.27 | 3.84 | 1.15 | 1.98 | 3.20 | 7.70 | 4.44 | 9.12 |
13 | 1.66 | 2.01 | 3.12 | 3.08 | 4.30 | 3.64 | 2.61 | 2.61 | 2.46 | 3.28 | 5.38 | 3.60 | 6.79 | 7.78 | 11.97 | 7.91 |
14 | 1.60 | 1.06 | 2.73 | 2.63 | 1.98 | 3.33 | 1.61 | 1.57 | 1.96 | 3.60 | 2.40 | 2.22 | 5.70 | 5.51 | 4.61 | 7.12 |
15 | 1.62 | 3.48 | 1.10 | 1.08 | 2.61 | 5.21 | 1.09 | 1.08 | 2.20 | 4.98 | 1.49 | 3.25 | 4.73 | 9.54 | 2.55 | 3.73 |
16 | 1.00 | 1.02 | 2.15 | 2.05 | 1.80 | 2.92 | 1.91 | 1.89 | 2.68 | 3.60 | 1.43 | 2.58 | 2.53 | 6.59 | 2.47 | 4.80 |
17 | 3.00 | 2.41 | 3.25 | 3.18 | 3.09 | 2.23 | 1.63 | 1.62 | 3.27 | 2.45 | 1.54 | 1.61 | 6.89 | 5.71 | 6.81 | 5.91 |
18 | 2.04 | 2.92 | 1.40 | 1.39 | 2.94 | 2.37 | 1.22 | 1.21 | 2.56 | 3.51 | 1.63 | 1.67 | 4.26 | 5.49 | 3.60 | 4.13 |
19 | 3.36 | 1.20 | 1.93 | 1.87 | 3.78 | 1.89 | 2.16 | 2.14 | 4.12 | 2.84 | 2.40 | 1.29 | 7.13 | 2.70 | 2.36 | 1.16 |
20 | 3.18 | 1.03 | 1.65 | 1.63 | 3.62 | 1.04 | 1.44 | 1.44 | 5.08 | 1.32 | 1.45 | 1.00 | 7.86 | 2.56 | 2.49 | 1.25 |
MV | 2.09 | 2.01 | 2.10 | 2.05 | 3.14 | 3.11 | 1.68 | 1.66 | 3.05 | 3.11 | 2.29 | 2.44 | 6.73 | 5.99 | 5.45 | 5.22 |
COV | 39 | 039 | 28 | 28 | 41 | 43 | 23 | 23 | 31 | 30 | 60 | 69 | 58 | 50 | 49 | 54 |
The implication of this is that, as stated earlier, the structural complexity significantly influences the ductility demands. From the results of the SD models, it can be observed that the mean values of μG can much larger than those of the 3D (SAC and EQ) and 2D models, implying that modeling the buildings as SDOF systems may be a very crude approximation.
6. Objective 2: ductility reduction factor (Rμ)
The Rμ factor is mathematically expressed as:
where Re is the maximum value of the response parameter (global or local) under consideration obtained from an elastic analysis (without considering dissipation of energy) and Ri is the maximum value of the same parameter obtained from an inelastic analysis (considering dissipation of energy by yielding). In the case of global response parameters, Reand Riwill represent the elastic and inelastic inter-story shear, respectively, while for local response parameters they will represent the elastic and inelastic axial load or bending moment. Additional subscripts are added to Rμto differentiate global from local response parameters or from one structural representation to another. The ductility reduction factors associated to inter-story shears (global parameter) will be denoted as RμS,SAC, RμS,EQ, RμS,2D and RμS,SD, for the SAC, EQ, 2D and SDOF models, respectively. The corresponding notation for axial loads or bending moments will be RμL,SAC, RμL,EQ, RμL,2D and RμL,SD.
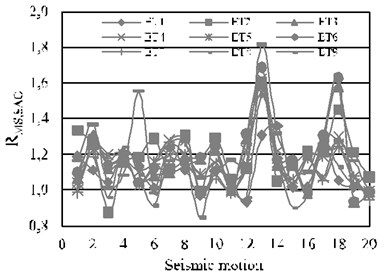
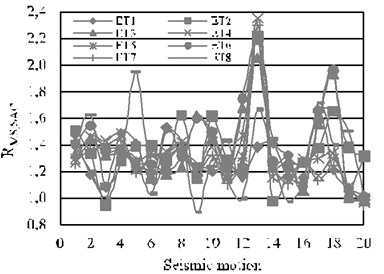
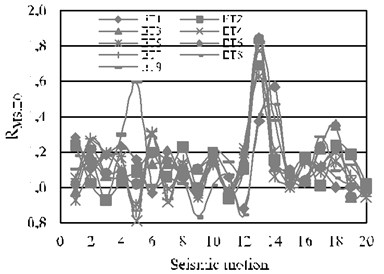
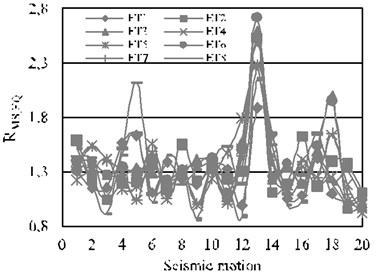
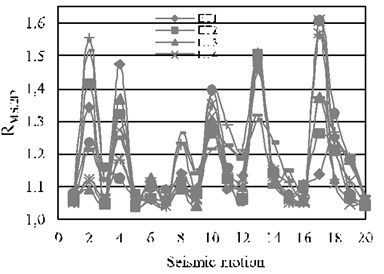
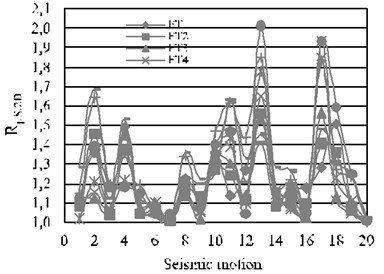
The values of RμS,SAC, are presented in Figs. 5(a) and 5(b) for drifts of 2 % and 3 %, respectively, for the 10-level buildings and the N-S direction. The corresponding values of RμS,EQ, RμS,2Dand RμS,SDare given in Figs. 5(c) and 5(d), 5(e) and 5(f), and 5(g) and 5(h), respectively. Plots for the 3-level building were also developed but are not shown. As for the case of the μS parameter, it can be observed from the results that, for a given level of deformation, building and story, the values of the ductility reduction factors significantly vary from one seismic motion to another even though the level of deformation was approximately the same for each of the seismic motions, reflecting the contribution of the frequency content of the strong motions on the structural responses. Unlike the case of μS, the values of the Rμ parameter don’t necessarily increase with the number of story or occur for the higher levels. However, as for the case of the μS parameter, they tend to increase with the level of deformation.
Plots similar to those of Figs. 5 were also developed for other levels of structural deformations as well as for the E-W direction, but are not shown. However, only the results in terms of the fundamental statistics are presented and discussed (Table 5). The results corroborate what observed from individual plots in the sense that the Rμ mean values increase with the level of deformations. As for the case of ductility demands, the MV and COV parameters are quite similar for both horizontal directions. However, the uncertainty in the estimation is smaller for the Rμ parameter. For the 3-level building the mean values of RμS,EQ(maximum value is 2.02) are, in general, larger than those of RμS,SAC which in turn are larger than those of RμS,2D, while for the 10-level buildings, the mean values of RμS,SAC, RμS,EQare quite similar and smaller than those of RμS,2D (maximum value is 2.35). For both models, the mean values and the uncertainty in the estimation are significantly larger for the equivalent SD models, mean values close to 4 are observed in some cases. One of the reasons for this is that, although there is equivalence between the SD and MDOF models in terms of mass strength and stiffness, the dissipated energy and the number if incursions in the inelastic range are significantly larger for the SD model. In addition, when yielding occurs in the SD models, plastic hinges are simultaneously developed at both ends of all structural elements (eight columns) implying a totally plasticized structure, whereas for the SAC and EQ models (which have hundreds of beam and columns), even if significant yielding occurs, plastic hinges are developed only in a relatively small number of structural members. Thus, the dissipated energy is overestimated in SD systems implying that using the force reduction factors based on these simplified systems may be too conservative.
Fig. 5Story ductility reduction factors for the 10-level building, N-S direction
a) SAC, 2 %
b) SAC, 3 %
c) EQ, 2 %
d) EQ, 3 %
e) 2D, 2 %
f) 2D, 3 %
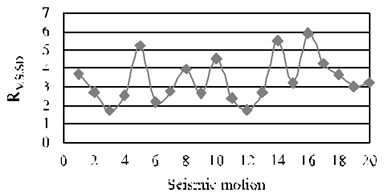
g) SD 2 %
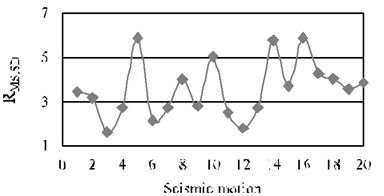
h) SD 3 %
Table 5Statistics for story ductility reduction factors (RμS)
Model (1) | Drift (2) | Level (3) | RμS,SAC | RμS,EQ | RμS,2D | RμS,SD | ||||||||||||
N-S | E-W | N-S | E-W | N-S | E-W | N-S | E-W | |||||||||||
MV (4) | COV (5) | MV (6) | COV (7) | MV (8) | COV (9) | MOV (10) | COV (11) | MV (12) | COV (13) | MV (14) | COV (15) | MV (16) | COV (17) | MV (18) | COV (19) | |||
Level 3 | 1 | 1 | 1.00 | 4 | 1.00 | 6 | 1.20 | 15 | 1.17 | 13 | 0.97 | 4 | 1.02 | 3 | 2.15 | 25 | 2.17 | 27 |
2 | 1.00 | 4 | 1.00 | 7 | 1.19 | 10 | 1.19 | 16 | 0.98 | 3 | 1.02 | 3 | ||||||
3 | 1.01 | 5 | 1.01 | 5 | 1.15 | 10 | 1.15 | 13 | 0.97 | 4 | 1.01 | 2 | ||||||
2 | 1 | 1.35 | 16 | 1.22 | 18 | 1.44 | 25 | 1.52 | 22 | 1.20 | 13 | 1.25 | 15 | 3.12 | 32 | 3.42 | 29 | |
2 | 1.33 | 16 | 1.25 | 19 | 1.66 | 17 | 1.59 | 24 | 1.26 | 15 | 1.28 | 12 | ||||||
3 | 1.27 | 13 | 1.17 | 13 | 1.48 | 18 | 1.36 | 17 | 1.26 | 15 | 1.27 | 12 | ||||||
3 | 1 | 1.51 | 20 | 1.41 | 22 | 1.66 | 29 | 1.71 | 23 | 1.33 | 18 | 1.35 | 16 | 3.34 | 36 | 3.68 | 33 | |
2 | 1.55 | 19 | 1.43 | 22 | 1.85 | 19 | 1.77 | 21 | 1.39 | 17 | 1.43 | 15 | ||||||
3 | 1.41 | 16 | 1.33 | 19 | 1.64 | 22 | 1.48 | 18 | 1.38 | 17 | 1.43 | 15 | ||||||
4 | 1 | 1.68 | 22 | 1.51 | 23 | 1.70 | 25 | 1.82 | 25 | 1.43 | 20 | 1.43 | 17 | 3.45 | 39 | 3.82 | 33 | |
2 | 1.70 | 18 | 1.55 | 22 | 1.99 | 21 | 1.88 | 24 | 1.43 | 19 | 1.43 | 15 | ||||||
3 | 1.53 | 18 | 1.41 | 20 | 1.74 | 20 | 1.51 | 20 | 1.43 | 17 | 1.43 | 15 | ||||||
5 | 1 | 1.77 | 24 | 1.60 | 25 | 1.77 | 25 | 1.88 | 25 | 1.48 | 22 | 1.46 | 18 | 3.49 | 41 | 3.88 | 35 | |
2 | 1.82 | 23 | 1.67 | 23 | 2.02 | 21 | 1.94 | 24 | 1.54 | 20 | 1.56 | 17 | ||||||
3 | 1.60 | 21 | 1.49 | 21 | 1.78 | 20 | 1.55 | 21 | 1.50 | 17 | 1.57 | 17 | ||||||
Level 10 | 1 | 1 | 0.98 | 5 | 0.98 | 5 | 1.00 | 10 | 0.99 | 8 | 1.05 | 7 | 1.06 | 6 | 2.82 | 30 | 2.98 | 34 |
2 | 1.01 | 7 | 1.01 | 5 | 0.97 | 8 | 0.97 | 8 | 1.04 | 6 | 1.05 | 6 | ||||||
3 | 0.99 | 6 | 0.98 | 6 | 1.00 | 7 | 0.99 | 6 | 1.03 | 6 | 1.03 | 4 | ||||||
4 | 0.99 | 4 | 0.98 | 5 | 0.97 | 9 | 0.96 | 8 | 1.03 | 6 | 1.03 | 4 | ||||||
5 | 1.00 | 5 | 0.98 | 7 | 0.99 | 8 | 0.95 | 8 | 1.03 | 5 | 1.02 | 4 | ||||||
6 | 0.99 | 6 | 0.98 | 6 | 1.00 | 6 | 0.99 | 6 | 1.03 | 5 | 1.04 | 4 | ||||||
7 | 0.98 | 4 | 0.99 | 5 | 0.97 | 7 | 0.96 | 9 | 1.04 | 5 | 1.05 | 5 | ||||||
8 | 0.97 | 8 | 1.00 | 6 | 0.96 | 9 | 0.99 | 9 | 1.05 | 7 | 1.08 | 7 | ||||||
9 | 1.02 | 7 | 1.01 | 6 | 1.01 | 7 | 1.00 | 6 | 1.05 | 7 | 1.08 | 8 | ||||||
2 | 1 | 1.11 | 11 | 1.09 | 10 | 1.12 | 15 | 1.08 | 10 | 1.52 | 24 | 1.50 | 20 | 3.38 | 36 | 3.52 | 35 | |
2 | 1.20 | 14 | 1.19 | 16 | 1.13 | 15 | 1.12 | 16 | 1.44 | 25 | 1.53 | 23 | ||||||
3 | 1.17 | 15 | 1.15 | 14 | 1.14 | 17 | 1.13 | 17 | 1.43 | 28 | 1.52 | 26 | ||||||
4 | 1.15 | 13 | 1.15 | 14 | 1.13 | 18 | 1.11 | 18 | 1.41 | 28 | 1.44 | 24 | ||||||
5 | 1.16 | 10 | 1.13 | 16 | 1.10 | 15 | 1.06 | 15 | 1.42 | 28 | 1.48 | 24 | ||||||
6 | 1.19 | 16 | 1.16 | 14 | 1.14 | 17 | 1.13 | 17 | 1.51 | 28 | 1.53 | 22 | ||||||
7 | 1.14 | 13 | 1.13 | 13 | 1.13 | 18 | 1.10 | 18 | 1.62 | 23 | 1.68 | 24 | ||||||
8 | 1.10 | 15 | 1.12 | 12 | 1.09 | 15 | 1.09 | 12 | 1.64 | 20 | 1.77 | 20 | ||||||
9 | 1.20 | 17 | 1.14 | 14 | 1.18 | 18 | 1.09 | 9 | 1.62 | 20 | 1.66 | 18 | ||||||
3 | 1 | 1.27 | 14 | 1.26 | 13 | 1.28 | 19 | 1.26 | 15 | 1.91 | 27 | 1.90 | 24 | 3.59 | 36 | 3.72 | 35 | |
2 | 1.37 | 20 | 1.36 | 20 | 1.35 | 24 | 1.28 | 22 | 1.87 | 27 | 1.95 | 27 | ||||||
3 | 1.37 | 21 | 1.31 | 16 | 1.38 | 26 | 1.33 | 29 | 1.85 | 28 | 1.92 | 30 | ||||||
4 | 1.32 | 21 | 1.31 | 21 | 1.35 | 26 | 1.23 | 28 | 1.81 | 29 | 1.83 | 27 | ||||||
5 | 1.32 | 19 | 1.27 | 20 | 1.31 | 23 | 1.18 | 28 | 1.84 | 31 | 1.88 | 26 | ||||||
6 | 1.41 | 21 | 1.32 | 17 | 1.40 | 27 | 1.33 | 30 | 1.95 | 34 | 1.98 | 25 | ||||||
7 | 1.30 | 21 | 1.30 | 22 | 1.33 | 25 | 1.23 | 29 | 2.10 | 31 | 2.21 | 26 | ||||||
8 | 1.25 | 18 | 1.26 | 18 | 1.26 | 25 | 1.24 | 20 | 2.15 | 26 | 2.35 | 23 | ||||||
9 | 1.42 | 21 | 1.27 | 14 | 1.40 | 23 | 1.27 | 15 | 2.06 | 22 | 2.09 | 22 | ||||||
Local ductility reduction factors are now discussed. Values of RμLfor the four structural representations of the two models, for axial loads at some columns of the base, are calculated and plots similar to those of ductility factors are developed. However, only the results in terms of the fundamental statistics are presented (Table 6). The results are similar to those of global (story) ductility reduction factors, in the sense that they tend to increase with the level of deformation, that their magnitude is quite similar for both horizontal directions and that they are significantly larger for the SD models.
Table 6Statistics for local ductility reduction factors (RμL)
Model (1) | Drift (2) | Location (3) | RμL,SAC | RμL,EQ | RμL,2D | RμL,SD | ||||||||||||
Axial | Moment | Axial | Moment | Axial | Moment | Axial | Moment | |||||||||||
MV (4) | COV (5) | MV (6) | COV (7) | MV (8) | COV (9) | MOV (10) | COV (11) | MV (12) | COV (13) | MV (14) | COV (15) | MV (16) | COV (17) | MV (18) | COV (19) | |||
Level 3 | 1 | EXT-NS OR SW | 1.00 | 4 | 1.00 | 8 | 1.00 | 4 | 1.00 | 8 | 1.02 | 3 | 1.03 | 5 | 1.14 | 15 | 2.21 | 20 |
INT-NS OR SW | 1.00 | 1 | 1.00 | 8 | 1.00 | 1 | 1.00 | 8 | 1.00 | 0 | 1.02 | 5 | 1.14 | 15 | 2.21 | 20 | ||
EXT-EW OR SE | 1.00 | 0 | 1.01 | 5 | 1.00 | 0 | 1.01 | 5 | 1.01 | 2 | 1.01 | 2 | 1.15 | 14 | 2.83 | 19 | ||
INT-EW OR SE | 1.00 | 1 | 1.00 | 4 | 1.00 | 1 | 1.00 | 4 | 1.00 | 0 | 1.01 | 2 | 1.15 | 14 | 2.83 | 19 | ||
2 | EXT-NS OR SW | 1.21 | 17 | 1.20 | 19 | 1.21 | 17 | 1.20 | 19 | 1.13 | 12 | 1.25 | 16 | 1.23 | 27 | 2.89 | 27 | |
INT-NS OR SW | 0.99 | 6 | 1.18 | 22 | 0.99 | 6 | 1.18 | 22 | 1.00 | 1 | 1.27 | 16 | 1.23 | 27 | 2.89 | 27 | ||
EXT-EW OR SE | 1.00 | 0 | 1.04 | 13 | 1.00 | 0 | 1.04 | 13 | 1.10 | 10 | 1.27 | 12 | 1.31 | 34 | 2.83 | 23 | ||
INT-EW OR SE | 1.02 | 7 | 1.31 | 15 | 1.02 | 7 | 1.31 | 15 | 1.01 | 1 | 1.28 | 12 | 1.31 | 34 | 2.83 | 23 | ||
3 | EXT-NS OR SW | 1.38 | 22 | 1.32 | 26 | 1.37 | 22 | 1.36 | 28 | 1.17 | 15 | 1.37 | 18 | 1.29 | 29 | 3.07 | 23 | |
INT-NS OR SW | 0.99 | 6 | 1.26 | 28 | 0.98 | 6 | 1.26 | 28 | 1.00 | 1 | 1.40 | 18 | 1.29 | 29 | 3.07 | 23 | ||
EXT-EW OR SE | 1.00 | 0 | 1.05 | 19 | 1.01 | 4 | 1.07 | 21 | 1.14 | 12 | 1.43 | 16 | 1.32 | 37 | 3.13 | 27 | ||
INT-EW OR SE | 1.00 | 10 | 1.39 | 20 | 1.04 | 21 | 1.40 | 21 | 1.00 | 1 | 1.45 | 17 | 1.32 | 37 | 3.13 | 27 | ||
4 | EXT-NS OR SW | 1.52 | 26 | 1.00 | 1 | 1.48 | 27 | 1.03 | 8 | 1.20 | 16 | 1.47 | 18 | 1.33 | 29 | 3.27 | 24 | |
INT-NS OR SW | 1.36 | 31 | 1.02 | 25 | 1.44 | 36 | 1.01 | 24 | 1.00 | 1 | 1.48 | 18 | 1.33 | 29 | 3.27 | 24 | ||
EXT-EW OR SE | 0.96 | 11 | 0.98 | 13 | 0.97 | 13 | 1.06 | 24 | 1.16 | 14 | 1.50 | 16 | 1.34 | 37 | 3.24 | 22 | ||
INT-EW OR SE | 1.38 | 24 | 1.50 | 22 | 1.40 | 26 | 1.51 | 19 | 1.00 | 2 | 1.54 | 17 | 1.34 | 37 | 3.24 | 22 | ||
5 | EXT-NS OR SW | 1.64 | 27 | 1.00 | 1 | 1.58 | 28 | 1.03 | 8 | 1.22 | 17 | 1.52 | 19 | 1.34 | 29 | 3.34 | 24 | |
INT-NS OR SW | 1.48 | 34 | 0.95 | 35 | 1.53 | 37 | 0.92 | 29 | 1.00 | 1 | 1.53 | 18 | 1.34 | 29 | 3.34 | 24 | ||
EXT-EW OR SE | 0.96 | 14 | 0.98 | 12 | 0.95 | 15 | 1.07 | 26 | 1.17 | 15 | 1.56 | 18 | 1.35 | 37 | 3.42 | 28 | ||
INT-EW OR SE | 1.44 | 32 | 1.53 | 23 | 1.44 | 32 | 1.57 | 24 | 1.01 | 2 | 1.59 | 18 | 1.35 | 37 | 3.42 | 28 | ||
Level 10 | 1 | EXT-NS OR SW | 1.00 | 3 | 0.97 | 7 | 1.00 | 1 | 0.97 | 10 | 1.01 | 3 | 1.06 | 8 | 1.06 | 7 | 2.73 | 25 |
INT-NS OR SW | 1.00 | 0 | 0.97 | 7 | 1.00 | 1 | 0.97 | 9 | 1.00 | 0 | 1.07 | 8 | 1.06 | 7 | 2.73 | 25 | ||
EXT-EW OR SE | 1.00 | 2 | 0.97 | 7 | 1.00 | 1 | 0.95 | 9 | 1.01 | 3 | 1.07 | 7 | 1.00 | 7 | 2.66 | 24 | ||
INT-EW OR SE | 1.00 | 0 | 0.97 | 7 | 1.00 | 1 | 0.95 | 9 | 1.00 | 1 | 1.07 | 8 | 1.00 | 7 | 2.66 | 24 | ||
2 | EXT-NS OR SW | 1.11 | 12 | 1.09 | 10 | 1.03 | 6 | 1.01 | 19 | 1.13 | 16 | 1.52 | 21 | 1.18 | 10 | 3.47 | 32 | |
INT-NS OR SW | 1.00 | 2 | 1.09 | 11 | 1.02 | 3 | 1.05 | 16 | 1.00 | 1 | 1.56 | 24 | 1.17 | 10 | 3.47 | 32 | ||
EXT-EW OR SE | 1.10 | 10 | 1.12 | 14 | 1.02 | 3 | 1.09 | 21 | 1.14 | 21 | 1.53 | 21 | 1.11 | 9 | 3.51 | 31 | ||
INT-EW OR SE | 1.00 | 2 | 1.13 | 14 | 1.02 | 2 | 1.08 | 21 | 1.00 | 24 | 1.60 | 24 | 1.09 | 9 | 3.51 | 31 | ||
3 | EXT-NS OR SW | 1.19 | 17 | 1.23 | 14 | 1.04 | 8 | 1.13 | 21 | 1.20 | 22 | 1.87 | 22 | 1.18 | 13 | 3.85 | 35 | |
INT-NS OR SW | 1.01 | 2 | 1.22 | 14 | 1.04 | 5 | 1.13 | 22 | 1.00 | 1 | 1.92 | 23 | 1.08 | 13 | 3.85 | 35 | ||
EXT-EW OR SE | 1.21 | 15 | 1.28 | 19 | 1.04 | 6 | 1.18 | 22 | 1.86 | 27 | 1.86 | 27 | 1.17 | 9 | 3.70 | 31 | ||
INT-EW OR SE | 1.00 | 2 | 1.29 | 21 | 1.04 | 6 | 1.21 | 25 | 1.95 | 2 | 1.95 | 30 | 1.09 | 9 | 3.70 | 31 | ||
However, the magnitude of the mean values may be significantly smaller for the case of RμL, particularly for axial loads, which, in general, are larger for exterior than for interior columns. In simplified seismic analysis and design procedures, like the static equivalent lateral method, the elastic base shear is first estimated and then, it is reduced somehow by using the force reduction factor (taking into account, among other parameters, for energy dissipation). After that, starting from the reduced base shear, equivalent lateral forces are estimated which are applied through the height of the building, and finally, a static analysis procedure is performed by using the equivalent lateral forces to determine the design seismic forces acting on the structural elements. It is clear that the magnitude of the reduction of the total elastic base shear is implicitly used in the resultant stresses at any particular structural element. This similarity in the reduction of global and local response parameters cannot be justified according to the results presented in this study, since as stated above, the reduction magnitude of axial loads, for example, are significantly smaller than those of base shear or bending moment. The implication of this is that non-conservative design may result, showing the limitations of the above-mentioned simplified analysis procedure.
The differences in the magnitude of local reduction factors between axial load and bending moments are produced by many factors: for the case of symmetric buildings, global response parameters, like inter-story shear, are non-collinear. Thus, the base shear for a given direction won’t be affected by the horizontal component perpendicular to the direction under consideration. However, collinear local response parameters, like axial load on columns, are affected by the action of the three components. The contribution of each component to the axial load on a specific column may be in phase each other during some periods of time, but may be out of phase for some other periods. This situation does not occur for non-collinear parameters. Moreover, the axial load in a given column is also affected by the distance from their location to the center of stiffness of the structure.
7. Objective 3: force (or modification) reduction factor
As stated earlier in Section 5.3, in this investigation, the maximum deformation capacity of the models under consideration is assumed to occur for drifts of 5 % and 3 %, for the 3- and 10-level buildings, respectively. Thus, the maximum ductility reduction factors, the ductility capacity as well as the force (or modification) reduction factors, are associated to these levels of deformations. The force reduction factor (R) for global and local parameters as defined by Eq. (1), is calculated and discussed in this section of the paper.
Table 7Statistics for maximum story ductility reduction factors (RμG)
Earth | RμG,SAC | RμG,EQ | RμG,2D | RμG,SD | ||||||||||||
3-level | 10-level | 3-level | 10-level | 3-level | 10-level | 3-level | 10-level | |||||||||
N-S | E-W | N-S | E-W | N-S | E-W | N-S | E-W | N-S | E-W | N-S | E-W | N-S | E-W | N-S | E-W | |
1 | 1.45 | 1.50 | 1.37 | 1.33 | 1.70 | 1.77 | 1.40 | 1.20 | 1.67 | 1.36 | 1.80 | 2.27 | 4.06 | 3.85 | 3.44 | 3.81 |
2 | 1.30 | 1.74 | 1.40 | 1.36 | 1.68 | 2.07 | 1.34 | 1.29 | 1.62 | 1.35 | 1.82 | 2.25 | 6.17 | 2.13 | 3.17 | 6.20 |
3 | 1.39 | 1.12 | 1.23 | 1.24 | 1.84 | 1.24 | 1.22 | 1.13 | 1.10 | 1.44 | 1.42 | 2.19 | 3.24 | 4.98 | 1.63 | 2.28 |
4 | 1.99 | 1.53 | 1.37 | 1.30 | 1.93 | 1.92 | 1.34 | 1.19 | 1.56 | 1.85 | 1.95 | 1.80 | 3.43 | 2.08 | 2.74 | 5.07 |
5 | 2.59 | 1.85 | 1.36 | 1.26 | 2.09 | 1.95 | 1.39 | 1.71 | 2.00 | 1.77 | 3.02 | 1.98 | 2.37 | 3.92 | 5.89 | 2.98 |
6 | 1.70 | 0.97 | 1.23 | 1.21 | 2.16 | 1.26 | 1.31 | 1.16 | 1.07 | 1.73 | 1.40 | 2.35 | 1.49 | 6.10 | 2.15 | 2.50 |
7 | 1.53 | 2.18 | 1.33 | 1.33 | 1.64 | 2.03 | 1.20 | 1.19 | 1.96 | 1.41 | 2.11 | 1.56 | 3.55 | 4.01 | 2.73 | 2.07 |
8 | 1.79 | 1.18 | 1.38 | 1.39 | 1.76 | 1.22 | 1.31 | 1.27 | 1.22 | 1.48 | 1.84 | 2.25 | 1.31 | 2.48 | 4.02 | 5.37 |
9 | 2.05 | 1.68 | 1.25 | 1.27 | 2.09 | 2.28 | 1.15 | 1.10 | 1.46 | 1.53 | 1.63 | 1.84 | 5.14 | 7.06 | 2.80 | 3.04 |
10 | 1.79 | 1.56 | 1.38 | 1.30 | 1.54 | 1.40 | 1.35 | 1.30 | 1.63 | 1.69 | 2.48 | 2.17 | 2.10 | 3.25 | 5.03 | 5.23 |
11 | 1.85 | 2.16 | 1.21 | 1.22 | 1.78 | 2.09 | 1.22 | 1.30 | 1.89 | 1.74 | 2.31 | 1.76 | 3.58 | 4.33 | 2.52 | 2.53 |
12 | 1.40 | 1.70 | 1.34 | 1.25 | 1.82 | 1.45 | 1.36 | 1.30 | 1.64 | 1.30 | 1.61 | 2.27 | 3.87 | 3.15 | 1.80 | 2.17 |
13 | 2.35 | 1.24 | 2.07 | 1.86 | 2.41 | 1.77 | 2.39 | 2.04 | 1.09 | 2.08 | 2.87 | 3.24 | 2.71 | 4.20 | 2.74 | 4.97 |
14 | 1.71 | 1.15 | 1.25 | 1.31 | 2.09 | 1.51 | 1.40 | 1.35 | 1.16 | 1.61 | 2.09 | 1.99 | 2.06 | 4.29 | 5.77 | 3.10 |
15 | 1.89 | 1.30 | 1.19 | 1.17 | 1.83 | 1.39 | 1.16 | 0.94 | 1.45 | 1.43 | 1.41 | 1.88 | 2.35 | 3.08 | 3.71 | 5.53 |
16 | 1.79 | 1.76 | 1.20 | 1.17 | 2.63 | 2.49 | 1.28 | 1.17 | 1.35 | 1.63 | 1.60 | 1.97 | 6.78 | 5.02 | 5.87 | 4.50 |
17 | 1.51 | 1.84 | 1.46 | 1.41 | 1.64 | 1.75 | 1.37 | 1.31 | 1.67 | 1.33 | 2.52 | 1.92 | 3.40 | 3.03 | 4.29 | 3.48 |
18 | 1.98 | 1.50 | 1.52 | 1.47 | 2.01 | 2.23 | 1.49 | 1.20 | 1.52 | 1.60 | 1.76 | 2.29 | 4.13 | 4.27 | 4.03 | 4.40 |
19 | 1.48 | 1.81 | 1.13 | 1.08 | 1.61 | 2.20 | 1.10 | 1.13 | 1.54 | 1.32 | 1.69 | 1.27 | 4.40 | 4.68 | 3.58 | 2.62 |
20 | 1.03 | 1.97 | 1.06 | 1.05 | 0.90 | 1.75 | 1.01 | 1.03 | 1.55 | 1.00 | 1.59 | 1.00 | 3.59 | 1.67 | 3.86 | 2.59 |
MV | 1.73 | 1.59 | 1.34 | 1.30 | 1.86 | 1.79 | 1.34 | 1.27 | 1.51 | 1.53 | 1.95 | 2.01 | 3.49 | 3.88 | 3.59 | 3.72 |
COV | 21 | 22 | 15 | 13 | 19 | 21 | 20 | 19 | 18 | 16 | 24 | 23 | 41 | 35 | 36 | 35 |
The values of the RΩparameter proposed in other investigations [2, 52] for special moment-resisting steel frames are adopted here. According to these studies, the RΩfactor values are 2.8 and 2.3 for the 3- and 10-level buildings, respectively. These values are assumed to be the same for all the structural representations under consideration and for local and global parameters. To have an equivalent parameter to that of global ductility (μG), for a given direction, earthquake and model, the story ductility reduction factors, for the above-mentioned levels of deformation, are first averaged over all the plane frames and then over all the stories; the final average is denoted as RμG. The results are presented in Table 7. Then, the results are multiplied by the adopted values to obtain the global force reduction factors (RG). In a similar way, the RμLfactors corresponding to the maximum drift values are multiplied for RΩto give the local force reduction factors (RL). The fundamental statistics of RG and RL are summarized in Table 8 and Table 9, respectively.
It is observed that the mean values of RG significantly may vary from one structural system to another and that their mean for the EQ models (range 2.91-5.20) are, in general, larger than those of the SAC (range 2.98-4.84) which in turn are larger than those of the, 2D models (range 2.82-4.82). In general, the values are larger for the 3- than for the 10-level model. The mean values and the uncertainty in the estimation are significantly larger for the equivalent SD models (range 8.25-10.86). The RL mean values resemble those of RG in the sense that they significantly vary from one structural representation to another, being larger for the SD model and larger for the 3-than for the 10-level buildings. In addition, RL are larger for axial loads than for bending moments and, in general, larger for exterior than for interior columns.
Table 8Statistics for global force reduction factors (RG)
Earth | RSAC | REQ | R2D | RSD | ||||||||||||
3-level | 10-level | 3-level | 10-level | 3-level | 10-level | 3-level | 10-level | |||||||||
N-S | E-W | N-S | E-W | N-S | E-W | N-S | E-W | N-S | E-W | N-S | E-W | N-S | E-W | N-S | E-W | |
1 | 4.07 | 4.20 | 3.15 | 3.05 | 4.76 | 4.96 | 3.22 | 2.75 | 4.68 | 3.82 | 4.15 | 5.21 | 11.37 | 10.79 | 7.91 | 8.76 |
2 | 3.63 | 4.86 | 3.21 | 3.13 | 4.71 | 5.80 | 3.09 | 2.96 | 4.53 | 3.78 | 4.19 | 5.16 | 17.27 | 5.97 | 7.30 | 14.25 |
3 | 3.88 | 3.14 | 2.82 | 2.85 | 5.15 | 3.47 | 2.81 | 2.60 | 3.09 | 4.04 | 3.26 | 5.03 | 9.08 | 13.94 | 3.75 | 5.24 |
4 | 5.57 | 4.27 | 3.15 | 2.98 | 5.40 | 5.37 | 3.09 | 2.74 | 4.38 | 5.17 | 4.49 | 4.14 | 9.60 | 5.82 | 6.30 | 11.65 |
5 | 7.25 | 5.19 | 3.12 | 2.90 | 5.86 | 5.46 | 3.19 | 3.94 | 5.61 | 4.95 | 6.95 | 4.55 | 6.63 | 10.98 | 13.55 | 6.85 |
6 | 4.75 | 2.71 | 2.84 | 2.78 | 6.06 | 3.54 | 3.02 | 2.66 | 3.00 | 4.85 | 3.23 | 5.41 | 4.18 | 17.07 | 4.95 | 5.74 |
7 | 4.28 | 6.09 | 3.05 | 3.05 | 4.60 | 5.67 | 2.77 | 2.73 | 5.49 | 3.96 | 4.86 | 3.58 | 9.95 | 11.24 | 6.29 | 4.75 |
8 | 5.01 | 3.29 | 3.18 | 3.20 | 4.94 | 3.41 | 3.02 | 2.92 | 3.42 | 4.15 | 4.24 | 5.17 | 3.66 | 6.95 | 9.24 | 12.36 |
9 | 5.75 | 4.70 | 2.87 | 2.91 | 5.85 | 6.37 | 2.65 | 2.53 | 4.09 | 4.29 | 3.74 | 4.24 | 14.39 | 19.78 | 6.43 | 7.00 |
10 | 5.02 | 4.37 | 3.18 | 2.98 | 4.32 | 3.92 | 3.11 | 2.98 | 4.56 | 4.73 | 5.71 | 4.99 | 5.87 | 9.11 | 11.57 | 12.04 |
11 | 5.19 | 6.06 | 2.79 | 2.81 | 4.99 | 5.86 | 2.80 | 2.98 | 5.28 | 4.86 | 5.32 | 4.05 | 10.02 | 12.12 | 5.79 | 5.82 |
12 | 3.93 | 4.76 | 3.08 | 2.87 | 5.09 | 4.06 | 3.12 | 2.98 | 4.58 | 3.64 | 3.70 | 5.21 | 10.83 | 8.83 | 4.13 | 5.00 |
13 | 6.58 | 3.47 | 4.75 | 4.27 | 6.74 | 4.95 | 5.49 | 4.70 | 3.04 | 5.81 | 6.61 | 7.44 | 7.58 | 11.76 | 6.31 | 11.42 |
14 | 4.78 | 3.23 | 2.87 | 3.01 | 5.84 | 4.24 | 3.21 | 3.10 | 3.24 | 4.52 | 4.81 | 4.59 | 5.78 | 12.02 | 13.27 | 7.14 |
15 | 5.30 | 3.64 | 2.74 | 2.70 | 5.11 | 3.88 | 2.67 | 2.17 | 4.07 | 4.01 | 3.25 | 4.33 | 6.57 | 8.62 | 8.54 | 12.73 |
16 | 5.01 | 4.93 | 2.75 | 2.68 | 7.35 | 6.96 | 2.95 | 2.70 | 3.78 | 4.56 | 3.67 | 4.54 | 18.98 | 14.05 | 13.51 | 10.36 |
17 | 4.23 | 5.16 | 3.36 | 3.25 | 4.58 | 4.89 | 3.16 | 3.01 | 4.68 | 3.73 | 5.81 | 4.41 | 9.51 | 8.47 | 9.87 | 8.00 |
18 | 5.53 | 4.20 | 3.49 | 3.37 | 5.63 | 6.25 | 3.42 | 2.76 | 4.25 | 4.47 | 4.05 | 5.26 | 11.56 | 11.96 | 9.28 | 10.13 |
19 | 4.14 | 5.07 | 2.61 | 2.49 | 4.50 | 6.17 | 2.54 | 2.59 | 4.31 | 3.69 | 3.89 | 2.92 | 12.33 | 13.11 | 8.24 | 6.02 |
20 | 2.87 | 5.52 | 2.44 | 2.41 | 2.51 | 4.91 | 2.32 | 2.37 | 4.33 | 2.80 | 3.67 | 2.30 | 10.05 | 4.68 | 8.87 | 5.96 |
MV | 4.84 | 4.44 | 3.07 | 2.98 | 5.20 | 5.01 | 3.08 | 2.91 | 4.22 | 4.29 | 4.48 | 4.63 | 9.76 | 10.86 | 8.25 | 8.56 |
COV | 21 | 22 | 15 | 13 | 19 | 21 | 20 | 19 | 18 | 16 | 24 | 23 | 41 | 35 | 36 | 35 |
Based on the results of the RG and RL parameters for the more realistic 3D structural representations (SAC and EQ models) it is observed the maximum value of this factor is 5.20. In the 2009 edition of the International Building Code, the force reduction factor is called the response modification factor which in turn depends on many factors including the ductility capacity and inelastic performance of structural material and system. According to this code, the maximum value of the force reduction factor (for special moment resisting frames) is 8. In the 2010 edition of the National Building Code of Canada, it is explicitly stated that the reduction factor depends on the structural over strength and on a factor which depends on the ductility capacity and materials. As for the IBC code, the maximum value of this factor (corresponding to the most ductile buildings) is 8. In the 2004 edition of Eurocode 8, the reduction factor depends on an over strength factor and on factors which in turn depend on structural material and structural systems; it can be inferred from the code that the maximum value of the reduction factor is approximately 8. Thus, based on the results of this research these values cannot be justified. More transparence is needed in the codes regarding the magnitude and the components involved in the force reduction factors.
Table 9Statistics for local force reduction factors (RL)
Model (1) | Column location | RμL,SAC | RμL,EQ | RμL,2D | RμL,,SD | ||||||||||||
Axial | Moment | Axial | Moment | Axial | Moment | Axial | Moment | ||||||||||
MV (3) | COV (4) | MV (5) | COV (6) | MV (7) | COV (8) | MV (9) | COV (10) | MV (11) | COV (12) | MV (13) | COV (13) | MV (15) | COV (16) | MV (17) | COV (18) | ||
Level 3 | EXT-NS OR SW | 4.59 | 27 | 2.80 | 1 | 4.42 | 28 | 2.88 | 8 | 3.42 | 17 | 4.26 | 19 | 3.75 | 29 | 9.35 | 24 |
INT-NS OR SW | 4.14 | 34 | 2.66 | 35 | 4.28 | 37 | 2.58 | 29 | 2.80 | 1 | 4.28 | 18 | 3.75 | 29 | 9.35 | 24 | |
EXT-EW OR SE | 2.69 | 14 | 2.74 | 12 | 2.66 | 15 | 3.00 | 26 | 3.28 | 15 | 4.37 | 18 | 3.78 | 37 | 9.58 | 28 | |
INT-EW OR SE | 4.03 | 32 | 4.28 | 23 | 4.03 | 32 | 4.40 | 24 | 2.83 | 2 | 4.45 | 18 | 3.78 | 37 | 9.58 | 28 | |
Level 10 | EXT-NS OR SW | 2.74 | 17 | 2.83 | 14 | 2.39 | 8 | 2.60 | 21 | 2.76 | 22 | 4.30 | 22 | 2.71 | 13 | 8.86 | 35 |
INT-NS OR SW | 2.32 | 2 | 2.81 | 14 | 2.39 | 5 | 2.60 | 22 | 2.30 | 1 | 4.42 | 23 | 2.48 | 13 | 8.86 | 35 | |
EXT-EW OR SE | 2.78 | 15 | 2.94 | 19 | 2.39 | 6 | 2.71 | 22 | 4.28 | 27 | 4.28 | 27 | 2.69 | 9 | 8.51 | 31 | |
INT-EW OR SE | 2.30 | 2 | 2.97 | 21 | 2.39 | 6 | 2.78 | 25 | 4.49 | 2 | 4.49 | 30 | 2.51 | 9 | 8.51 | 31 | |
8. Conclusions
The nonlinear seismic responses of steel buildings with perimeter moment resisting frames, modeled as complex 3D MDOF systems are calculated and the ductility demands (μG), ductility reduction factors (Rμ) and the force reduction factor (R) are studied. The results are compared with those of equivalent 3D models (EQ) with spatial moment resisting frames (SMRF) as well as with those of two-dimensional (2D) structural representations and equivalent single degree of freedom systems (SD). The 3- and 10-level steel buildings used in the SAC steel project and several strong motion records are considered in the study. Results indicate that the global and local force reduction factors significantly vary from one structural representation to another being much larger for the simplified SDOF representation (SD models). One of the reasons for this is that, although there is equivalence between the SD and MDOF models in terms of mass strength and stiffness, the dissipated energy and the number of incursions in the inelastic range are significantly larger for the SD model. In addition, when yielding occurs in the SD models, plastic hinges are simultaneously developed at both ends of all structural elements (eight columns) representing a totally plasticized structure, whereas for the SAC and EQ models (which have hundreds of beam and columns), even if significant yielding occurs, plastic hinges are developed only in a relatively small number of structural members. Thus, the dissipated energy is overestimated in SD systems. It is also observed that the magnitude the global responses force reduction factors (inter-story shear) is larger than that of local force reduction factors (axial load or bending moments), which in turn are larger for bending moments than for axial loads. Significant differences are observed between the results of the 3- and 10-story building reflecting the influence of the structural complexity on the reductions factors and on the ductility demands. According to the results obtained in this research for the more realistic representation of the steel building models (3D), the value of 8 suggested in many codes for the force reduction factor for the case of ductile steel moment resisting frames cannot be justified; it is only justified for the SD systems. The implication of this is that non-conservative designs may be obtained if so large value is used. It is the authors' opinion that the codes should be more transparent regarding the magnitude and the components involved in the force reduction factors. The conclusions of this paper are for the particular structural systems and models considered in the study. More research is needed to reach more general conclusions.
References
-
Uang C. M. Structural Overstrength and Limit State Philosophy in Seismic Design Provisions. Report No. CE-91-0, Department of Civil Engineering, Northeastern University, 1991.
-
Uang C. M. Establishing R (or Rw) and Cd factors for building seismic provisions. Journal of Structural Engineering ASCE, Vol. 117, Issue 1, 1991, p. 19-28.
-
Miranda E., Bertero V. Evaluation of strength reduction factors for earthquake-resistant design. Earthquake Spectra, Vol. 10, Issue 2, 1994, p. 357-379.
-
Whittaker A., Hart G., Rojahn C. Seismic response modification factors. Journal of Structural Engineering, Vol. 125, Issue 4, 1999, p. 438-444.
-
Steel Moment Frame Connections. Structural Engineers Associated of California, Applied Technology Council and California University for Research in Earthquake Engineering, Advisory No. 3, D-146, 2000.
-
Tentative Provisions for the Development of Seismic Regulation Buildings. Report No. ATC-3-06, Applied Technology Council, Redwood City, California, 1978.
-
Newmark N. M., Hall W. J. Earthquake Spectra and Design Monograph Series. Earthquake Engineering Research Institute, Berkeley, California, 1982.
-
Hadjian A. H. An evaluation of the ductility reduction factor Q in the 1976 Regulations for the Federal District of Mexico. Earthquake Engineering and Structural Dynamics, Vol. 18, 1989, p. 217-231.
-
Miranda E., Bertero V. Evaluation of strength reduction factors for earthquake-resistant design. Earthquake Spectra, Vol. 10, Issue 2, 1994, p. 357-379.
-
Ordaz M., Pérez-Rocha L. E. Estimation of strength-reduction factors for elasto-plastic systems: a new approach. Earthquake Engineering and Structural Dynamics, Vol. 27, Issue 9, 1998, p. 889-901.
-
Borzi B., Elnashai A. S. Refined force reduction factors for seismic design. Engineering Structures, Vol. 22, 2000, p. 1244-1260.
-
Arroyo-Espinoza D., Teran-Gilmore A. Strength reduction factors for ductile structures with passive energy dissipating devices. Journal of Earthquake Engineering, Vol. 7, Issue 2003, 2, p. 297-325.
-
Levy R., Rutenberg A., Qadi K. H. Equivalent linearization applied to earthquake excitations and the R-µ-T0 relationships. Engineering Structures, Vol. 28, Issue 2, 2006, p. 216-228.
-
Karmakar D., Gupta V. K. A parametric study of strength reduction factors for elasto-plastic oscillators. Sādhanā, Vol. 31, Issue 4, 2006, p. 343-357.
-
Karmakar D., Gupta V. K. Estimation of strength reduction factors via normalized pseudo-acceleration response spectrum. Earthquake Engineering and Structural Dynamics, Vol. 36, Issue 6, 2007, p. 751-763.
-
Ayoub A., Chenouda M. Response spectra of degrading structural systems. Engineering Structures, Vol. 31, 2009, p. 1393-1402.
-
Rupakhety R., Sigbjörnsson R. Ground-motion prediction equations (GMPEs) for inelastic displacement and ductility demands of constant-strength SDOF systems. Bulletin of Earthquake Engineering, Vol. 7, 2009, p. 661-679.
-
Sanchez-Ricart L. Assessment and management of risk for engineered systems and geohazards. Georisk, Vol. 4, Issue 4, 2010, p. 208-229.
-
Reyes-Salazar A., Haldar A. Nonlinear seismic response of steel structures with semi-rigid and composite connections. Journal of Constructional Steel Research, Vol. 51, 1999, p. 37-59.
-
Reyes-Salazar A., Haldar A. Dissipation of energy in steel frames with PR connections. International Journal on Structural Engineering and Mechanics, Vol. 9, Issue 3, 2000, p. 241-256.
-
Reyes-Salazar A., Haldar A. Energy dissipation at PR frames under seismic loading. Journal of Structural Engineering ASCE, Vol. 127, Issue 5, 2001, p. 588-593.
-
Reyes-Salazar A., Haldar A. Seismic response and energy dissipation in partially restrained and fully restrained steel frames: an analytical study. Steel and Composite Structures, Vol. 1, Issue 4, 2001, p. 459-480.
-
Reyes-Salazar A. Ductility and ductility reduction factors. International Journal on Structural Engineering and Mechanics, Vol. 13, Issue 4, 2002, p. 369-385.
-
Nassar A., Krawinkler H. Seismic Demands of SDOF and MDOF Systems. John A. Blume Earthquake Engineering Center, Report No. 95, Stanford University, 1991.
-
Santa-Ana P., Miranda E. Strength reduction factors of multi-degree-of-freedom systems. 12th World Conference on Earthquake Engineering, Auckland, New Zealand, 2000, p. 1446.
-
Elnashai A. S., Mwafy A. M. Overstrength and force reduction factors of multistorey reinforced-concrete buildings. Structural Design of Tall Buildings, Vol. 11, 2002, p. 329-351.
-
Medina R., Krawinkler H. Evaluation of drift demands for the seismic performance assessment of frames. Journal of Structural Engineering ASCE, Vol. 131, Issue 7, 2005, p. 1003-1013.
-
Medina R., Krawinkler H. Strength demand issues relevant for the seismic design of moment-resisting frames. Earthquake Spectra, Vol. 21, Issue 2, 2005, p. 415-439.
-
Cai J., Zhou J., Fang X. Seismic ductility reduction factors for multi-degree-of-freedom systems. Advances in Structural Engineering, Vol. 9, Issue 5, 2006, p. 591-601.
-
Karavasilis T. L., Bazeos N., Beskos D. E. Drift and ductility estimates in regular steel MRF subjected to ordinary ground motions: a design-oriented approach. Earthquake Spectra, Vol. 24, Issue 2, 2008, p. 431-451.
-
Chopra A. K. Dynamics of Structures. Prentice Hall, Third Edition, New Jersey, 2008.
-
Mollaioli F., Bruno S. Influence of side effects on inelastic displacement ratios for SDOF and MDOF systems. Computers and Mathematics with Applications, Vol. 55, 2008, p. 184-207.
-
Ceylan M., Arslan M. H., Ceylan R., Kaltakci M. Y., Ozbay Y. A new application area of ANN and ANFIS: determination of earthquake load reduction factor of prefabricated industrial buildings. Civil Engineering and Environmental Systems, Vol. 27, Issue 1, 2010, p. 53-69.
-
Ganjavi B., Hao H. Effect of structural characteristics distribution of strength demand and ductility reduction factor of MDOF systems considering soil-structure interaction. Earthquake Engineering and Engineering Vibration, Vol. 11, 2012, p. 205-220.
-
Kumar M., Stafford P. J., Elghazouli A. Y. Seismic shear demands in multi-storey steel frames designed according to Eurocode 8. Engineering Structures, Vol. 52, 2013, p. 69-87.
-
Kumar M., Stafford P. J., Elghazouli A. Y. Influence of ground motions characteristics on drift demands in steel moment frames designed according to Eurocode 8. Engineering Structures, Vol. 52, 2013, p. 502-517.
-
Abdollahzadeh G., Banihashemi M. Response modification factor of dual moment-resistant frame with buckling restrained brace (BRB). Steel and Composite Structures, Vol. 14, Issue 6, 2013, p. 621-636.
-
López-Barraza A., Bojórquez E., Ruiz SE., Reyes-Salazar A. Reduction of maximum and residual drifts on post-tensioned steel frames with semi-rigid connections. Advances in Materials Science and Engineering, 2013, p. 192484, https://doi.org/10.1155/2013/192484.
-
Rivera-Salas J. L., López-Barraza A., Ruiz S. E., Reyes-Salazar A. Evaluation of the response of post-tensioned steel frames with energy dissipaters using equivalent single-degree-of-freedom systems. Advances in Materials Science and Engineering, 2014, p. 730324-10, https://doi.org/10.1155/2014/730324.
-
Abdollahzadeh G., Faghihmaleki H. Response modification factor of SMRF improved with EBF and BRBs. Journal of Advanced Research in Dynamical and Control Systems, Vol. 6, Issue 4, 2014, p. 42-55.
-
Reyes-Salazar A., Bojórquez E., Velazquez-Dimas J. I., López-Barraza A., Rivera-Salas J. L. Ductility and ductility reduction factors for steel buildings considering different structural representations. Bulletin of Earthquake Engineering, Vol. 13, Issue 6, 2015, p. 1749-1771.
-
Serror M. H., Diab R. A., Mourad S. A. Seismic force reduction factor for steel moment resisting frames with supplemental viscous dampers. Earthquakes and Structures, Vol. 7, Issue 6, 2014, p. 1171-1186.
-
Hetao H., Bing Q. Influence of cumulative damage on seismic response modification factors of elastic perfectly plastic oscillators. Advances in Structural Engineering, Vol. 19, Issue 9, 2016, p. 473-487.
-
Abdi H., Hejazi F., Saifulnaz R., Karim I. A., Jaafar M. S. Response modification factor for steel structure equipped with viscous damper device. International Journal of Steel Structures, Vol. 15, Issue 3, 2015, p. 605-622.
-
Carr A. RUAUMOKO Inelastic Dynamic Analysis Program. University of Cantenbury, Department of Civil Engineering, 2011.
-
Chen W. F., Atsuta T. Interaction Equations for Biaxially Loaded Sections. Fritz Laboratory Report (72-9), Lehigh University, 1971, p. 284.
-
State of the Art Report on Systems Performance of Steel Moment Frames Subjected to Earthquake Ground Shaking. SAC Steel Project, Report 355C, Federal Emergency Management Agency, 2000.
-
Uniform Building Code. International Conference of Building Officials (ICBO), Whittier, California, 1997.
-
National Building Code. 12th Edition Building Officials and Code Administration International Inc., 1993.
-
Reyes-Salazar A. Inelastic Seismic Response and Ductility Evaluation of Steel Frames with Fully, Partially Restrained and Composite Connections. Ph.D. Thesis Department of Civil Engineering and Engineering Mechanics, University of Arizona, Tucson, AZ, 1997.
-
Osman A., Ghobarah A., Korol M. R. Implications of design philosophies of seismic response of steel moments frames. Earthquake Engineering and Structural Dynamics, Vol. 24, 1995, p. 1237-143.
-
Assaf A. F. Evaluation of Structural Overstrength in Steel Buildings Systems. Master Thesis, Northeastern University, Boston Massachusetts, 1989.
About this article
This paper is based on work supported by La Universidad Autónoma de Sinaloa (UAS) under Grant PROFAPI-2014/174. Financial support from The University of Arizona is also appreciated. Any opinions, findings, conclusions, or recommendations expressed in this publication are those of the authors and do not necessarily reflect the views of the sponsors.
Literature review: Alfredo Reyes-Salazar, Mario D. Llanes-Tizoc. Construction of numerical models: Alfredo Reyes-Salazar, Mario D. Llanes-Tizoc, Edén Bojórquez. Seismic analysis and construction of plots and tables: Alfredo Reyes-Salazar, Mario D. Llanes-Tizoc, J. Luz Rivera-Salas, Arturo Lopez-Barraza. Interpretation of results: Alfredo Reyes-Salazar, Mario D. Llanes-Tizoc, Edén Bojórquez, J. Luz Rivera-Salas, Arturo Lopez-Barraza, Achintya Haldar. Writing of paper: Alfredo Reyes-Salazar. Review of paper: Mario D. Llanes-Tizoc, Edén Bojórquez, Achintya Haldar.

