Abstract
Vibration monitoring signals are widely used for damage alarming among the structural health monitoring system. However, these signals are easily corrupted by the environmental noise in the collecting that hampers the accuracy and reliability of measured results. In this paper, a modified artificial bee colony (MABC) algorithm-based wavelet thresholding method has been proposed for noise reduction in the real measured vibration signals. Kent chaotic map and general opposition-based learning strategies are firstly adopted to initialize the colony. Tournament selection mechanism is then employed to choose the food source. Finally, the Kent chaotic search is applied to exploit the global optimum solution according to the current optimal value. Moreover, a generalized cross validation (GCV) based fitness function is constructed without requiring foreknowledge of the noise-free signals. A physical model experiment for a high-piled wharf structure is implemented to verify the feasibility of the proposed signal denoising approach. Particle swarm optimization (PSO) algorithm, basic artificial bee colony (BABC) algorithm and Logistic chaos artificial bee colony (LABC) algorithm and are also taken as contrast tests. Comparison results demonstrate that the proposed algorithm outperforms the other algorithms in terms of convergence speed and precision, and can effectively reduce the noise from the measured vibration signals of the high-piled wharf structure.
1. Introduction
Vibration-based structural health detection methods have attracted continuously attention over the past two decades for the safety evaluation of the large civil structures [1]. With the measured vibration signals, the health condition of the in-service civil structures can be identified. However, these signals are easily corrupted with noise originating from acquisition, transmission and processing that degrades the quality of the measured signals, and thus hampers the accuracy and reliability of the structural health detection. Therefore, the noise reduction should be considered as one of essential tasks in structural vibration measurements. Recently, lots of signal denoising methods have been put forward in literature based on the statistical and distributed properties of signal and noise [2-7]. These methods can be generally classified into two categories: spatial and transform domain [2]. The moving average filtering [3] and Kalman filtering [4] are the spatial domain methods, and Wiener filtering [5] and Fourier Transform-based techniques [6, 7] are transform domain methods. However, some inherent defects still exist in these denoising approaches, such as the residual motion artifacts of moving average filtering, the state formulations dependency of the Kalman filtering, the nonstationary process inapplicability of Wiener filtering, the time-frequency local analysis shortages of Fourier Transform-based techniques, and so forth. Among these two domains, more attempts have been made in literature to reduce the noise of signals in the wavelet transform (WT) domain [8-11]. Owing to the inherent properties of WT such as multi-resolution, decorrelation and time-frequency localization, this method has become very popular for the signal processing field since its original presentation. In the wavelet-based denoising techniques, the wavelet thresholding [8, 9] is the most widely applied method as it can estimate approximate optimal signal from the noisy data. For the wavelet thresholding denoising, the key is the choice of the threshold value. Commonly used threshold choice methods are: Stein unbiased risk threshold (rigrsure), Universal threshold (sqtwolog), Heuristic threshold (heursure) and Minimal great variance threshold (minimaxi) [10, 11]. Although these threshold selection rules can eliminate the noise effectively, some defects and constrains still exist in these methods. Firstly, the pre-estimation of the noisy signals is always required. In most of these threshold selection rules, the statistical properties of noisy signals are generally employed for denoising, such as the unbiased likelihood estimation of the rigrsure threshold rule, the standard noise variance of the sqtwolog threshold rule and the minimal great estimator of the minimaxi threshold rule. As the foreknowledge of the noisy signals is generally unavailable in actual engineering, the pre-estimation of the contaminated signals is needed in order to remove the noise. Secondly, the dependency of the thresholding method on a fixed threshold value makes it not flexible for usage. For a larger threshold value, the method can effectively eliminate the noise. However, it may also over kill too many small wavelet coefficients and produce many zero coefficients. Accordingly, the useful information may be filtered out and the structure of the original raw signals is destroyed. With a smaller threshold value, the denoised signals are more approximate to the original signals. But this threshold value selection method is more conservative so as to a relatively big part of noise cannot be reduced completely. In view of this, Devi and Asokan [12], and Meng et al. [13] have all proposed a subband adaptive method to select the optimal threshold for each wavelet decomposition level. In their improved methods, the noise can be effectively identified and eliminated. However, the pre-estimation of the noisy signals is still required for noise reduction. Concerning the existing defects of the prior noisy signals required strategies and fixed threshold value depended methods, Bhutada et al. [14] adopted particle swarm optimization (PSO) algorithm to solve the signal denoising problem. In this strategy, the level-dependent thresholds are employed and taken as the initial position of the PSO algorithm. The optimal denoising results could be obtained by minimizing the associated fitness function. Therefore, the prior knowledge of the noisy signals is not required and the threshold value is more flexible for usage. Unlike the PSO-based signal denoising method, Bhandari et al. [15] and Soni et al. [16] have all introduced artificial bee colony (ABC) algorithm to process the noisy signals. The optimized results show that the ABC algorithm outperforms a PSO algorithm in the capability of global optimization. The above swarm intelligence techniques could be applied to eliminate the noise and have already made great progress. However, the optimized fitness function of these methods is constructed through the thresholded signal and the noise-free signal, which is unknown in measured signals. The applications of these intelligent algorithms-based signals denoising in the actual engineering are thus limited.
Considering the existing defects and the advantages of the ABC algorithm over PSO algorithm, this paper proposes a modified artificial bee colony (MABC) algorithm-based wavelet thresholding method to reduce the noise better. Four strategies are firstly utilized to improve the basic ABC algorithm, including the Kent chaotic map, general opposition-based learning, tournament selection mechanism, and Kent chaotic search. The level-dependent thresholds are then initialized as the food positions of the MABC algorithm. A generalized cross validation (GCV) based fitness function is built without requiring foreknowledge of the noise-free signals. Finally, the MABC algorithm is employed to eliminate the noise of the measured vibration signals of a high-piled wharf structure. The simulation experiments compared with PSO algorithm and two different ABC algorithms variants are also conducted to verify the performance of the proposed approach.
The reminder of this paper is organized as follows. Section 2 introduces the basic theory of the thresholding denoising. Section 3 presents the noise reduction steps based on the proposed MABC approach. Section 4 provides the numerical simulation and results of different wavelet thresholding methods. Section 5 gives the results of optimization algorithms for vibration signals denoising of a high-piled wharf model. In Section 6, some conclusions are summarized.
2. Backgrounds
2.1. Stationary wavelet transform denoising
Denoising by discrete wavelet transform (DWT) thresholding is widely utilized in the noise reduction [14-16]. However, DWT is a non-redundant decomposition analysis, which leads to the translation non-invariance. The stationary wavelet transform (SWT) [17] was put forward to make the wavelet decomposition invariance as it can remove the down samplers and up samplers in the WT. This property ensures the same size of the subbands at different wavelet decomposition levels, which makes the study of optimal subband thresholds easier. Besides, the redundant decomposition of SWT can also provide a more accurate estimation of the variances at each wavelet decomposition level for recognizing noise [18]. Given the above advantages of SWT over DWT, the stationary transform is utilized in this paper to eliminate noise. As the construction of the wavelet function in the wavelet domain is difficult, Mallat [19] introduced a computationally efficient algorithm known as multi-resolution analysis. On the basis of this method, the signal denoising using the SWT can be divided into the following three steps.
1) With an appropriate wavelet basis function, decompose the noisy signal through SWT, and extract the corresponding approximation coefficients and detail coefficients. Suppose x(k) is the noisy signal, the following is the stationary wavelet decomposition equation [18]:
where aj,k and dj,k are the wavelet approximation coefficients and detail coefficients, respectively, h and g are impulse responses of low-pass and high-pass filters, respectively, j is the wavelet decomposition scale, k=0, 1,…,n-1, and n is the scattered sampling point.
Fig. 1 displays an example of the SWT decomposition process of a signal f.
Fig. 1An example of SWT decomposition of signal f

2) The obtained wavelet coefficients are shrunk by a thresholding function, which has an effect on the quality of the denoised signal. The commonly used thresholding functions are hard and soft thresholding functions. As the reconstructed signal is smoother using the soft thresholding function, it is adopted in this paper to modify the wavelet decomposition coefficients. The following is the expression of the soft thresholding function:
where W(dj,k) denotes the wavelet detail coefficients after thresholding, sgn(∙) is the Signum function, λ is the selected threshold value.
As the pre-estimation of the noisy signals is always required in the existing rigrsure, sqtwolog, heursure and minimaxi threshold selection strategies, the GCV [20] criterion-based threshold selection method is employed in this paper. This method depends on the input and output data only [21] and is proven to be asymptotically optimal in the Euclidean norm. Therefore, it does not require any prior knowledge of the noisy signals. The corresponding GCV function can be defined by [20]:
where is the wavelet coefficient of the real measured noisy signal, is the modified wavelet coefficient after using the threshold , is the total number of wavelet coefficients and is the number of these wavelet coefficients that were set to zero. Under the spline smoothing conditions [22], this threshold choice is asymptotically optimal estimation for the minimizer of the .
3) Wavelet reconstruction of the signal using approximation and modified detail coefficients by means of inverse SWT (ISWT) to estimate the original signals. The wavelet reconstruction equation can be presented as:
where are the modified wavelet coefficients by the thresholding function. From Eq. (4), we can obtain which is the estimated signal after wavelet denoising. The reconstruction process of signal can be seen in Fig. 2.
Fig. 2Reconstruction process of signal f

2.2. Wavelet-based optimization technique thresholding
According to the above denoising steps, we can obtain the goal of SWT denoising is to select the optimal thresholds. With the optimal thresholds, we can shrink the wavelet detail coefficients through thresholding function. Finally, the optimal estimation of the original signal can be reached employing the approximation and thresholded wavelet coefficients. Hence, the signal denoising can be presented as an optimization problem. Different optimization techniques can be employed to solve this problem. If we initialize the thresholds as the possible solutions of the optimization techniques, the optimal thresholds can be obtained by minimizing the objective function within iterative optimization procedure. Fig. 3 shows the basic theory of wavelet-based optimization technique thresholding [14-16].
Fig. 3Wavelet-based optimization technique thresholding [14-16]
![Wavelet-based optimization technique thresholding [14-16]](https://static-01.extrica.com/articles/17005/17005-img3.jpg)
3. Proposed MABC algorithm for denoising
3.1. Basic ABC algorithm
In basic ABC (BABC) algorithm, the swarm of artificial bees is composed of three groups of bees: employed bees, onlookers and scouts [23, 24]. The employed bees are occupied to exploit a specific food source and share information about this particular source with the onlookers through waggle dancing. The shared information includes the position and profitability of the food source. An onlooker chooses a food source with a probability related to its nectar information that taken from the employed bees. The chosen probability of a food source increases with the increasing nectar amount. When a food source is abandoned by the employed bees, the corresponding employed bee becomes a scout, and a new food source is randomly generated to replace the abandoned one. It is important to remark that the number of the employed bees or onlookers is equal to the number of the food sources, and both of them account for half of the whole bee colony. The position of a food source corresponds to a possible solution in the search space and the nectar amount represents the quality of the related solution. The implementation steps of the BABC algorithm are presented as follows.
1) Initialize population.
Similar to other evolutionary algorithms, the BABC algorithm searches for the optimal fitness through a randomly initialized bee colony. Suppose is the number of food sources, where the food source represents a candidate solution, is the dimension of the associated problem space, . The initialization of the food source can be expressed as:
where is the th dimensional component of the th food source, is a random constant in the range of [0, 1], is the minimum value of the th dimensional component and is the maximum value of the th dimensional component.
2) Employed bees.
At this stage, each employed bee searches the neighbor of its corresponding source to generate a new food source according to the search rule. If the nectar of the new food source is better than the old one, then retain the new food and abandon the old one. The new food source determination equation can be presented as follows:
where is a random number in the range of [–1, 1], is a randomly selected food source.
3) Onlooker bees.
After the searching of all employed bees, the onlookers choose a food source to exploit further according to the probability associated to the nectar amount, which is shared by the employed bees on the dance area. Generally, this choice process is conducted based on the fitness of the possible solution. The corresponding fitness function is computed as:
where is the objective function of the th food source, is the corresponding fitness value.
4) Scout bees.
If the fitness of a food source is not improved for a predefined number of trials called “limit”, then that food source is assumed to be exhausted and should be abandoned. The corresponding employed bee becomes a scout, and a new food source is randomly determined by Eq. (5).
3.2. Proposed MABC algorithm
3.2.1. Kent chaotic sequence
The characteristics of chaos technique, including the ergodicity, randomicity and regularity, can be utilized to improve the performance of the BABC algorithm. Attempts have been made in literature [25, 26] to modify the dynamic property of the BABC algorithm by introducing the Logistic chaos, and the so called Logistic chaos-based ABC (LABC) algorithm is proposed herein. However, the Logistic map is a nonuniform ergodicity, which may affect the search speed and efficiency of the LABC algorithm. As compared with the Logistic chaos, the Kent chaos mapping has better uniform ergodicity. Besides, the Kent and Logistic chaos have the same characteristic of topological conjugacy. Therefore, the Kent chaos can also be employed to modify the BABC algorithm. Considering the better uniform ergodicity of the Kent chaos, the chaotic sequences in this paper are produced using Kent map, which can be expressed as:
where is a random number in the range of (0, 1), is a control parameter in the range of [0, 1]. The Kent chaotic sequence can be obtained through gradually iteration. When is taken as 0.4, the sequence of Kent map is chaotic, and the corresponding probability density function satisfies uniform distribution in the rage of [0, 1], namely:
Fig. 4 shows the probability distribution histograms of Kent and Logistic chaos (its control parameter is set to 4) for 40, 000 independent iterations. As clearly presented in this figure, the probability of Logistic map is higher in the ranges of [0, 0.1] and [0.9, 1] compared with the other ranges. However, the probability of Kent map is nearly uniformly distributed in the whole range of [0, 1]. This indicates that the ergodicity of Kent map is better than Logistic map. According to the following steps, the Kent chaotic sequences can be generated.
1) Produce a random initial value in the feasible region.
2) Generate a chaotic sequence through gradually iteration using Eq. (8).
3) Repeat the above iterative process until the maximum number of allowable iterations is achieved.
Fig. 4Probability distribution histograms of chaotic maps
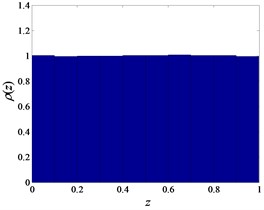
a) Kent map
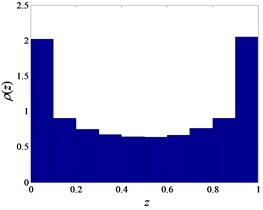
b) Logistic map
3.2.2. Opposition-based learning strategy
Opposition-based learning is a new concept in computational intelligence [27]. The main idea behind the opposition learning strategy is the simultaneous consideration of an estimate and its corresponding opposite estimate to achieve a better approximation for the current candidate solution [27]. This strategy has been successfully applied to enhance various optimization techniques [28-30] since its first introduction. This paper employs an improved version, known as general opposition-based learning (GOBL) strategy [31], to improve the efficiency of the ABC algorithm’s initialization.
Suppose is a possible solution of the current optimization problem, its corresponding opposite solution can be defined as:
where is a random number within [0, 1], and are the minimum and maximum values of the th dimension in the current search space, respectively.
If the new transformed opposite candidates are found outside the box-constraint , then these candidates are assigned to random values as follows:
where is a random number in the range of and is the interval boundaries of current search space.
3.2.3. Kent chaotic search
In case the current optimal food position rush to a local optimum, the Kent chaotic search is employed to further develop it, where . The implementation steps of the chaotic search are
1) Generate a random number as the iterative initial value in the feasible region.
2) Substitute into Eq. (8) and produce the chaotic variate through Kent chaotic iteration, where , and is the maximum number of allowable chaotic iteration.
3) Load the obtained chaotic variate into the neighborhood of the original solution space by the way of carrier, and produce the following new food source :
where is the chaotic search radius, which is determined based on the initial region of the position vector. It is easy to know the search radius in this paper should be taken as:
4) Compute the fitness value of the new food source , and compare this value with the original fitness value to retain the better one.
5) Steps 2 to 4 are repeated until the maximum number of allowable chaotic iterations is achieved.
3.2.4. Tournament selection
In general, the roulette strategy is always adopted to choose the food source, whose selected probability is in proportion to the fitness value. This strategy can enhance the convergence speed in the early stages. However, during the latter stages, the super individuals are easily developed which may lead to premature convergence. As opposed to roulette selection, the tournament mechanism refers to the relative values of individuals, which is not in proportion to the fitness values [32]. Thus, the influence of the super individuals is avoided. In view of this, the tournament strategy is occupied by the onlookers to choose the food source. The specific steps can be described as follows. Select two individuals randomly from the artificial bee colony, and compute their fitness values, respectively. The individual with larger fitness value is recorded one score. Repeat the above two steps for times, and preserve the individual that wins the highest scores, which is the selected individual. The corresponding selection probability computation equation is:
where is the score of the th individual.
3.2.5. Fitness function
For real measured signals, the noise-free signals are always unknown. Therefore, the fitness function constructed using the raw signal is not suitable for signal denoising in actual engineering. As mentioned above, the GCV method does not require any prior knowledge about the noisy signals, and can obtain the asymptotically optimal estimation for the minimizer of the GCV function. What’s more, the goal of SWT-based ABC algorithm denoising is to search for the optimal thresholds by minimizing the objective function. Accordingly, we can take the GCV function as the objective function. Substituting the GCV function into Eq. (7), we can reach the corresponding fitness function:
where is the wavelet threshold of the th decomposition level.
3.3. Signal denoising using the MABC algorithm
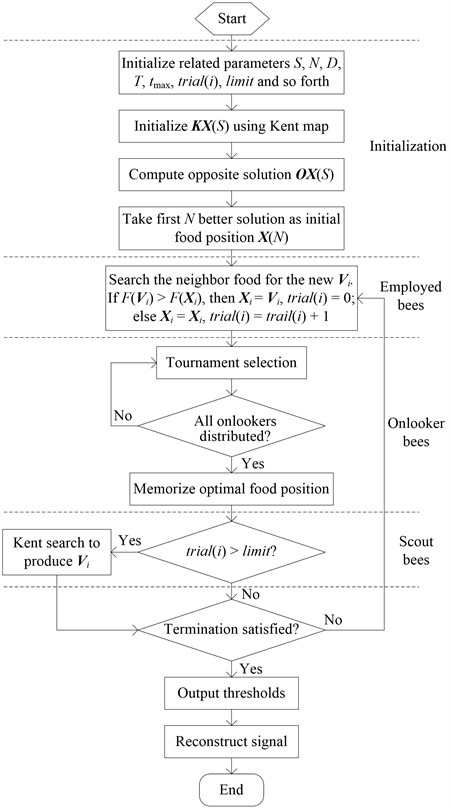
The proposed MABC algorithm is designed to denoise the real measured signals. The flow chart of the designed approach is displayed in Fig. 5. As shown in this figure, the specific steps of this method are presented as follows.
Step 1. Initialize related parameters such as swarm size , number of food sources , search dimension , maximum number of allowable evolutionary iterations , maximum number of allowable chaotic iterations , exploiting trials of the same food , maximum number of allowable trails “limit”, and so forth.
Step 2. Produce D-dimensional chaotic sequence according to the steps of Kent map presented in Section 3.2.1, and generate the chaotic individual by the following carrier equation:
Step 3. Compute the opposite solution corresponds to the chaotic individuals according to the GOBL strategy described in Section 3.2.2.
Step 4. Sort the solutions by the corresponding fitness values, and take the first solutions associated with better fitness values as the initial food source .
Step 5. Each employed bee searches the neighbor food for the new position , and compute the corresponding fitness value . If , then , ; else does not change, .
Step 6. On the basis of tournament selection probability presented in Eq. (14), the onlooker bees choose a food source to conduct neighborhood search.
Step 7. Memorize the optimal food position if all onlookers are distributed onto food source otherwise return to Step 6.
Step 8. If the value of the counter that recorded the exploit time of the same food is larger than the predefined “limit”, then conduct the Kent chaotic search to produce new food source ; otherwise turn to next step.
Step 9. Repeat Step 5-8 till maximum number of evolutionary iterations is achieved.
Step 10. Output obtained optimal thresholds and reconstruct the signals using ISWT method.
Fig. 5Flow chart of measured signal denoising using the proposed wavelet-based MABC thresholding
4. Numerical simulation and results
The performance of the proposed MABC algorithm-based wavelet thresholding is tested by processing benchmark signals corrupted with different levels of additive noise. The classical thresholding methods and optimization algorithms-based thresholding algorithms are conducted for comparison. The signal-to-noise ratio (SNR) of the reconstructed signals is employed to evaluate the performance of the noise reduction procedure, which can be presented as follows:
where is the noise-free signal, is the reconstructed signal, is the number of samples.
4.1. Simulation setting
The compared four benchmark signals are Blocks, Bumps, Heavy sine, and Doppler. Two degrees of noise are added to these signals and the corresponding SNR of the contaminated noisy signals is 5.0000 db and 10.0000 db for each benchmark, respectively. The classical soft and hard thresholding [9] methods and the existing optimization algorithms-based (i.e., PSO [14], BABC [24], and LABC [25]) thresholding approaches are performed to verify the performance of the proposed thresholding denoising technique. For a fair comparison, all of the denoising algorithms are executed on the same computer configuration (ACPI Multiprocessor PC with Intel-Pentium® 2.13 GHz CPU and 1.92 Gbyte RAM) with MATLAB 2009a. The total number of samples is 2048. The Toolbox for wavelets 4.4 is utilized for the library of wavelet filters. The wavelet transform basis function is db4, and the decomposition level is 3. In the classical thresholding methods, the Universal threshold is adopted for the denoising procedure. For the optimization algorithms-based thresholding approaches, the level-dependent threshold values are adopted so that adapt to the signals and noise features. For different decomposition levels, different threshold values are used. Hence, the number of threshold values should be set to 3, and the possible solution of the optimization algorithms-based thresholding methods can be presented as a three-dimensional vector. The parameters of the four algorithms are set as follows. In PSO algorithm, the swarm size is taken as twice the dimensional search space. The maximum number of allowable evolutionary iterations is set to 50, and the other parameter sets recommended in the literature is used. In BABC, LABC and KABC algorithms, the following basic settings of parameters are the same. The swarm size is set to 6, which includes 3 employed bees and 3 onlookers. The maximum number of allowable evolutionary iterations is the same as PSO algorithm. The maximum number of allowable trails “limit” is given by . Particularly, the maximum number of chaotic iteration of LABC and KABC algorithms is set to 30. All denoising results of the optimization algorithms-based thresholdings are averaged over 20 independent trails to eliminate the random discrepancy.
4.2. Results and analysis
Table 1 presents the SNR results of the classical wavelet thresholding and mean values of the 20 trails using the optimization algorithms-based thresholding methods. The best results of these methods are indicated by boldface. As shown in this table, except for the same denoising results for the noisy Heavy sine signal with SNR is 5 db, all the optimization algorithms-based thresholding techniques obtain better results than the classical soft and hard thresholding methods. This result reveals the advantages of the adopted optimization algorithms-based wavelet thresholding methods. Besides, the MABC algorithm-based wavelet thresholding obtains the best results among the noise reduction methods in Blocks signal and Doppler signal denoising. For Bumps signal, the MABC algorithm-based thresholding obtains the same results as BABC and LABC algorithms-based thresholding methods, which are the best results among the denoising methods. When the SNR of noisy Heavy sine is 10 db, the MABC algorithm gets the same result as LABC algorithms-based thresholding method, which is also the best one. Hence, we can find the proposed wavelet thresholding method can effectively reduce the noise.
Table 1Comparison SNR of four benchmark signals denoising with different wavelet methods
Signals | Noisy signal | Soft | Hard | PSO | BABC | LABC | MABC |
Blocks | 5.0000 | 14.1298 | 14.1298 | 14.1738 | 14.1837 | 14.1821 | 14.1939 |
10.0000 | 17.0704 | 17.2323 | 17.5341 | 17.5574 | 17.5579 | 17.5582 | |
Bumps | 5.0000 | 14.1019 | 14.0514 | 14.1032 | 14.1043 | 14.1043 | 14.1043 |
10.0000 | 19.1348 | 19.0677 | 19.1380 | 19.1401 | 19.1401 | 19.1401 | |
Heavy sine | 5.0000 | 14.0555 | 14.0555 | 14.0555 | 14.0555 | 14.0555 | 14.0555 |
10.0000 | 19.1122 | 19.1122 | 19.1208 | 19.1211 | 19.1212 | 19.1212 | |
Doppler | 5.0000 | 14.8908 | 14.8517 | 14.9531 | 14.9645 | 14.9644 | 14.9648 |
10.0000 | 18.3487 | 18.6771 | 18.6800 | 18.6814 | 18.6816 | 18.6926 |
5. High-piled wharf model test and data analysis
5.1. Experimental process
In order to verify the performance of the proposed wavelet thresholding for actual vibration signal denoising, the test of a physical model for high-piled wharf was carried out for this study. This experiment was conducted at the Key Laboratory of Harbor & Marine Structure Safety of Ministry of Transport in Tianjin Research Institute Water Transport Engineering, China [33]. The experimental physical model is structural segment of a high-piled wharf in the Tianjin Harbor, which is designed with a scale of 1:10. As the soil is involved in this physical model, the experiment cannot fully satisfy the similarity criterion. The wharf is constructed out of reinforced concrete, and is established on the soft clay foundation, which is composed of two layers of clay. The width, length, and breadth of the soil bin are 6.5, 14.5, and 3 m, respectively. The width and length of the wharf model are 2 and 6 m, respectively. The framed bents are 0.7 m apart, and the total number of bents is 9. The sectional drawing of this model [33] can be seen in Fig. 6. All of the components and corresponding sizes of the bents are displayed in this figure.
Fig. 6Sectional drawing of the high-piled wharf model [33]
![Sectional drawing of the high-piled wharf model [33]](https://static-01.extrica.com/articles/17005/17005-img7.jpg)
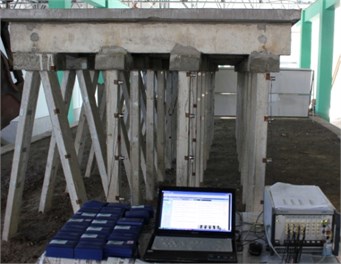
Forced vibration testing was performed on the high-piled wharf. The excitations were applied by use of hammering method. The instrumented accelerometers number of each vertical piles and oblique piles were 4 and 3, respectively, and the corresponding locations are shown in Fig. 7(a). The accelerometers used in the test were INV 9828 (Piezotronics). The measured vibration signals were collected using a high speed data acquisition system model number INV 3020C. The tests of vertical piles and oblique piles are conducted separately, and each set of test includes two directions (i.e., alongshore and vertical alongshore directions). The total sets of the tests are 4, which are carried out under the same humidity and temperature and by the same operator. The data was acquired at the rate of 256 Hz for 10 seconds. The accelerometers, acquisition instrument and physical model connections are given in Fig. 7(b). As the frequency range of interest is less than 20 Hz, the vibration data is low-pass filtered using a Chebyshev filter with passband cut-off frequency 20 Hz. After pre-processing, the measured data was down sampled to 51.2 Hz, and the corresponding number of sampling points is 512.
Fig. 7Sensor locations (alongshore direction) and experimental connections
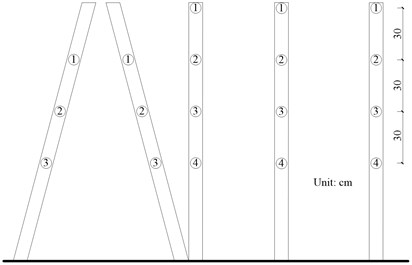
a) Schematic diagram of accelerometer locations
b) Experimental connections for model tests
5.2. Real data denoising results and analysis
As the original noise-free vibration signals are unknown, the SNR of the denoised signals, which can be used to evaluate the classical thresholding methods, cannot be calculated. Besides, take the advantage of the optimization algorithms over the classical thresholding methods into consideration, we only use the optimization algorithms-based thresholding methods to denoise the actual measured vibration signals. The measured acceleration response with respect to the three vertical piles and one oblique pile in alongshore direction is observed. To simplify this problem, the response corresponds to the first accelerometer of the four piles is considered. For illustrative purposes, the investigated four sets of signals are recorded as , , and , respectively. The above mentioned parameter sets of the four optimization algorithms are used.
Table 2Comparison denoising results of four sets of vibration signals
Signals | Algorithms | Best | Worst | Mean | Std |
PSO | 2.8794×10⁻⁶ | 6.8607×10⁻⁶ | 4.3575×10⁻⁶ | 1.0677×10⁻⁶ | |
BABC | 2.8408×10⁻⁶ | 3.4542×10⁻⁶ | 2.9386×10⁻⁶ | 1.3713×10⁻⁷ | |
LABC | 2.8352×10⁻⁶ | 3.4675×10⁻⁶ | 2.9132×10⁻⁶ | 1.6804×10⁻⁷ | |
MABC | 2.8299×10⁻⁶ | 2.9282×10⁻⁶ | 2.8562×10⁻⁶ | 2.2121×10⁻⁸ | |
PSO | 3.2119×10⁻⁶ | 6.1923×10⁻⁶ | 5.1396×10⁻⁶ | 1.2225×10⁻⁶ | |
BABC | 3.1453×10⁻⁶ | 5.8010×10⁻⁶ | 3.5467×10⁻⁶ | 7.4647×10⁻⁷ | |
LABC | 3.1353×10⁻⁶ | 5.7814×10⁻⁶ | 3.5279×10⁻⁶ | 7.8262×10⁻⁷ | |
MABC | 3.1217×10⁻⁶ | 4.1177×10⁻⁶ | 3.2509×10⁻⁶ | 2.3309×10⁻⁷ | |
PSO | 9.3387×10⁻⁶ | 4.2207×10⁻⁵ | 3.3561×10⁻⁵ | 1.3015×10⁻⁵ | |
BABC | 9.1367×10⁻⁶ | 4.2479×10⁻⁵ | 1.4521×10⁻⁵ | 1.0172×10⁻⁵ | |
LABC | 9.1259×10⁻⁶ | 4.0375×10⁻⁵ | 1.1958×10⁻⁵ | 6.9817×10⁻⁶ | |
MABC | 9.1843×10⁻⁶ | 1.3802×10⁻⁶ | 9.6775×10⁻⁶ | 1.1141×10⁻⁶ | |
PSO | 7.7740×10⁻⁶ | 4.4071×10⁻⁵ | 2.0741×10⁻⁵ | 1.1490×10⁻⁵ | |
BABC | 7.7001×10⁻⁶ | 2.5098×10⁻⁵ | 1.0361×10⁻⁵ | 5.1464×10⁻⁶ | |
LABC | 7.7027×10⁻⁶ | 1.7570×10⁻⁵ | 9.1053×10⁻⁶ | 2.5742×10⁻⁶ | |
MABC | 7.7005×10⁻⁶ | 1.0109×10⁻⁵ | 8.1906×10⁻⁶ | 7.7447×10⁻⁷ |
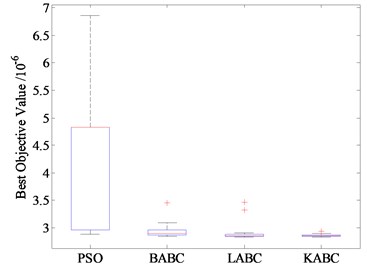
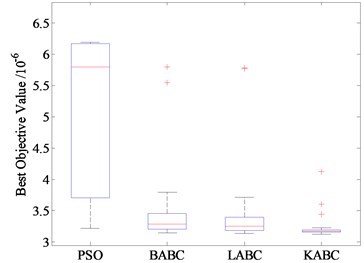
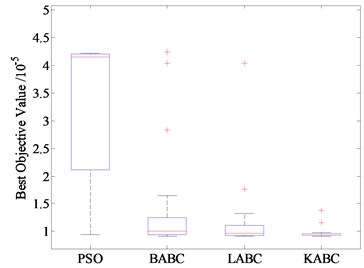
All densoing results of the compared optimization algorithms-based thresholding methods are also computed 20 independent trails. The computation objective values of the four different optimization algorithms, including the best, worst, mean and standard deviation (std) values, are listed in Table 2. The best results of these methods are indicated by boldface. As shown in this table, the proposed MABC algorithm-based thresholding can obtain the optimal denoising results except for the best objective values of and . This comparison result indicates the superiority of the MABC algorithm in terms of the global optimization.
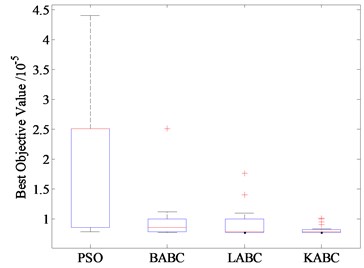
Fig. 8 presents the box-and-whisker diagrams relevant to the vibration signals denoising results belonging to the four different algorithms for 20 independent trials. Normally, the bottom and top of the boxes in these diagrams represent the lower and upper quartiles; the bands within the boxes give the median; the whiskers extend to the maximum and minimum of the obtained objective values; the symbols ‘+’ stand for the outliers. From the box-and-whisker displayed in Fig. 8, one may easily notice that the MABC algorithm provides denoising results that read very low amplitude of maximum objective values. The MABC method obtains denoising performance characterized by narrower boxes and lower median values. This result indicates the proposed MABC algorithm can obtain the minimum objective value.
Fig. 8Statistics of the denoising results of the four optimization algorithms-based thresholdings for different measured vibration signals
a) signal
b) signal
c) signal
d) signal
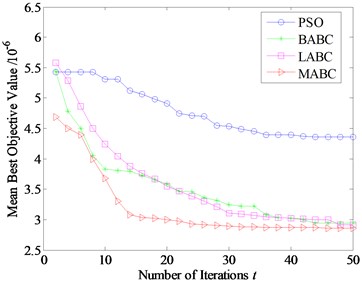
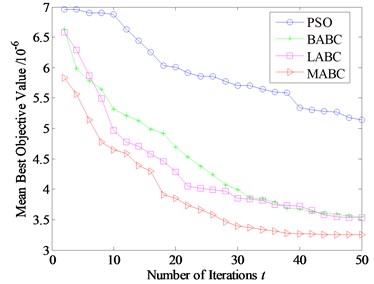
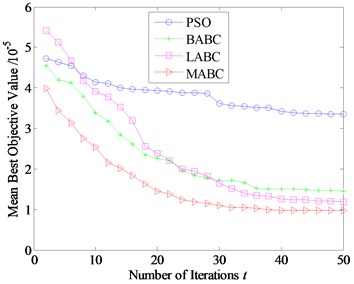
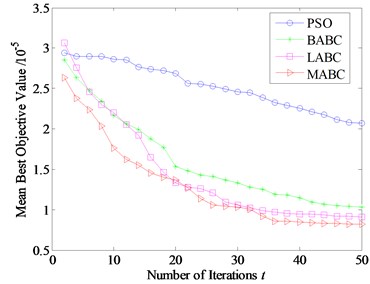
In Fig. 9, the mean best objective values of the above four optimization algorithms for 20 independent trials are compared. From Fig. 9, it is clear that the MABC algorithm converges faster and finds better solutions than all of the other methods for and signals. For and signals, the MABC method has similar convergence speed with LABC method. However, the MABC method has shown to have improved the solutions throughout the denoising process. This result indicates the MABC-based wavelet thresholding outperforms all of the other denoising strategies.
In view of the advantages of the proposed MABC approach, we use this algorithm to denoise the measured signals. Fig. 10 presents the measured signals and the corresponding power spectrum density (PSD) at the first pile of the physical model before and after denoising. As illustrated in Fig. 10(a), the measured signals are contaminated by the interference of the environment because of the relative wide bandwidth of the receiver. After filtering by the proposed thresholding, the signals are clearer than the measured signals. Besides, the denoised signals show lower amplitude of maximum values and have a smaller spread of coordinates. This result indicates the proposed thresholding method is effective in signal denoising. The efficiency of the proposed denoising method can also be verified by the PSD of the signals before and after filtering given in Fig. 10(b). The proposed method can clearly reduce the noise spectrum compared with the unprocessed signals.
Fig. 9Evolution process curves of four optimization thresholdings densoing for different measured vibration signals
a) signal
b) signal
c) signal
d) signal
Fig. 10Acceleration response and corresponding PSD before and after filtering
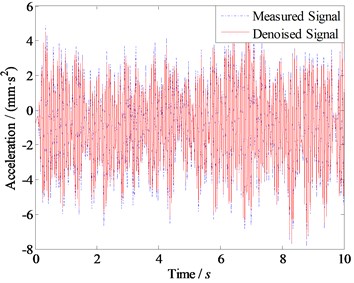
a) Measured and denoised response
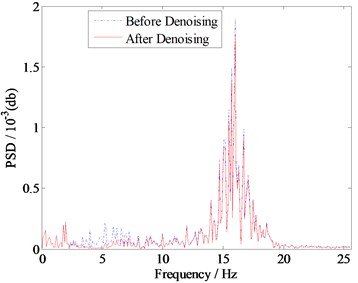
b) PSD of the measured and denoised signals
5.3. Discussion
The denoising experiment is conducted on the basis of physical model of a high-piled wharf structure, which is designed with a certain reduced-scale. As the physical model cannot fully satisfy the similarity criterion, the denoising experiment cannot completely reflect the actual engineering. Therefore, the model errors may impact the filtering results that are not considered in the denoising experiments. However, this problem can be solved if we employ the measured signals from the actual engineering. Besides, we only take one wavelet basis function and fixed wavelet decomposition level so that investigate the impact of threshold determination on the thresholding denoising methods. The validity of the proposed wavelet thresholding method could be verified by the experiment results. However, different wavelet basis functions and decomposition levels may also affect the performance of the denoising approaches. We could consider the influences of these factors in future research. What’s more, the control parameters of the filtering algorithm, namely, threshold values in this paper, are initialized as the position of the optimization algorithm. The optimal threshold values are reached by minimizing the associated objective function. For the random discrepancy of the optimization algorithm, each computation may vary the denoising results together with the threshold values. Further, the optimization algorithm also has sensitive control parameters and their variation may seriously change the denoising results, which may lead to different threshold values as well. We also more concerned about the denoising results than the specific threshold values. Hence, this paper makes the parameters of the filtering algorithm controlled by the optimization algorithm and does not present the specific set of the threshold values.
6. Conclusions
In this paper, a MABC-based wavelet thresholding method is proposed to eliminate the noise of the measured vibration signals. With numerical simulation and model experiment, some conclusions are summarized as follows:
1) Strategies such as Kent chaotic map, general opposition-based learning, tournament selection and Kent chaotic search can be employed to improve the optimization performance of ABC algorithm.
2) In constructing the fitness function, a new method based on the GCV criterion is proposed, which does not require any prior knowledge about the noisy signals. Using this approach, the noise of the measured vibration signals can be easily eliminated.
3) The contrast model experiment results with PSO and two different ABC algorithms for noise reduction of a high-piled wharf structure show that the proposed MABC algorithm has better enhancement in global optimization and convergence speed.
References
-
Yi T. H., Li H. N., Zhao X. Y. Noise smoothing for structural vibration test signals using an improved wavelet thresholding technique. Sensors, Vol. 12, Issue 8, 2012, p. 11205-11220.
-
Gonzalez R. C., Woods R. E. Digital Image Processing. 2nd Ed. Pearson Prentice-Hall, Singapore, 2002.
-
Lee H., Lee J., Jung W., Lee G. The periodic moving average filter for removing motion artifacts from PPG signals. International Journal of Control, Automation, and Systems, Vol. 5, Issue 6, 2007, p. 701-706.
-
Jwo D. J., Cho T. S. Critical remarks on the linearised and extended Kalman filters with geodetic navigation examples. Measurement, Vol. 43, Issue 9, 2010, p. 1077-1089.
-
Souden M., Benesty J., Affes S. On the global output SNR of the parameterized frequency-domain multichannel noise reduction Wiener filter. Signal Processing Letters, Vol. 17, Issue 5, 2010, p. 425-428.
-
Soon Y., Koh S. N. Speech enhancement using 2-D Fourier transform. IEEE Transactions on Speech and Audio Processing, Vol. 11, Issue 6, 2003, p. 717-724.
-
Giurgiutiu V., Yu L. Comparison of short-time fourier transform and wavelet transform of transient and tone burst wave propagation signals for structural health monitoring. Proceedings of 4th International Workshop on Structural Health Monitoring, Stanford, USA, 2003, p. 1267-1274.
-
Donoho D. L., Johnstone I. M. Ideal spatial adaptation by wavelet shrinkage. Biometrika, Vol. 81, Issue 3, 1994, p. 425-455.
-
Donoho D. L., Johnstone I. M. Adapting to unknown smoothness via wavelet shrinkage. Journal of the American Statistical Association, Vol. 90, Issue 432, 1995, p. 1200-1224.
-
Jansen M. Minimum risk thresholds for data with heavy noise. IEEE Signal Processing Letters, Vol. 13, Issue 5, 2006, p. 296-299.
-
Zhang B., Sun L., Yu H., Xin Y., Cong Z. Wavelet denoising method for laser-induced breakdown spectroscopy. Journal of Analytical Atomic Spectrometry, Vol. 28, Issue 12, 2013, p. 1884-1893.
-
Devi P. N., Asokan R. An improved adaptive wavelet shrinkage for ultrasound despeckling. Sadhana, Vol. 39, Issue 4, 2014, p. 971-988.
-
Meng B., Li Z., Wang H., Li Q. An improved wavelet adaptive logarithmic threshold denoising method for analysing pressure signals in a transonic compressor. Proceedings of the Institution of Mechanical Engineers, Part C: Journal of Mechanical Engineering Science, Vol. 229, Issue 11, 2015, p. 2023-2030.
-
Bhutada G. G., Anand R. S., Saxena S. C. PSO-based learning of sub-band adaptive thresholding function for image denoising. Signal, Image and Video Processing, Vol. 6, 2012, p. 1-7.
-
Bhandari A. K., Soni V., Kumar A., Singh G. K. Artificial bee colony-based satellite image contrast and brightness enhancement technique using DWT-SVD. International Journal of Remote Sensing, Vol. 35, Issue 5, 2014, p. 1601-1624.
-
Soni V., Bhandari A. K., Kumar A., Singh G. K. Improved sub-band adaptive thresholding function for denoising of satellite image based on evolutionary algorithms. IET Signal Processing, Vol. 7, Issue 8, 2013, p. 720-730.
-
Pesquet J. C., Krim H., Carfantan H. Time-invariant orthonormal wavelet representations. IEEE Transactions on Signal Processing, Vol. 44, Issue 8, 1996, p. 1964-1970.
-
Zhong S., Oyadiji S. O. Crack detection in simply supported beams using stationary wavelet transform of modal data. Structural Control and Health Monitoring, Vol. 18, Issue 2, 2011, p. 169-190.
-
Mallat S. Theory for multi-resolution signal decomposition: the wavelet representation. IEEE Transactions on Pattern Analysis and Machine Intelligence, Vol. 11, Issue 7, 1989, p. 674-693.
-
Jansen M., Malfait M., Bultheel A. Generalized cross validation for wavelet thresholding. Signal Processing, Vol. 56, Issue 1, 1997, p. 33-44.
-
Weyrich N., Warhola G. T. Wavelet shrinkage and generalized cross validation for image denoising. IEEE Transactions on Image Processing, Vol. 7, Issue 1, 1998, p. 82-90.
-
Wahba G. Spline models for observational data. Philadelphia, PA, SIAM, 1990.
-
Karaboga D. An Idea Based on Honey Bee Swarm for Numerical Optimization. Technical Report tr06, Erciyes University, Engineering Faculty, Computer Engineering Department, 2005.
-
Karaboga D., Basturk B. On the performance of artificial bee colony (ABC) algorithm. Applied Soft Computing, Vol. 8, Issue 1, 2008, p. 687-697.
-
Xu C., Duan H., Liu F. Chaotic artificial bee colony approach to uninhabited combat air vehicle (UCAV) path planning. Aerospace Science and Technology, Vol. 14, Issue 8, 2010, p. 535-541.
-
Xiang W. L., An M. Q. An efficient and robust artificial bee colony algorithm for numerical optimization. Computers and Operations Research, Vol. 40, Issue 5, 2013, p. 1256-1265.
-
Tizhoosh H. R. Opposition-based learning: a new scheme for machine intelligence. Proceedings of International Conference on Computational Intelligence for Modeling, Control and Automation, Vienna, Austria, 2005, p. 695-701.
-
Wang H., Wu Z., Rahnamayan S., Liu Y., Ventresca M. Enhancing particle swarm optimization using generalized opposition-based learning. Information Sciences, Vol. 181, Issue 20, 2011, p. 4699-4714.
-
Wang H., Wu Z., Rahnamayan S. Enhanced opposition-based differential evolution for solving high-dimensional continuous optimization problems. Soft Computing, Vol. 15, Issue 11, 2011, p. 2127-2140.
-
El-Abd M. Generalized opposition-based artificial bee colony algorithm. IEEE Congress on Evolutionary Computation, Brisbane, Queensland, 2012, p. 1-4.
-
Wang H., Rahnamayan S., Wu Z. Parallel differential evolution with self-adapting control parameters and generalized opposition-based learning for solving high-dimensional optimization problems. Journal of Parallel and Distributed Computing, Vol. 73, Issue 1, 2013, p. 62-73.
-
Bao L., Zeng J. Comparison and analysis of the selection mechanism in the artificial bee colony algorithm. Proceedings of 9th International Conference on Hybrid Intelligent Systems, Shenyang, China, Vol. 1, 2009, p. 411-416.
-
Sun X. P., Wang Y. Z., Zhao B. H. Modal experiment of physical model for high-piled wharf under ambient excitation. Journal of Vibration, Measurement and Diagnosis, Vol. 33, Issue 2, 2013, p. 263-268, (in Chinese).
About this article
The physical model experiment for the high-piled wharf structure was conducted at the Key Laboratory of Harbor and Marine Structure Safety of Ministry of Transport in Tianjin Research Institute Water Transport Engineering, China. The authors are highly appreciative for the assistance by an Associate Fellow Sun X. P. and a Research Assistant Zhang G. in constructing the experimental setup presented in this paper. This work was sponsored by the National Science Foundation for Youths of China (Grant No. 51505499) and Jiangsu Province Science Foundation for Youths (Grant No. BK20150712).
Xun Zhang contributed significantly to design the algorithm and wrote the manuscript. Juelong Li contributed to the conception of the study and prepared the manuscript. Jianchun Xing conceived and designed the experiments. Ping Wang performed the experiments and analyzed the data. Liqiang Xie helped perform the analysis with constructive discussions.
