Abstract
Using different tip speed ratios, the near-wake velocity field of a horizontal-axis wind turbine (HAWT) model was simulated. The distributions of the near-wake velocity behind the HAWT rotor are obtained. Furthermore, the development of the wake is shown. The resulting data can be used to identify and better understand the physical attributes of the complex flow field, as well as to aid in the accurate prediction of the HAWT’s performance. Calculations indicate that the axial flow downstream of the near-wake region displays obvious three-dimensional properties. The axial component of air flow velocity is larger than the tangential and radial velocity components. For wind turbines of varying heights, the velocity profiles for each component are similar in the near-wake region. Velocity loss exists downstream of the wind turbine’s near-wake region, decreasing with an increase in axial position downstream of the turbine. The rate of decrease in center velocity is largest at the near-wake region from the trailing edge of the blade to the position of twice the chord length downstream of the turbine. At the position of four times the chord length downstream, the lowest velocity is restored to over 70 % of the free incoming flow velocity.
1. Introduction
Momentum loss occurs when air flows through a rotating wind turbine. A wake area forms downstream of the wind turbine blade. The structure of the wind turbine wake, particularly the component of the wake-type vortex, ultimately reflects the air load on the wind turbine blade [1]. To analyze the aerodynamic load of a wind turbine, we need to calculate the induced velocity at the wind turbine blade accurately. Therefore, an accurate analysis and description of the blade’s wake is crucial to calculating the induced velocity at the blade correctly.
Currently, most methods for analyzing and evaluating horizontal-axis wind turbine (HAWT) performance use over-simplified assumptions [2]. The simplest method is the momentum theory, which considers a wind turbine as a function disk where the distributed induced velocity is evenly distributed. When blade parameters, such as geometrical shape, airfoil section, and tip velocity, changed, the momentum theory is not able to determine the corresponding performance changes. Furthermore, the distribution of the induced velocity on the wind turbine differs considerably from the actual case. Many scholars have found that if the wind turbine blade stalls at high wind speed conditions (high energy output), calculation results based on the currently most widely used blade element/momentum theory (BEMT) differ dramatically from experimental data [3].
On the other hand, several wind turbines are placed together in a wind farm, thus some wind turbines will be located in the wake of others. Wake turbulence structure will affect fatigue loads of downstream wind turbines, thus affecting the performance of wind turbines, decreasing power output, and impacting total wind power output. Therefore, studying wind turbine wake flow will benefit research on the instability mechanism, including static stall and dynamic stall of wind turbines, and improve accuracy in the analysis of wind turbine flow field, load, and aerodynamic characteristics. Potential results include an increase in wind farm efficiency and proper layout of wind turbines [4-7]. From a long-term point of view, there is a need to study the characteristics of the wake flow field of the HAWT, and to develop a more accurate and practical methodology to describe the wind turbine velocity field. However, very little research has been conducted on the characteristics of the wake velocity field of the HAWT.
In the current literature, the studies on wind turbine wakes are limited [8-10]. Agarwal and Deese [11] solved Euler equations of hovering rotor wakes by taking into account the impact of the wake on the blade based on amendments to the section angle. Kroll [12] calculated the Euler equations of hovering rotor flow based on the Euler method. Zervos et al. [13] and Magnusson et al. [14] examined the characteristics of the wake flow of HAWTs based on numerical calculations. Madsen [15] compared the results of the CFD method and the momentum theory. Duque et al. [16] solved the N-S equations of wind turbine flow field using the CFD method and compared these results with actual measured data. Voutsinas et al. [17] studied the wind turbine flow field of yaw movement using the CFD method and found that the calculated blade load is consistent with experimental results. Xu and Sankar [18] proposed a promising method, solving N-S equations in a small region around the turbine based on the CFD method and using the Vortex theory for the rest of the region.
Measurements of conventional mean velocities in wind tunnel studies have been reported by a number of researchers, including Alfredsson et al. [19], Crespo et al. [20], and Grant et al. [21]. Papaconstantinous and Bergeles [22] made conventional measurements of mean velocity and turbulence in the near-wake of a HAWT model for two values of λ. Smith et al. [23] described particle image velocimetry measurements close to rotating blades. Vermeer et al. [24] investigated the aerodynamics of the wakes of HAWTs. Clausen and Wood [25] obtained planar measurements of the three-dimensional flow recorded behind a HAWT model, including the tip vortex, but at one axial location only. Helmis and Papadopoulos et al. [26] focused on the wake structure downwind of an operating wind turbine.
In this paper, we simulated the three-dimensional flow field of the HAWT under stable working conditions using FLUENT software. We obtained the velocity distribution of near-wake velocity fields including the area between rotating blades, and the development pattern of the downstream wake as well as other relevant quantitative information. This information provides the useful references for the accurate calculation of the wind turbine velocity field, load and aerodynamic characteristics.
2. Numerical methods
2.1. Control equations
In the Cartesian coordinate system, the steady-state incompressible three-dimensional Reynolds-averaged Navier–Stokes (RANS) equations include the following.
Continuity equation:
Momentum equation:
where: ui and uj (i, j= 1, 2, 3) are average velocity components; xi and xj (i, j= 1, 2, 3) are coordinate components; P is the average pressure of the fluid; μ is the dynamic viscosity coefficient of the fluid; ρ is the density of the fluid. The term -ρ¯ui'uj' in the momentum equation is called Reynolds stress, indicating the impact of turbulence, and is an unknown variable for viscous flow. To solve the momentum equation, we must establish an appropriate turbulent model to simulate the Reynolds stress term and complete the equation. In this paper, we use the “Realizable k-ε” two-equation turbulence model to solve the viscous turbulence problem. This model can be applied to a variety of flow types, including rotating uniform shear flow, free flow, cavity flow and boundary layer flows.
The turbulent kinetic energy of the “Realizable k-ε” model and its dissipation rate transport equation are given as [27]:
where: C1=max[0.43,η/η+5]; η=Sk/ε; Gk is a turbulent kinetic energy production term caused by the average velocity gradient; Gb is a turbulent kinetic energy term caused by the buoyancy effect; YM is the impact of the compressible turbulent fluctuation expansion on the total dissipation rate; σk is the turbulent Prandtl number of turbulent kinetic energy k; σε is the turbulent Prandtl number of dissipation rate ε; C2 and C1ε are turbulence model constants.
2.2. Geometric modeling
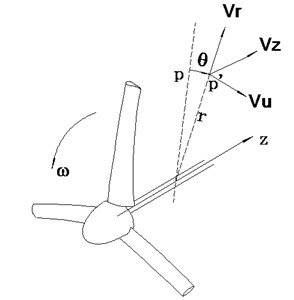
Fig. 1 shows a photo of a HAWT model. The blade shape of the HAWT model is designed in accordance with the NREL S809 airfoil developed by the U.S. Department of Energy (DOE)’s National Renewable Energy Laboratory (NREL) [28]. The diameter of the wind turbine is D=500 mm. The wind turbine has fixed pitch and three blades. The cylindrical coordinate system is used (as shown in Fig. 2). The back side of the installation axis of the blade is the starting point of θ. The blade rotates counter-clockwise, and its positive direction is clockwise. r is the radial distance between the measurement point and the center of shaft axis (m). z refers to the axial position of a point from the blade’s trailing edge downstream of the wind turbine (m).
Fig. 1A photograph of the HAWT model
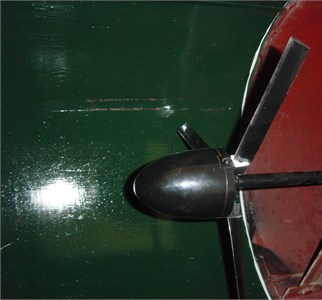
Fig. 2A cylindrical coordinate system of the wind turbine
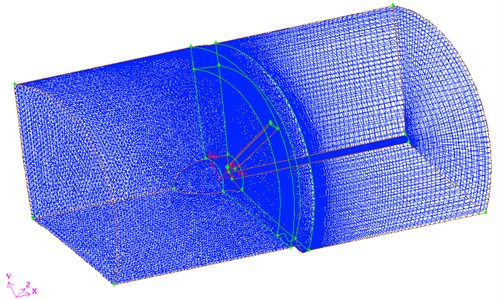
Generally, for an ideal wind turbine, it’s assumed that the air flow in front of an infinite number of blades on the wind turbine is stable axial incoming flow, i.e., the air flow is stable and even on the entire wind turbine surface. The model derived from this assumption is simple and is suitable for pre-evaluation and parameter selection for wind turbine induced flow and wind turbine performance. In this paper, considering the periodic property of the axial incoming flow field, only a third of the flow channel is taken into account as the calculation area (as shown in Fig. 3). The calculation area includes the front extension section, the wind turbine section and the back extension section, the area extending from the cowl forward of the front extension of 2.0D of the axial direction, and the area extending from the wind turbine exit backward of the back extension of the 3.0D of the axial direction. The geometrical model is created using Fluent’s Gambit pre-processing tool. A grid refinement was performed on the blade surface at the top outside the boundary and the place with a large velocity gradient. The mesh for the boundary layers is imposed around the blade surface and the mesh in the vicinity of the blade trailing edge is tightened. The 3D grid is generated with the Pave scheme. The computational grid is shown in Fig. 3. The total number of grids is 352,080.
Fig. 3A three-dimensional grid of the HAWT
2.3. Boundary conditions
The boundary conditions are set as follows. At the import boundary, we set the velocity boundary, give incoming wind speed and direction, and ignore the impact of wind shear. At the export of the flow field, we set the export of pressure and give average static pressure. For the blade and hub surface, we set a rotation static wall and satisfy a no-slip boundary condition. For the top of the outer boundary, we set it as a fixed wall and give the wall shear stress component. For the periodic boundary, the number of wind turbine blades is 3. Considering the periodic calculation of flow field, only one third of the flow channel is considered as the calculation region. Periodic boundary grid points correspond to each other. In calculation involving Multiple Reference Frame (MRF) Model, an inertial reference system is adopted. The coordinate system is fixed to the rotor, and the rotor moves with respect to the stationary surrounding fluid. We use MRF model to couple the continuity equation, momentum equation, energy equation, and k-ε turbulence model equations in the numerical calculations. The equations use implicit format. Coupling between velocity and pressure is implemented by using the SIMPLIC algorithm. The control equations are dissimilated using the finite volume method. Second-order upwind convection is used for the flow item. The wall function is used near the wall area. Convergence criteria are set such that the normalized residuals for each parameter are less than 10-6.
3. Analysis of numerical results
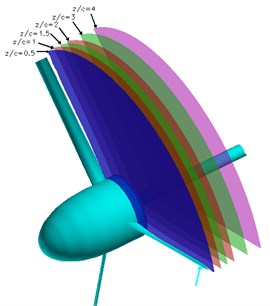
λ is the ratio of the circle speed of the wind turbine blade tip and the wind speed in front of the wind turbine. At different tip speed ratios λ, we simulated the near-wake flow field of a wind turbine. Based on simulation results, we extracted the calculated wake flow field data at different planes downstream of wind turbines that are vertical to the axis (as shown in Fig. 4). The positions of these planes from the blade trailing edge of the axial position range from 0.5c to 20c. Radial positions from the blade root to the blade tip range from 0.3R to 1.1R. Where, c is the chord length of the blade (m) and R is the radius of the wind turbine (m).
Fig. 4Schematic of the planes used for extracting data
3.1. Velocity distribution of a near-wake flow field
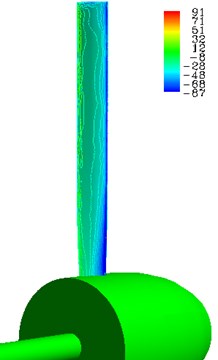
Because of the interaction between air flow and the wind turbine blade, the distribution of flow velocity differs significantly from the wind turbine wake area to the front of the wind turbine. There is an area with significant reduction in Vz and increase in Vθ and Vr. Wind turbine blades rotate counter-clockwise. Vz, Vθ and Vr are, respectively, the axial speed, tangential speed, and radial speed of the average velocity components at a point, in m/s. V is the wind speed at the front axial direction in m/s. Fig. 5 shows the three-dimensional speed distribution of the wind turbine wake at the conditions of λ= 1.0, z/c= 0.5, and r/R=0.6. In Fig. 5, the area with reduced axial speed and velocity loss is the wake flow area of the blade. The distribution curve of the axial speed demonstrates that the wake is asymmetrical, because the S809 airfoil itself is asymmetric, and the thickness on both sides of the boundary layer is not the same in the case of a blade angle. Because of the reduction in the axial velocity Vz, the wake area increases the values of Vθ and Vr. From the analysis of the calculations in Fig. 5, we can see that the axial velocity Vz of the axial flow wake is large. The tangential velocity component Vθ and the radial velocity component Vr are small. The distribution pattern of the axial velocity can reflect the basic characteristics of the near-wake.
Fig. 5Velocity distribution in the wake of the HAWT, λ= 1.0, z/c= 0.5, r/R= 0.6
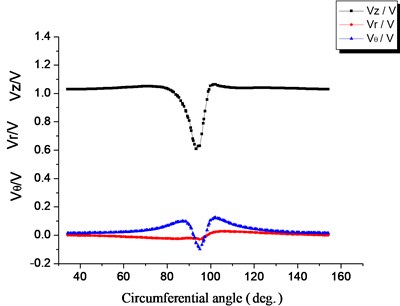
Fig. 6Axial velocity distribution in the wake of the HAWT, λ= 1.0, z/c= 0.5
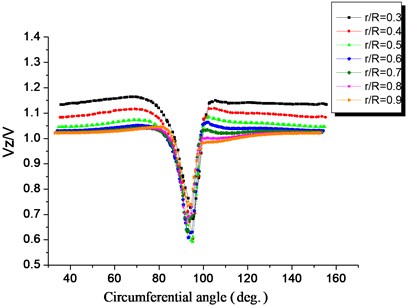
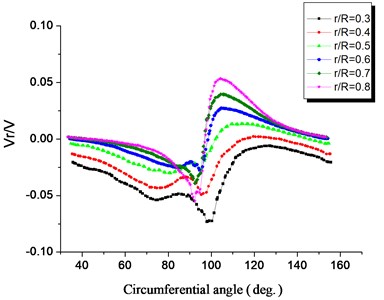
Fig. 6 through Fig. 8 show the velocity distribution of near-wake fields at different blade heights, λ=1.0, z/c=0.5. The velocity patterns of the near-wake field at different blade heights are similar. Compared with free incoming flow, there is a large reduction and loss in Vz. The Vθ and Vr increase near the wake center, and are small at the boundary of the wake field. Vr changes its sign near the center of the wake, indicating that the direction of the radial velocity changes and there is movement with disturbance.
Fig. 7Tangential velocity distribution in the wake of the HAWT, λ= 1.0, z/c= 0.5
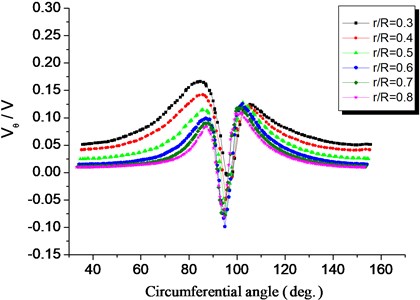
Fig. 8Radial velocity distribution in the wake of the HAWT, λ= 1.0, z/c= 0.5
3.2. Flow and development of near-wake
Fig. 9 shows the development process of the wind turbines’ near-wake field to the downstream flow. After the wake generates at the trailing edge of the blade, it moves downstream with the main flow. The shape of its velocity distribution with respect to the center line of the wake is asymmetrical. Axial velocity loss decreases as the position increases downstream of the wind turbine. When the air flows downstream, the curve formed by the axial velocity loss at the wake becomes smooth, and the velocity loss recovers gradually. At the position of z/c= 0.5, close to the blade, the wake is obvious. The velocity recovers quickly in the wake area. At the position of z/c=2.0, the velocity at the wake is close to the velocity in the non-wake region. The width of the wake increases. The velocity difference from the wake area to the main flow decreases. The velocity variation in the wake area decreases. The wake velocity beyond four times the chord length of the blade gradually approaches the velocity at the non-wake area. The width of the wake does not increase until beyond twenty times the chord length of the blade. It merges with the main flow. The position of the wake center moves along the angular displacement in the opposite direction of wind turbine blade rotation when the wake moves downstream.
Fig. 9The development of the near-wake, λ= 0.3, r/R= 0.6
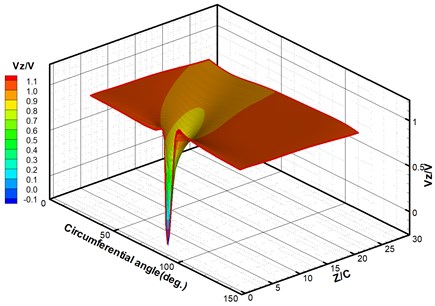
Fig. 10 shows the distribution of axial velocity at different positions downstream of the wind turbine. Based on calculations, we can see that after the wake forms at the trailing edge of the blade, it moves downstream of the main flow. The axial velocity loss decreases with an increase in axial position downstream of the wind turbine. The curves formed by axial velocity loss as the flow moves downstream become smooth. The velocity loss recovers. At the position of z/c=0.5, close to the blade, the wake is obvious. The velocity difference between the wake area and the main flow is dramatic. The width of the wake is small. In the region of z/c=0.5-2.0, the velocity in the wake area recovers quickly. At the position of z/c=0.2, the velocity in the wake area is close to 70 % of the velocity in the non-wake area. The width of the wake increases. The velocity difference between the wake area and the main flow decreases. In the region beyond four times the chord length of the blade, the width of the wake does not increase and instead matches the main flow.
Fig. 10Axial velocity distributions in the wake, λ= 0.3, r/R= 0.6
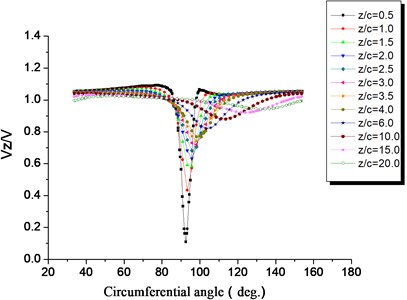
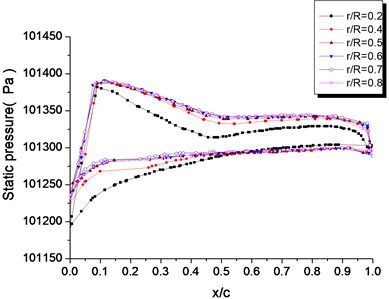
Fig. 11Static pressure distributions on airfoil surface at different sections of the HAWT blade, λ= 0.3
3.3. Blade surface pressure distribution
Fig. 11 shows the static pressure distribution of the wind turbine blade at different blade heights for λ= 0.3. The relative chord length, x/c, is the ratio between the distance x from a certain point at the airfoil surface to the leading edge and the chord length c, as shown in Fig. 12. From Fig. 11 we can see that at different blade heights, the pressure distribution at the pressure side and the suction side is full, and the air flows through the blade with a positive angle. In the region of x/c= 0.05 from the front side to the relative chord length on the blade surface, there is a large negative pressure gradient, along with air deceleration and a pressure increase phenomenon. However, at the suction surface, the pressure changes smoothly. There is a definite difference in pressure distribution between the blade root section, the mid-blade section, and the top-blade section. The pressure at the blade root section is lower.
Fig. 12Schematic of the relative chord length

Fig. 13 and Fig. 14 show the static pressure distribution on the suction surface and the pressure surface, respectively. In addition to the front part of the blade, high pressure surface areas are located at points above 30 % of the blade height. Therefore, the major working area is located at the top 70 % of the blade. The pressure is relatively small at the root of the blade. The pressure contours distribute sparsely. The pressure gradient is small. This is because centripetal acceleration is produced when the air flow on the blade surface rotates with the blade. From the radial balance equation, the centripetal force is provided by a radial static pressure difference. Therefore, the static pressure change is a negative adverse pressure gradient from the root to the top of the blade.
Fig. 13Static pressure distribution on the suction surface of HAWT blade, λ= 0.3
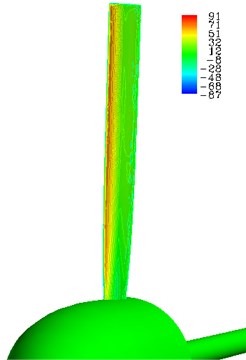
Fig. 14Static pressure distribution on the pressure surface of HAWT blade, λ= 0.3
3.4. Stream lines of the wind turbine flow field
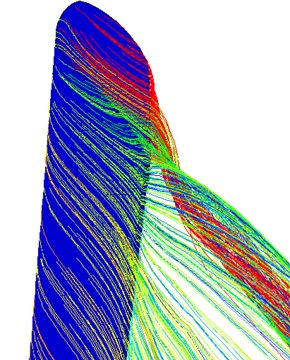
Air flow is affected by wind turbine blades when the air passes through the wind turbine. The angular momentum of air flow increases, thus air flow in the near-wake flow field charges forward as it progresses downstream, forming a spiral trajectory. The rotational direction of the air flow is opposite to the wind turbine’s rotational direction. In addition, we can observe vortex turbulence formed by the pressure surface and the suction surface in the wind turbine vortex as shown in Fig. 15. Calculations show that the Bates theory’s assumption that the velocity direction for an ideal wind turbine is along the turbine’s axial direction differs from actual working conditions of wind turbines.
Fig. 15Stream lines in the nearby flow field of HAWT at λ= 1.0
3.5. Verification of simulation results
To verify the accuracy of our numerical simulation of wind turbine flow fields, we performed hotline measurements using the near-wake flow field of horizontal axis wind turbine models that have the same structure as those used in our numerical simulations [9]. We compared the near-wake flow field speeds obtained in the measurements with the speeds calculated from the numerical simulations to identify the accuracy of the latter.
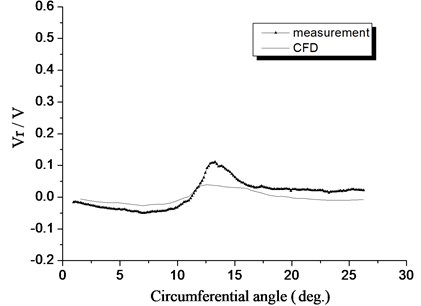
Fig. 16 through Fig. 18 show the three speed component curves comparing measurements against numerical simulations, with the wind wheel speed ratio of λ= 1.0, at half a chord length downstream of the wind turbine, and the radial location r/R=0.7. The numerical simulation results of the axial velocity component at the wake center are lower than the measured values, but the maximum deviation is less than 10 %. For the tangential and radial velocity components, the numerical simulation results near the wake center are notably different from measured values. The reasons are under normal working conditions of the axial flow wind turbine, both the tangential and the radial components of the velocity are very small, and measurement results are very sensitive to the environment. All in all, the results from numerical simulation and from measurement match well. Therefore, it is safe to say that the proposed wind turbine flow field model and method yield high effectiveness, and results come with high accuracy.
Fig. 16Comparison of the computed axial velocity with measurements in the wake, λ= 1.0, z/c= 0.5, r/R= 0.7
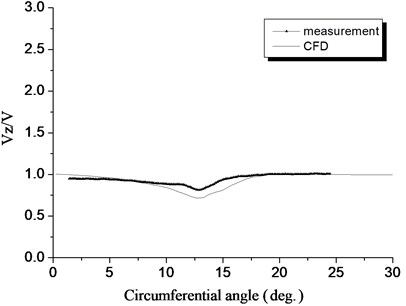
Fig. 17Comparison of the computed tangential velocity with measurements in the wake, λ= 1.0, z/c= 0.5, r/R= 0.7
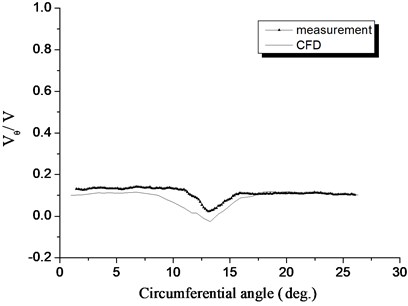
Fig. 18Comparison of the computed radial velocity with measurements in the wake, λ= 1.0, z/c= 0.5, r/R= 0.7
4. Conclusions
1) The axial velocity Vz in the velocity field of a wind wheel makes up most of the velocity component. The tangential velocity component Vθ and the radial velocity component Vr are small. The axial velocity distribution pattern reflects the overall basic pattern of the near-wake region.
2) Patterns for comparable velocity components in the near-wake area of wind turbines of the same height are similar. Compared with free flow, there is significant decrease and loss in Vz. The values of Vθ and Vr at the center line of the near-wake region increase dramatically. The values at the boundary of the near-wake area are small. Vr changes its sign at the center line of the near-wake area.
3) There is a velocity loss in the near-wake field downstream of the wind turbine. As the downstream axial position of the wind turbine increases, the velocity loss reduces, and the resulting wake curve becomes smooth. The trailing wake rate reduces the fastest within the region of twice the chord length downstream of the wind turbine. The minimum speed at the trailing wake center at four times the chord length downstream is restored by more than 70 % of the incoming flow speed.
References
-
Whale J., Anderson C. G. An experimental and numerical study of the vortex structure in the wake of a wind turbine. Journal of Wind Engineering and Industrial Aerodynamics, Vol. 84, Issue 1, 2000, p. 1-21.
-
Ebert P. R., Wood D. H. The near wake of a model horizontal-axis wind turbine. I: Experimental arrangements and initial results. Renewable Energy, Vol. 12, Issue 3, 1997, p. 225-243.
-
Du Z. A 3-D stall-delay model for HAWT performance prediction. I: Theoretical analysis. ACTA Energiae Solaris Sinica, Vol. 20, Issue 4, 1999, p. 392-397.
-
Rasmussen F.,Hansen M. H., Thomsen K., et al. Present status of aeroelasticity of wind turbines. Wind Energy, Vol. 11, 2003, p. 213-228.
-
Gupa S., Leishman G. J. Accuracy of the induced velocity of wind turbine wakes using vortex segmentation. Collection of ASME Wind Energy Symposium Technical Papers AIAA Aerospace Sciences Meeting and Exhibit, 2004, p. 354-367.
-
Kasmia A. E., Masson C. An extended k–ε model for turbulent flow through horizontal-axis wind turbines. Journal of Wind Engineering and Industrial Aerodynamics, Vol. 96, Issue 1, 2008, p. 103-122.
-
Hossain M. Z., Hirahara H., Nonomura Y., et al. The wake structure in a 2D grid installation of the horizontal axis micro wind turbines. Renewable Energy, Vol. 32, Issue 13, 2007, p. 2247-2267.
-
Baker R. W., Walker S. N., Katen P. C. Wake measurements around operating wind turbines. Journal of Solar Energy Engineering, Vol. 107, 1985, p. 183-185.
-
Hogstrom U., Asimakopoulos D. N., Kambezidis H., et al. Field study of the wake behind a 2 MW wind turbine. Atmospheric Environment, Vol. 22, 2009, p. 803-820.
-
Magnusson M. Near-wake behaviour of wind turbines. Journal of Wind Engineering and Industrial Aerodynamics, Vol. 80, 1999, p. 147-167.
-
Agarwal R. K., Deese J. E. Euler calculations for flow field of a helicopter rotor in hover. Journal of Aircraft, Vol. 24, Issue 4, 1987, p. 231-238.
-
Kroll N. Computation of the flow fields of propellers and hovering rotors using Euler equations. Proceedings of the 12nd European Rotorcraft Forum, 1986.
-
Zervo A., Huberson S., Hemon A. Three-dimensional free wake calculation of wind turbine wakes. Journal of Wind Engineering and Industrial Aerodynamics, Vol. 27, Issues 1-3, 1988, p. 65-76.
-
Magnusson M., Rados K. G., Voutsinas S. G. Study of the flow downstream of a wind turbine using measurements and simulations. Wind Engineering, Vol. 20, 1996, p. 389-403.
-
Madsen H. A. A CFD analysis of the actuator disc flow compared with momentum theory results. Proceedings of the 10th IEA Symposium on Aerodynamics of Wind Turbines, Edinburgh, 1996.
-
Duque E. P. N., Van Dam C. P., Hughes S. C. Navier-Stokes simulation of the NREL combined experiment Phase II rotor. Proceedings of the 19th ASME Wind Energy Symposium, 34th AIAA Aerospace Sciences Meeting, Reno, NV, 1999, p. 143-153.
-
Voutsinas S. G., Belessis M. A., Rados K. G. Investigation of the yawed operation of wind turbines by means of a vortex particle method. AGARD-CP-552, Proceedings Aerodynamics and Aeroacoustics of Rotorcraft, 1994.
-
Xu G., Sankar L. N. Computational study of horizontal axis wind turbines. Proceedings of the 19th ASME Wind Energy Symposium, 34th AIAA Aerospace Sciences Meeting, Reno, NV, 1999, p. 192-199.
-
Alfredsson P. H., Dahlberg J. A., Vermeulen P. E. J. Comparison between predicted and measured data from wind turbine wakes. Wind Engineering, Vol. 6, 1982, p. 149-155.
-
Crespo A., Hernandez J., Fraga E., et al. Experimental validation of the UPM computer code to calculate wind turbine wakes and comparison with other models. Journal of Wind Engineering and Industrial Aerodynamics, Vol. 27, 1987, p. 77-88.
-
Grant I., Mo M., Pan X., et al. Experimental and numerical study of the vortex filaments in the wake of an operational, horizontal-axis, wind turbine. Journal of Wind Engineering and Industrial Aerodynamics, Vol. 85, 2000, p. 177-189.
-
Papaconstantinous A., Bergeles G. Hot-wire measurements of the flowfield in the vicinity of a HAWG rotor. Journal of Wind Engineering and Industrial Aerodynamics, Vol. 31, 1988, p. 133-146.
-
Smith G. H., Grant I., Liu A., et al. Wind tunnel application of particle image velocimetry to the measurement of flow over a wind turbine. Wind Engineering, Vol. 15, 1991, p. 301-317.
-
Vermeer L. J., Sorensen J. N., Crespo A. Wind turbine wake aerodynamics. Progress in Aerospace Sciences, Vol. 39, 2003, p. 467-510.
-
Clausen P. D., Wood D. H. Experimental investigation of blade element theory for wind turbines. Part 2. phase-locked averaged results. Journal of Wind Engineering and Industrial Aerodynamics, Vol. 31, 1988, p. 305-322.
-
Helmis C. G., Papadopoulos K. H., Asimakopoulos D. N. P., et al. An experimental study of the near-wake structure of a wind turbine operating over complex terrain. Solar Energy, Vol. 54, 1995, p. 413-428.
-
Fluent 6.2 Documentation: User’s Guide. Fluent Inc., 2005.
-
Somers D. M. Design and Experimental Results for the S809 Airfoil. NREL/SR-440-6918, UC Category: 1213-DE 97000206.
About this article
The support of the National Science Foundation of China under Project No. 50706025 is gratefully acknowledged.
