Abstract
In order to elucidate the effects of the features of horizontal curves on the steering behavior of passenger car, the vehicle driving behavior when negotiating simple curves (tangent + circular section + tangent) was investigated. A complete dynamic model of a passenger car was developed using the Automatic Dynamic Analysis of Mechanical Systems (ADAMS) software. Virtual driving tests were conducted on simple curves with different parameters for two driving patterns: curve cutting and lane keeping. Based on the variation in the amplitude of the angle input of the steering wheel, the steering process of a passenger car was divided into three stages: curve entry, maintenance, and curve exit. The steering lengths and steering times corresponding to the vehicle entering, remaining in, and exiting curves were obtained for each driving pattern. The relationship between the two parameters and the curve radius as well as that between the two parameters and the deflection angle was thus determined. On the one hand, this study can be a guide for selecting the parameters for curve geometry design and, in particular, for determining an appropriate value of the spiral length. On the other hand, the correspondence between the steering wheel angle and the trajectory curvature should allow one to identify the three driving states, namely, straight driving, variable-curvature driving, and circular-curve driving. This should help in improving driver behavior and hence driving safety.
1. Introduction
It is becoming increasingly apparent that having an in-depth understanding of the steering behavior as well as the vehicle driving process on highways and, in particular, on the curved segments, can help improve the quality of highway design and hence the safety level. For example, based on the dynamic response of the vehicle and the driver’s input, designers can measure and analyze the driving safety and comfort levels as well as the workload for a given highway alignment. Further, they can determine the degree of coadaptation between the highway design, vehicle characteristics, and driver behavior [1, 2]. Therefore, inconsistent or erroneous geometric roadway elements (or their locations) can be identified, and the necessary improvements required in the alignment design can be made by the engineer, allowing for user-friendly and safe roadways.
Researchers have investigated the driving behavior on curves based on the vehicle trajectory and speed. By using simulations, Lin [3] showed that increasing the curve radius and the length of the transition section would lead to a reduction in the error in trajectory tracking. Xu [4] suggested that, for curves with small radii, a spiral can cause a decrease in the trajectory curvature, resulting in an improvement in the curve-negotiating speed. By investigating the topological characteristics of the trajectory of passenger cars, Spacek [5] found that the curve-cutting pattern accounts for the majority of the direction-control behavior, while the ideal driving pattern, in which the path is strictly at the center of the traffic lane occupies the least proportion. An analysis by Perco indicated that an excessively long spiral can lead to difficulties in trajectory control. To solve this problem, he proposed a model for the ideal spiral length [6]. In these aforementioned studies, the curves involved were mostly of the basic type, namely, those with a “tangent 1 + spiral 1 + circular section + spiral 2 + tangent 2” nature.
In the real world, simple curves (tangent 1 + circular section + tangent 2) are used widely in the design of the horizontal alignments of rural roads and urban streets. The curvature of a horizontal alignment experiences a sharp variation at the junction between the straight and circular sections. Consequently, the driver needs to start steering on the straight section in advance before entering the curve. Further, the steering action must be maintained into the circular section. During this process, the trajectory curvature increases gradually from 0 to 1/, where denotes the radius of the curve. As a result, the change in the curvature at the point of entry into the circular section is negotiated automatically by the moving vehicle, since modern vehicles are time-delayed, nonlinear, and rigid-flexible coupling systems [7]. However, the response of a vehicle with these dynamic characteristics when driven in different patterns in response to changes in the geometric features of a simple curve remains unclear. Further, the following questions remain to be answered: when and where does the driver’s steering action start and stop? How long is the steering process while entering or existing a curve, and what are the corresponding respective steering lengths? Although these parameters can be determined from the steering angle input profile obtained from closed-loop simulation tests of the stability and handling characteristics, most existing researches focus on the lane-changing behavior, which differs widely from that corresponding to actual driving on the curved segments of a highway [8, 9]. Besides, the negotiating speeds chosen by the driver at curve entry would vary when straight sections connecting to circular sections of different radii owing to the difference in the curvature at the point from the tangent to the circular section would also change. In such cases, how does the steering behavior change with changes in the curve radii and other geometrical features? So far, these questions remain unanswered.
Therefore, in this study, by using virtual driving simulation technology, we obtained the following parameters for a passenger car steering along a simple curve under different driving patterns: the vehicle trajectory, displacement, and steering wheel angle. Based on these parameters, the steering length and steering time corresponding to the vehicle entering and exiting a horizontal curve were determined. Moreover, the relationships between the two parameters and the geometric features of the curves, the vehicle size, and the driver behavior were analyzed. The results of this study should help designers design horizontal alignments expected by the driver, thus improving the geometric design quality of highways. In addition, the results should help in controlling the spiral length. As indicated by Perco [6], if a spiral is used for design alignments, its length should be equal to the trajectory length corresponding to the vehicle steering time, as illustrated in Fig. 1, where and are the lengths of the first and second spirals, respectively. In this manner, the driver can negotiate the spiral on the basis of a habitual angle input to the steering wheel. As a result, the spiral length would be preferred by drivers and thus obviously satisfy their psychological needs.
Fig. 1Inserting a spiral with a length equal to the steering distance between the circular section and the tangent

2. Method
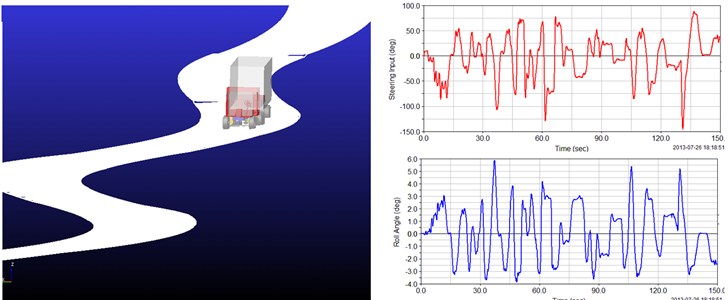
The method employed in this study to conduct driving tests on horizontal curves involved the co-simulation of the driver-vehicle-road (environment) interactions, as shown in Fig. 2. In this study, we mainly focused on the vehicle steering behavior. Therefore, it was important to simulate the drivers’ direction control behavior. The differences in the direction control behavior corresponding to different patterns are inevitably reflected in the variations in the trajectory characteristics. Hence, based on the trajectory characteristics related to different curves, the direction control behavior of the drivers can be categorized into different driving patterns. Out of these defined driving patterns, curve cutting and lane keeping were selected as the representative driving patterns to establish the corresponding trajectory decision models. Once the coordinates of the edges of the test curves have been obtained, the trajectory model can determine the target trajectory corresponding to the selected driving pattern within the driving width. Then, the speed model can be used to forecast the target speed through the curves.
Fig. 2Virtual driving system used for simulating “driver-vehicle-road” interactions on mountain highways
Multi-body dynamics allow for dynamics and kinematics analyses of the motion of a vehicle as a set of interconnected rigid and deformable components. The Automatic Dynamic Analysis of Mechanical Systems (ADAMS) software, which was initially developed by the Mechanical Dynamics, Inc. and then acquired by McNeill Schindler Corp., is one of the most effective tools available for computational simulations of multi-body dynamics [10]. The Car module of ADAMS, named ADAMS/Car, is specifically designed for vehicle driving simulations and hence was chosen for this study. Later, using ADAMS/Car, a nonlinear dynamic model for a passenger car was established and used to track the target trajectory and speed. Meanwhile, the trajectory, displacement, steering wheel input, and speed during the driving process were recorded to analyze the driving behavior. Fig. 3 illustrates the inner workings and underlying process of the “driver-vehicle-road” simulation system; here, denotes the current moment and denotes the preview time. Further, the “ADAMS/Solver is the module used to solve the equations of motion for the kinematics and dynamics simulations.
2.1. Test curves and three-dimensional (3D) modelling
The test curves used in this study had the form “tangent 1 + circular section + tangent 2” and the test variables were the curve radius, , and the deflection angle, . Since the minimum length of a horizontal curve is specified in the current road design specification, the minimum allowable deflection angle for a horizontal curve increases with a decrease in . Table 1 lists the range of for the different curve radii of the test bends. In addition, a tangent with a length of 200-300 m was laid out before and after the circular section. The super-elevations were set based on Chinese design specifications for highway alignments [11], while the longitudinal axis of the horizontal curves was taken as the rotating axis of the super-elevations.
Table 1Geometric parameters of test bends
of bend (m) | of bend with radius of (o) | of bend (m) | of bend with radius of (o) |
25 | 80, 90, 110 | 300 | 10, 15, 20, 30, 40, 60 |
40 | 50, 60, 70, 90, 110 | 330 | 7, 12, 20, 30, 40, 60 |
60 | 30, 40, 50, 70, 90 | 360 | 7, 12, 20, 30, 40, 60 |
80 | 30, 40, 50, 70, 90 | 390 | 7, 12, 20, 30, 40, 60 |
100 | 20, 30, 40, 50, 60, 80 | 420 | 5, 10, 17, 25, 35, 50 |
125 | 20, 30, 40, 50, 60, 80 | 450 | 5, 10, 17, 25, 35, 50 |
150 | 15, 22, 30, 40, 50, 70 | 480 | 5, 10, 17, 25, 35, 50 |
175 | 15, 22, 30, 40, 50, 70 | 520 | 5, 10, 17, 25, 35, 50 |
200 | 15, 22, 30, 40, 50, 70 | 560 | 5, 10, 17, 25, 35, 50 |
225 | 10, 15, 20, 30, 40, 60 | 600 | 5, 10, 17, 25, 35, 50 |
250 | 10, 15, 20, 30, 40, 60 | 650 | 4, 8, 12, 20, 35 |
270 | 10, 15, 20, 30, 40, 60 | – | – |
Fig. 3Inner workings and underlying process of the “driver-vehicle-road” simulation system
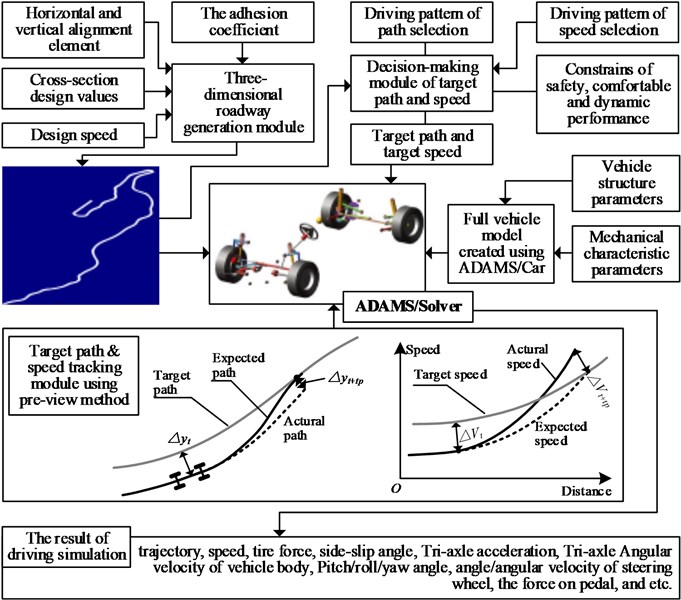
Through the steps listed below, a 3D pavement model that could be used with the ADAMS software and could interact with the tire model was obtained:
(1) Based on the curve radius, deflection angle, and lengths of tangents 1 and 2, the plane coordinates (, ) of each stake are calculated at a predetermined spacing.
(2) Based on the vertical alignment parameters, the elevation of each stake () is calculated. After the spatial coordinates (, , ) have been determined, all the stakes are linked one by one to obtain the spatial positions of the centerline of the test road.
(3) The normal direction of each stake is determined, and a translation 0.5-times the pavement width is performed towards the two sides of the pavement. This yields the initial positions of the edge lines of the road.
(4) The elevation values of the edge lines on each side are corrected based on the form and grade of the camber. If super-elevations are set on the curves, the elevations of the edge lines within the sections with the super-elevations as well as the super-elevation transition sections must be modified.
(5) The coordinates of the nodes of the road surface (centerline and edge lines) are numbered sequentially, and the form is established.
(6) Based on predefined regulations, three adjacent nodes are used to form a road-surface element. This step is performed until all such elements are obtained.
(7) Each pavement element has an independent adhesion coefficient (0.55 here).
The 3D view of two curvy roadway model for a length of approximately 260 m and 3900 m are shown in Fig. 2 and Fig. 3 (the white band-shaped surface), obtained using the aforementioned steps.
2.2. Nonlinear dynamic model of test vehicles
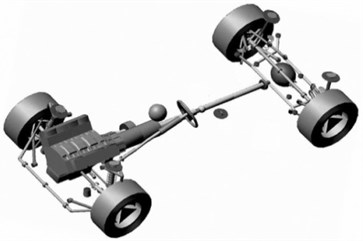
Passenger cars, trucks, and buses are three common types of vehicles seen on highways. We selected a passenger car as the test vehicle because, compared to trucks and buses, passenger cars have higher speeds and have a greater effect on the design of horizontal alignments. The nonlinear dynamic model of the passenger car used in this study was established using the ADAMS/Car software and is shown in Fig. 4. To run a driving simulation using ADAMS/Car, it is necessary to specify most of the components or subsystems that form the complete car. Each of the subsystems has to be characterized. The sub-systems that have a significant effect on the driving performance are the suspension, steering, and braking system; the body or chassis; and the tires and the power train [12]. The complete car model used in this study contained two double-wishbone suspensions, a rack and pinion steering gear, a trapezoid steering mechanism, four hydraulic caliper-disc brakes, and a powertrain (disconnected drive axle and two swing half-shafts). The tire model used was MF-Swift, a version of the Magic Formula proposed by Pacejka [13]. The other key components such as the dampers and springs were defined based on statistical data from actual tests, in order to improve the accuracy of the model. The main size-related parameters of this vehicle were as follows: wheelbase of 2575 mm, front tread of 1562 mm, rear tread of 1596 mm, no-load vehicle weight of 1180 kg, and no-load height of center of gravity of 590 mm. Therefore, the vehicle model was a nonlinear one and involved rigid-flexible coupling, and the results of the simulations could be used to approximate real-word driving. The vehicle model, driver module and roadway module were integrated with a “driver-vehicle-roadway” system and used to evaluate the driving behavior under different conditions and on different roads.
Fig. 4A nonlinear dynamic model of a passenger car
2.3. Direction control when travelling on horizontal curves
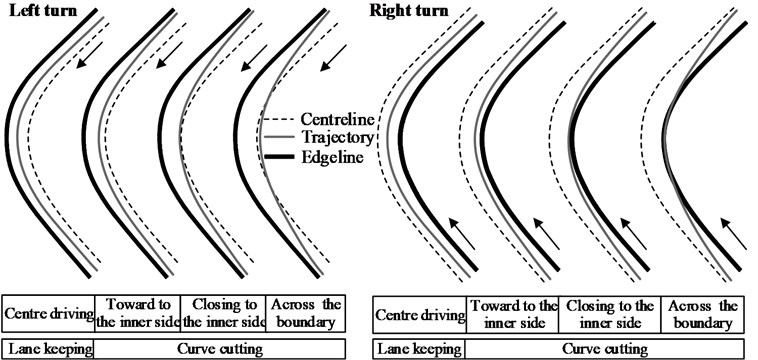
The initial purpose and final results corresponding to a driver’s direction control behavior are all reflected in the trajectory of his/her car. Current lane widths generally range from 3.25 m to 3.75 m, with the shoulder being 0.25 to 1.5 m in width on the two sides of the pavement. Most drivers tend to occupy 0.5–0.75 m of the opposite lane on rural two-lane roads. That is to say, the width that the driver can actually use is between 4 to 6 m. However, the width of a passenger car is usually less than 1.95 m and the extra driving width available can be twice that. As a result, when entering a curve, the driver is required to make a decision regarding their desired trajectory within the driving width first and then track it. The trajectories recorded on curved segments indicate that only a few drivers can keep their vehicles in the center of the traffic lane, with most drivers tending to steer their vehicles towards the inner side of the curve. That is to say, most drivers in curve cutting. Based on the topological relationship between the vehicle trajectory and the road centerlines/edge lines, the direction control behavior on curves can be categorized into four types, as shown in Fig. 5.
The first driving pattern in Fig. 5 is center driving (lane keeping), while the other three correspond to curve cutting to different degrees. For a left turn, cutting across the road centerlines is taken to be the most extreme form of cutting; in this situation, the driver occupies the opposite lane. In case of a right turn, the most extreme form of cutting is when the vehicle encroaches onto the hard shoulder of the right side. Therefore, direction control on curves can be categorized into two major types: lane keeping and curve cutting. The trajectory-tracking model used in this study was based on the “multipoint preview” algorithm developed by Sharp [14]. The sections that follow primarily describe the trajectory-related decision making process corresponding to the two driving patterns, namely, curve cutting and lane keeping.
Fig. 5Four typical driving patterns of direction control
2.3.1. Simulation of curve cutting
When negotiating a curve, the driver resorts to curve cutting to reduce the trajectory curvature. This allows for the following advantages: first, the curve negotiation speed is increased without having to change the lateral comfort level; second, the lateral acceleration can be decreased while maintaining the previous speed, thus also improving the driving comfort; third, the difference in the speeds when entering and exiting the curve can be decreased and the braking and acceleration of the vehicle prevented.
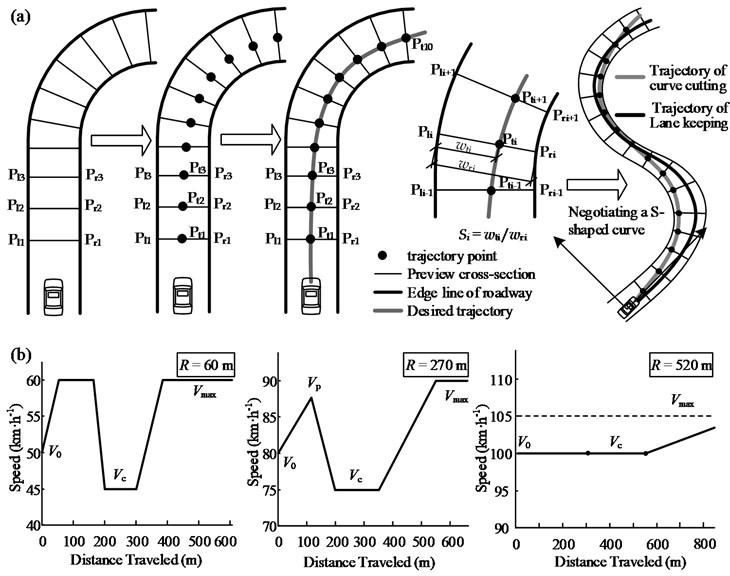
Based on the strategy of “selecting a trajectory point on the preview cross-section,” we employed the rolling horizon method to determine the desired trajectory within the pavement width that can be used by the driver [15], as shown in Fig. 6(a). The preview cross-sections are divided within the visible region of the road ahead at certain spacings, and each cross-section serves as a set of potential trajectory points. With the road design data already known, the coordinates of each cross-section’s two endpoints can be determined through analytical calculations. Under this condition, if the proportionality coefficient, , is calculated, the unique position of the trajectory point, , can be determined. Hence, the trajectory decision can be considered the process of optimizing the decision variable, .
The aforementioned analysis of the curve-cutting behavior indicated that lowering the trajectory curvature as much as possible can be taken to be the decision goal of curve cutting. The calculations involved have been described in detail elsewhere [15]. In this study, the pavement width that could be used by the driver was set to 5 m; this included 3.75 m of the traffic lane, 0.75 m of the hard shoulder, and another 0.5 m arising because of the occupation of the opposite lane.
2.3.2. Simulation of lane keeping
Since center driving is simulated during lane keeping, minimizing the lateral deviation of the trajectory can be taken as the objective. Here, the lateral deviation refers to the lateral distance between the trajectory point and the centerline of the driving way.
2.3.3. Realization of simulation
After the trajectory point coordinates have been determined, they are transformed into the form and saved as a data file for analysis by the ADAMS software. During the driving process, the “multipoint preview” strategy is used in the direction control module to track the target trajectory. Meanwhile, the steering wheel angle input at each moment is calculated. However, it is effective only when the lateral deviation exceeds the allowed values. The allowed unilateral value of the lateral deviation is set to between m and 0.4 m here; smaller values correspond to lower speeds and vice versa.
Fig. 6a) Strategy for “selecting a trajectory point on preview cross-sections” and b) target speed when negotiating a curve
2.4. Speed control on curves
Lauffenburger’s research indicates that driving safety and comfort play primary roles in the driver’s speed selection behavior around curves. Both factors can be measured using the driver’s lateral allowable acceleration, [16]. Hence, is adopted here to control the curve-negotiating speed, . The decrease in speed upon curve entry is controlled by the braking deceleration, , while the speed increase upon curve exit is controlled by the longitudinal acceleration, . Further, the speed on tangents and curves with large radii is controlled by the maximum travel speed, , as shown in Fig. 6(b).
In this study, speed measurements performed on mountain highways of southwest China indicated that , , and are not fixed but decrease with an increase in the curve radius [17, 18]. Table 2 lists the values of these parameters for different curve radii. in Table 2 depends on the width of the curved segment and the curvature change rate, . When the road width is constant, larger curve radii and smaller values indicate a larger . However, when the curve radius is large enough, depends on the road width. Based on the results observed on highways, the value of for a two-lane highway was set at 110 km/h. The principle used for setting the initial simulation speed, , is as follows: the complete acceleration and deceleration of the vehicle can be ensured on the tangent before the curve. Meanwhile, the differences between and and that between and are controlled to be less than 10 km/h.
Table 2Values of speed-control parameters
Radius of test bends (m) | (m/s2) | (m/s2) | (km/h) | (km/h) |
25 | 2.2/0.85 | 2.878 | 50 | 60 |
40 | 2.2/0.85 | 2.714 | 50 | 60 |
60 | 2.2/0.85 | 2.522 | 50 | 60 |
80 | 1.9/0.7 | 2.358 | 60 | 70 |
100 | 1.6/0.6 | 2.219 | 60 | 70 |
125 | 1.6/0.6 | 2.073 | 60 | 70 |
150 | 1.3/0.45 | 2.152 | 70 | 80 |
175 | 1.3/0.45 | 1.854 | 70 | 80 |
200 | 1.3/0.45 | 1.773 | 70 | 80 |
225 | 1.0/0.35 | 1.706 | 80 | 90 |
250 | 1.0/0.35 | 1.651 | 80 | 90 |
270 | 1.0/0.35 | 1.606 | 80 | 90 |
300 | 0.7/0.225 | 1.569 | 90 | 100 |
330 | 0.7/0.225 | 1.534 | 90 | 100 |
360 | 0.7/0.225 | 1.504 | 90 | 100 |
390 | 0.4/0.18 | 1.478 | 90 | 100 |
420 | 0.4/0.18 | 1.453 | 95 | 105 |
450 | 0.4/0.18 | 1.43 | 95 | 105 |
480 | 0.4/0.18 | 1.409 | 95 | 105 |
520 | 0.1/0.05 | 1.390 | 95 | 105 |
560 | 0.1/0.05 | 1.373 | 100 | 110 |
600 | 0.0/0.05 | 1.358 | 100 | 110 |
650 | 0.00/0.0 | 1.340 | 100 | 110 |
3. Validating the simulation system
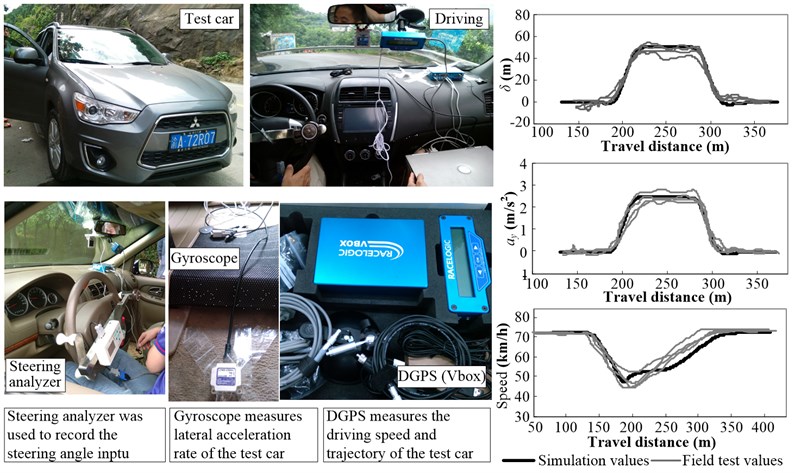
The vehicle driving test for the two driving patterns was conducted on a curve with a radius of 65 m and a deflection angle of 90°. During lane keeping, the driver was required to engage in center driving on the traffic lane, while during curve cutting, the driver was allowed to make use of the entire pavement width. During curve cutting, the maximum speed before and after the curve was limited to 70 km/h, while that within the curve could be selected by the driver. Meanwhile, the following three parameters were chosen as the evaluation indices: the angle input of the steering wheel, ; the lateral acceleration, ; and the driving speed. The field test results were in good agreement with those of the simulations, as shown in Fig. 7, indicating that the aforementioned model was a sufficiently accurate one.
4. Results
The results of a previous analysis showed that the trajectory radius corresponding to lane keeping is approximately equal to the design radius of the curve. However, owing to the trajectory moving towards the inner side of the curve, the trajectory radius increases in the case of curve cutting, with a larger offset of the trajectory indicating a more significant increase in the trajectory radius. Therefore, in the case of the four behavior patterns shown in Fig. 5, the trajectory corresponding to lane keeping had the smallest radius, while the trajectory corresponding to the last pattern had the largest. The aim of this study was to determine the upper and lower boundary of the driving parameters for different driving patterns. Therefore, lane keeping and the last curve-cutting pattern were employed as the direction control patterns for the driving simulations.
Fig. 7Simulation values and experimental test results
4.1. Three stages of steering behavior
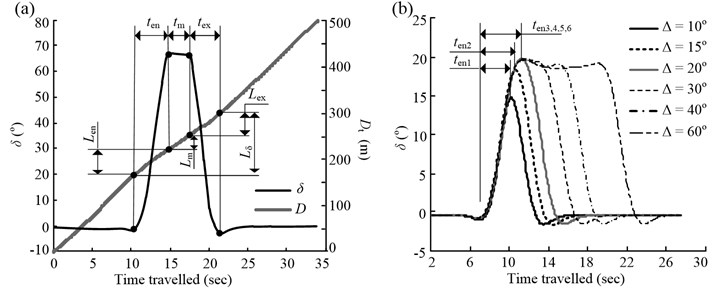
Fig. 8(a) shows the time history of the steering wheel angle input for a vehicle travelling on a curve with a radius of 60 m and deflection angle of 70°. Based on the change in (see Fig. 8(a)), the steering behavior could be divided into three stages: adjustment of angle input upon entering the curve, maintenance of angle input while in the curve, and returning angle input to original value upon exiting the curve. These three stages correspond to the steering time for curve entering, ; the steering maintenance time, ; and the steering time for curve exiting, , respectively. Based on the superposition of the profile of the distance travelled, , and that of , the lengths the vehicle travelled during the three stages could be determined. These were the steering length when entering the curve, ; the steering maintenance length, ; and the steering length when exiting the curve, , respectively. The relationship between these lengths can be defined as follows:
In Eq. (1), denotes the driving time on the curve; during this time, the steering wheel deviates from the middle position, and represents the length traveled by the vehicle during time .
Fig. 8a) Determination of the steering time and steering lengths and b) steering wheel angle input corresponding to the entry of the vehicle into the curve
4.2. Effect of change in curve deflection angle on steering time/length
Currently, road and vehicle designers generally believe that, when a vehicle negotiates a curve, the required depends on the radius of the curve, the tread, and the negotiating speed; however, the relationships between and the deflection angle of the curve remain unknown. Meanwhile, during actual driving on highways, when driving through small-deflection-angle curves, it is common for the drivers to feel that the steering wheel angle input is smaller for curves with smaller deflection angle. That is to say, steering on curves with smaller deflection angles is easier than that on curves with larger deflection angles.
Fig. 8(b) shows the -time profiles for a vehicle traveling along a set of curves ( 225 m, is a test variable) while engaging in curve cutting. It can be seen from the figure that not only does the amplitude of the angle input of the steering wheel decrease, but the steering time also decreases with a decrease in . This is the reason for drivers finding steering on curves with small deflection angles easier. Moreover, is not an essential parameter for all the curves. For example, when the deflection angle is 10-20°, once the maximum value of has been experienced, the increase in is reversed without a maintenance stage being required. Meanwhile, it can be seen that there is a critical deflection angle, , such that only when the deflection angle is lower than can and vary along with . When the deflection angle is higher than , and are no longer influenced by . That is to say, is the angle at which and become stable. According to this definition, the value in Fig. 8(b) should be 20°.
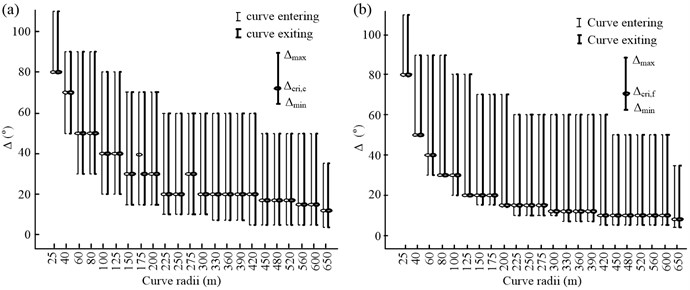
Using the procedure illustrated in Fig. 8(b), the critical deflection angles for the other 22 groups of curves could also be determined, as shown in Fig. 9. The statistical software SPSS19.0 was used to analyze the test results. The range [, ], that is, the column height, denotes the range of the deflection angle for the curves in this group. The range [, ] refers to the range of the deflection angle that can affect the steering behavior, and which is 10-20° for the example shown in Fig. 8(b).
Based on Fig. 9, the following conclusions can be drawn: First, generally speaking, and [, ] decrease with an increase in the curve radius. That is to say, for curves with smaller radii, the deflection angle has a greater effect on the steering behavior. Second, for curves with the same radius, the critical deflection angle corresponding to curve cutting, , is significantly higher than that for lane keeping, . Hence, , which indicates that the driver’s steering behavior during curve cutting is more readily affected by .
Fig. 9Relationship between Δcri and the curve radius: a) curve cutting was adopted and b) lane keeping was adopted
4.3. Steering lengths during curve entry and exit stages
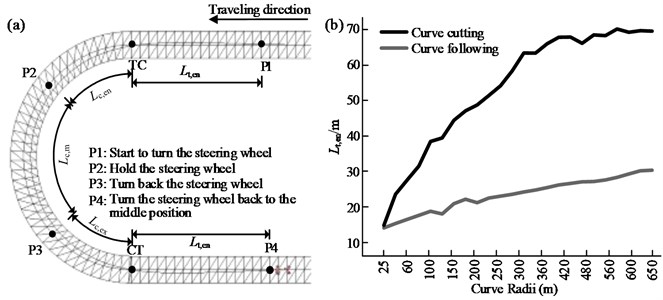
Fig. 10 shows the change in the trajectory curvature for a vehicle traveling on a curve with a radius of 125 m and deflection angle of 60°. By viewing the curvature of the trajectory and that of the road centerline, the topological relationship between the steering feature points and the curve geometry can be obtained. This obviously indicates that, although the curvature of the road centerline shows a sharp variation at the point of change from a tangent to a circular section (TC), the trajectory curvature increases gradually from 0 to 1/ within the steering length, . And the manner of curvature decrease for curve exiting is similar to curve entry. It is in the steering length that the lateral acceleration of the vehicle, the lateral force, and the yaw rate change from those corresponding to rectilinear motion to curvilinear motion. Therefore, and are the parameters to which researchers have paid most heed.
Using the method mentioned in Section 4.1, the steering lengths for the 23 groups of test curves were determined, as shown in Figs. 11(a)-(b); here, the low value for each column denotes the steering length of the curve with the smallest defection angle in that group, while the high value represents the maximum steering length in that group of curves. However, the deflection angle of the curve corresponding to the maximum steering length is likely to be the maximum test angle or one of the other angles greater than . From the two figures, the following information can be obtained:
First, when curve cutting is adopted by the driver, the steering length for curve entry and that for curve exiting exhibit no significant difference in the radius range 25-650 m. However, when lane keeping is adopted, the range of the steering length for curve entry is larger than that for curve exiting. Second, the steering length for curve cutting is significantly larger than that for lane keeping. This indicates that, during curve cutting, the driver starts steering earlier on the straight line before the curve and steers for longer on the curve. Third, the heights of the columns in the figure represent the range of the steering length for . Thus, the column height can be used to measure the sensitivity of the steering behavior to Δ. Based on the column height distribution for the different radii, it can be inferred that the larger the radius, the more sensitive the steering behavior is to . Further, when [300 m, 450 m], the sensitivity is the highest while the driver cutting the curve.
For each group of test curves, the arithmetic mean was used for the steering lengths in the case where ; this was called the stable steering length, . It can be seen from Fig. 11(c) that increases with an increase in . However, when is 560-600 m, tends to remain constant. Further, when is equal or greater than 200 m, for curve cutting is generally twice that for lane keeping.
Fig. 10a) Trajectory curvature for a vehicle negotiating a curve and b) further decomposition of the steering behavior
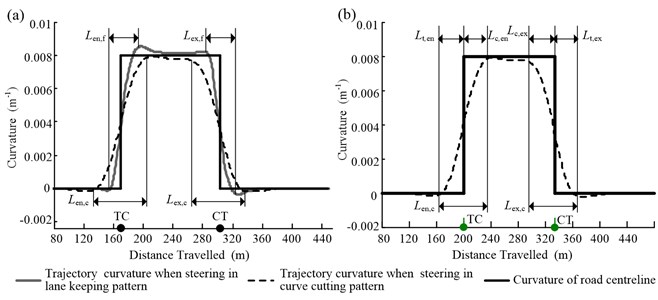
Fig. 11Steering lengths for a vehicle entering and exiting curves: a) curve cutting, b) lane keeping (curve following), c) stable steering lengths for the two driving patterns, and d) the smoothed profiles of the stable steering lengths
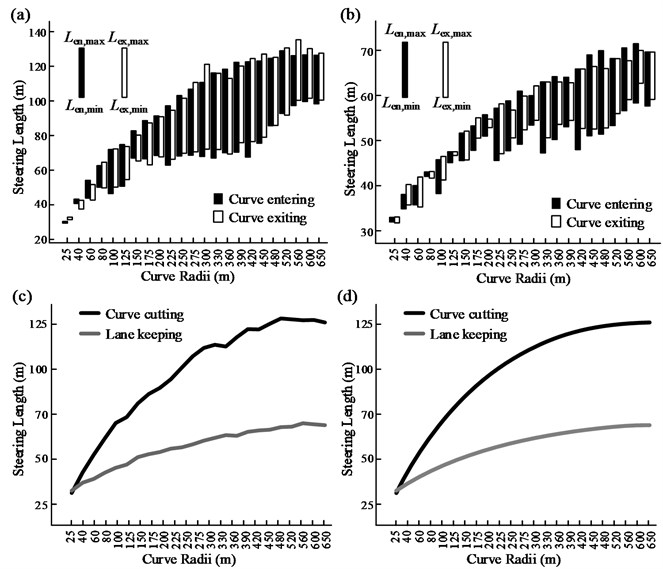
The profile of versus plays a significant role, in that it can be used as a control when designing the spiral length. This is because previous studies have indicated that the spiral is an unsafe alignment element and can lead to misjudgments on the part of the driver. If it must be layout, its length should be equal to the distance the vehicle travels within the steering time [6]. In Fig. 11(d), the profile corresponding to the curve-cutting pattern can be taken as the upper bound of the spiral length, while that corresponding to the lane-keeping pattern can serve as its lower bound. Hence, if the spiral length is taken such that it falls within the area formed by the two profiles, both driving habits (curve cutting and lane keeping) can be taken into account to a certain extent. It can be seen from the figure that the larger the curve radii, the longer the spiral length required. This meets the requirement for the spiral length in the design policies of France. Whereas, a few European countries such as Germany, Sweden, and Switzerland, require that the spiral length should increase with a decrease in the curve radius [19]. However, an investigation by Stewart [20] indicated that the use of too gradual a spiral in sharp curves can lead an underestimation of the bend curvature, thus increasing the risks associated with the curves.
4.4. Steering times in curve entry and exit stages
Fig. 12(a)-(b) show the steering times for all 23 groups of curves, with the column heights denoting the range of the steering time for . The steering time in the two driving patterns presents entirely different variation trends. During curve cutting, the steering time shows a convex peak when is approximately 300 m, while during lane keeping, the steering time decreases consistently with the increase in ; this is because, during lane keeping, the road centerline is taken as the target trajectory, and the vehicle driving process is similar to that during a step angle input test (i.e., one corresponding to a transition from straight driving to driving in a circle with a fixed radius) when analyzing the stability and handling characteristics. In this situation, a larger circular curve radius leads to the curvature difference that needs to be overcome in the steering stage to be smaller. As a result, the need for the angular deflection of the front tires is reduced and the steering wheel angle input is decreased accordingly. However, in the case of curve cutting, the driver can determine a trajectory within the available pavement width. The fact that the curve radius is larger and the travel distance longer indicates that the driver can adjust the trajectory within a larger range. Therefore, under these conditions, the steering time is influenced by both factors, namely, the curvature difference and the adjustable length.
In addition, the steering time is influenced more readily by during curve cutting; this is similar to the case for the steering length. For instance, when [300 m, 450 m], the difference between the maximum and minimum steering times for curve cutting is more than 2 s, while that in the case of lane keeping is only 0.55 s.
Fig. 12(c) shows the profile of the stable steering time, , corresponding to the aforementioned . This profile can also be used to control the spiral length because, according to the specifications used in some countries, including Belgium, the United States, and China, the spiral length is expected to be equal or greater than the product of and , where represents the design speed [11, 19]. Thus, the intermediate region of the two profiles can be taken as the range for the steering time. To simplify the calculation, the steering time is assumed to be constant in many alignment design specifications. Here, the value proposed in this study, 3.75 s, which is the mean of the values corresponding to two driving patterns, can be used.
Fig. 12Steering times for curve entry and curve exit: a) curve-cutting pattern, b) lane-keeping pattern, and c) stable steering time on curve entry

4.5. Topological relations between steering behavior and horizontal curve geometry
The start and end points of a curve in a road (TC and CT) were used as the split points. The steering length while entering or departing a horizontal curve was then divided further into two sections using the equation shown below:
The section before the split point (i.e., and ) is defined as the look-ahead distance of steering, while that after the split point (i.e., and ) is defined as the follow-through distance of steering. The topological relationship between these two distances and the points TC/CT is illustrated in Fig. 10(b). Using the four length parameters , , , and , one can obtain the answers to a series of questions: “At which position does a driver initiate steering when entering a curve?”; “What is the requisite look-ahead steering distance for a curve with a given radius and deflection angle?”; “Over what distance is follow-through steering behavior observed after entering a curve?”; “Upon exiting a curve, at what point does a driver start to restore the position of the steering wheel?”; and “After entering a straight segment, over what distance is the steering behavior maintained?” The answers to these questions should allow one to describe driving behaviors with greater clarity and accuracy.
The test results for three groups of curves, shown in Fig. 13, highlight the effect of a curve’s deflection angle, , on the steering behavior. It can be seen from Figs. 13(a)-(c) that, of the four steering behavior parameters, and are more sensitive to changes in Δ. In addition, a threshold value, , can be observed. When Δ is smaller than the threshold value, both and decrease with . This is because the length of the circular section, , decreases with . When equals , the start and end points of the maintenance phase (during which the position of the steering wheel is held constant) within the curve will coincide. This means that the steering maintenance distance within the curve, , will be 0, yielding Eq. (3). Therefore, when there is a further reduction in , both and will decrease along with , here denotes the length of circular section:
Fig. 13Results of simulation of steering length for curves with different curvatures; in the case of “curve following,” the driver engages in lane keeping
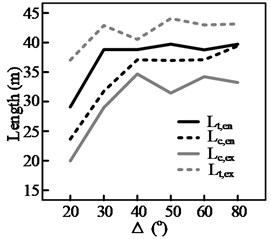
a) 125 m, curve cutting
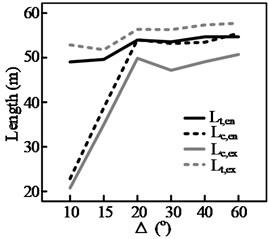
b) 250 m, curve cutting
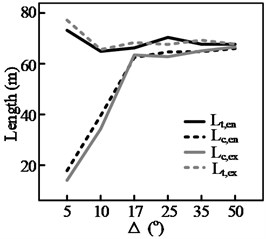
c) 480 m, curve cutting
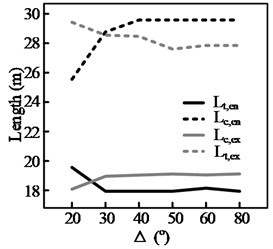
d) 125 m, curve following
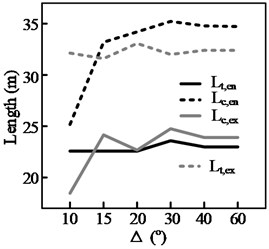
e) 250 m, curve following
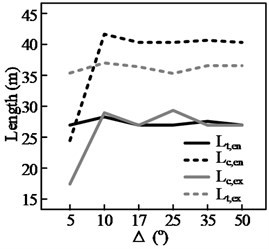
f) 480 m, curve following
In this situation, the driver must continuously adjust the steering angle while the vehicle is within the curve. (As shown in Fig. 8(b), when is less than 20°, 0). In contrast, the other two parameters and only decrease with when the radius of the curve is relatively small, such as when 125 m. Even then, the magnitude of the decrease is not significant.
The results for all the test curves are shown using bar graphs in Fig. 14. In the figure, the low value of the column for each radius corresponds to the minimum deflection angle for a curve of that radius, while the high value of the column corresponds to the maximum value of the test results when . The following information and conclusions could be derived from the figure.
Fig. 14Simulation results for all curve radii: a) entering a curve, DCP is cutting; b) exiting a curve, DCP is cutting; c) entering a curve, DCP is following (lane keeping); and d) exiting curve, DCP is following
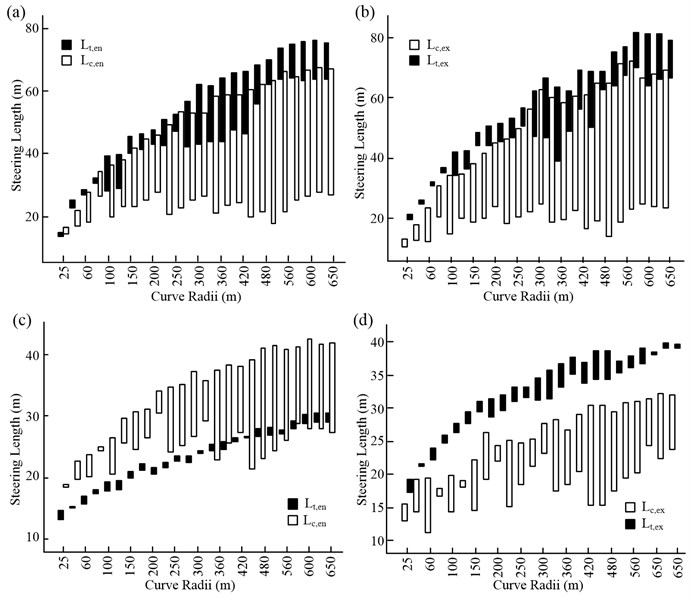
To begin with, in general, the sensitivity of the steering parameters to the curve deflection angle increases with the radius of the curve. This is particularly the case when the direction control pattern (DCP) is curve cutting. Second, for the two DCPs, the sensitivity of the steering parameters to the curve deflection angle is much lower for the “following” mode, as compared to that for the “cutting” mode. The implication is that the steering behavior of a driver on a curve is determined to a greater degree by the geometrical features of the curve when curve cutting is adopted.
Third, the steering behaviors when entering and exiting a curve are symmetrical, as can be seen from Figs. 14(a) and (b). The point of symmetry is located at the mid-point of the curve. This is reflected in the distribution graphs for and , which exhibit similar variation trends. At the same time, and are also similar, while the values of and are, in general, greater than those of and , respectively.
Fourth, such symmetries in the steering behavior are not observed when the “following” pattern is adopted by the driver (see Figs. 14(c) and (d)). However, another conclusion that can be drawn is that and , that is, the look-ahead distances for steering, are significantly shorter than and , the follow-through steering distances. This is because, when following a curve, the driver only reacts when it becomes necessary to steer the vehicle. This situation differs from driving in a cutting pattern, wherein there is sufficient space ahead for the driver to plan the path that he or she will take.
With regards to the management and control of traffic on operational roads, traffic engineers are more concerned about the look-ahead distance of steering when entering a curve. That is to say, when encountering a curve, at which point on the road will the driver start to adjust his or her steering? It is only when this point is determined that the most appropriate position for signage can be determined, as shown in Fig. 15(a).
The relationship between the look-ahead steering distance and the curve radius under the two DCPs is shown in Fig. 15(b). The ordinate value stated above for each radius is the arithmetic mean of , obtained from the test results for . From this figure, it can be seen that the look-ahead distance for steering corresponding to the cutting pattern is more than double that for the “following” pattern. An obvious implication is that the distance between TC and the points at which signage is installed must be greater than the look-ahead distance for steering in the cutting mode. Only then can it be guaranteed that drivers will be able to see these signs before they initiate steering behavior.
Fig. 15a) Steering behavior when negotiating a curve and b) relationship between the look-ahead distance for steering and the curve radius
4.6. Effect of vehicle wheelbase on steering behavior
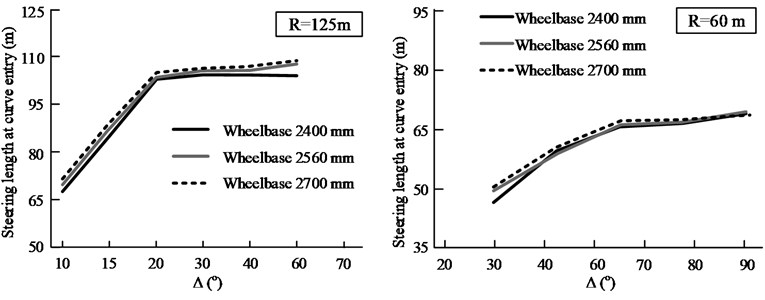
Among the various structural size-related and mechanical parameters of passenger cars, the wheelbase and tire cornering stiffness are the factors most directly affecting the vehicle steering characteristics. In addition to the material and structure of the tire, the cornering stiffness is also affected by a number of other factors, such as the tire pressure, axle load, suspension stiffness, highway alignment, and pavement evenness, among others. Therefore, this parameter changes continuously while driving and is difficult to measure. In comparison, the wheelbase is a more direct parameter available for designers and road users. Therefore, it was taken as the test variable in this study, with the values used being 2400, 2560, and 2700 mm. Actually, [2400 mm, 2750 mm] is the wheelbase range for most of the hatchbacks and sedans sold in China.
Figure 16 displays the steering test results for two groups of curves with 60 and 250 m; however, the effect of variations in the wheelbase within the test range on the steering length is not shown here. Hence the results (for a vehicle wheelbase of 2575 mm) in Sections 4.1 to 4.5 can reflect the wheelbases of most of the passenger cars seen on Chinese highways.
Fig. 16Steering lengths for three vehicle wheelbases
5. Conclusions
The simple curve, which is a combination of horizontal alignments, is used frequently in road geometry design. However, there has been little research on the steering behavior on such curves during the steering process. To resolve this issue, a “road-driver-vehicle” driving simulation method was proposed. The main findings obtained using the method are as follows:
1) For curves with a certain radius , there is a critical deflection angle, . When is less than or equal to , as decreases, the steering wheel angle, steering time, and steering length also decrease. When lies between [300 m, 450 m], the effect of on the steering behavior is the most pronounced. Further, the steering behavior during curve cutting is more likely to be affected by than that during lane keeping.
2) The steering length for both driving patterns (curve cutting and lane keeping) increases with an increase in ; however, once reaches 550 m, the steering length tends to remain constant. For the same driving pattern, the steering length during curve entry and that during curve exiting show no significant difference.
3) Different driving patterns can lead to significant differences in the steering length. Generally, the stable steering length during curve cutting is approximately twice that during lane keeping. The steering length versus curve radius graph can be the basis determining the optimal spiral length. However, the influence of the driving patterns should also be taken into account.
4) When curve cutting is adopted, the steering time versus curve radius graph is convex and the radius at its vertex is 300 m, while that for lane keeping decreases monotonically. When the lane width is 3.5-4 m, the mean value of the steering time for the two driving patterns is 3.75 s.
5) When a driver adopts the curve-cutting pattern, his or her steering behavior when entering and exiting a curve are symmetrical about the mid-point of the curve. However, the steering process is sequential when the path-following pattern is adopted: the look-ahead distance when entering/exiting the curve is shorter than the subsequent follow-through distance.
6) When the driver adopts the curve-cutting pattern, the look-ahead steering distance when the vehicle is approaching a curve is greater than that for the “following” pattern. This means that, in the case of the cutting pattern, the driver adopts the curvilinear motion earlier.
The main focus of this study was to investigate the psychophysiological aspects of vehicle driving. The effects of horizontal curve geometry on vehicle handling behavior and vehicle motion were analyzed. However, a number of factors can affect driving behavior, such as fatigue, hypnosis, and distraction, among others. These factors will be analyzed in our future works.
References
-
Said D., Hassan Y., Halim A. O. Methodology for analysing vehicle trajectory and relation to geometric design of highways. Advances in Transportation Studies, Section B, Vol. 10, 2006, p. 55-71.
-
Trentacoste M. F. Integrating actual road design into highway driving simulators for research, design, and consumer information applications. Advances in Transportation Studies, Section A, Vol. 14, 2008, p. 7-16.
-
Lin Y., Yang Z., Pan X. D. Effect of spiral transition curve length on vehicle path. Journal of Southwest Jiaotong University, Vol. 46, Issue 2, 2011, p. 200-204.
-
Xu J., Luo Q., Peng Q. Y., Shao Y. M. Influence of spiral setting on vehicle speed on curve. China Journal of Highway and Transport, Vol. 24, Issue 1, 2011, p. 25-33.
-
Spacek P. Track behavior in curve areas: attempt at typology. Journal of Transportation Engineering, Vol. 131, Issue 9, 2005, p. 669-676.
-
Perco P. Desirable length of spiral curves for two-lane rural roads. Transportation Research Record: Journal of the Transportation Research Board, Transportation Research Board of the National Academies, Washington, D.C., Vol. 1961, 2006, p. 1-8.
-
Dragčević V., Korlaet Ž., Stančerić I. Methods for setting road vehicle movement trajectories. The Baltic Journal of Road and Bridge Engineering, Vol. 3, Issue 2, 2008, p. 57-64.
-
Prokop G., Modeling N. Human vehicle driving by model predictive online optimization. Vehicle System Dynamics, Vol. 35, Issue 1, 2001, p. 19-53.
-
Salvucci D. D., Gray R. A two-point visual control model of steering. Perception, Vol. 33, Issue 10, 2004, p. 1233-1248.
-
Teixeira R. R., Moreira S. R. D. S., Tavares S. M. O. Multibody dynamics simulation of an electric bus. Procedia Engineering, Vol. 114, 2015, p. 470-477.
-
JTG D20-2006. Design Specification for Highway Alignment. China Communication Press, Beijing, 2006.
-
Drivet A., Ramírez-Mendoza R. A., Flores L., Sename O., Vassal C. P., Dugard L. Virtual prototyping for vehicle dynamic modelling. Mechatronics, the 4th IFAC Symposium on Mechatronics Systems, Vol. 4, 2006, p. 986-991.
-
Pacejka H. B. Tire and Vehicle Dynamics (2nd Edition). SAE International Warrendale, PA, USA, 2006.
-
Sharp R. S., Casanova D., Symonds P. A. Mathematical model for driver steering control, with design, tuning and performance results. Vehicle System Dynamics, Vol. 33, Issue 5, 2000, p. 289-326.
-
Xu J., Zhao J., Yang, Shao Y. M. Modeling typical driving patterns in target trajectory decisions for vehicles traversing roads with complex shapes. SIMULATION: Transactions of The Society for Modeling and Simulation International, Vol. 92, Issue 7, 2016, p. 669-686.
-
Lauffenburger J. P., Basset M., Gissinger G. L. Design of a coupled longitudinal-lateral trajectographic driver model. IFAC World Congress (IFAC2005), Prague (Rép. Tchèque), 2005, p. 1-6.
-
Shao Y. M., Xu J., Li B. W., Yang K. Modeling the speed choice behaviors of drivers on mountainous roads with complicated shapes. Advances in Mechanical Engineering, Vol. 7, Issue 2, 2015, p. 1-13.
-
Xu J., Yang K., Shao Y. M., Lu G. Y. An experimental study on lateral acceleration of cars in different environments in Sichuan, Southwest China. Discrete Dynamics in Nature and Society, Vol. 2015, 2015, p. 1-16.
-
Krammes R. A., Garnham M. A. Worldwide review of alignment design polices. International Symposium on Highway Geometric Design Practices, Sponsors: American Association of State Highway and Transportation Officials, Boston, Vol. 19, 1995, p. 1-17.
-
Stewart D. Risk on roadway curves. Traffic Engineering and Control, Vol. 35, Issue 9, 1994, p. 528-528.
Cited by
About this article
This research was supported by The National Key Technology R&D Program during the Twelfth Five-year Plan Period (Grant No. 2014BAG01B01), the Applied Basic Research Program of the Ministry of Transport of China (Grant No. 2015319814050), and the Science and Technology Planning Project of ChongQing Municipality, China (Grant No. cstc2014jcyjA30024).
