Abstract
The aim of this study is to investigate the effect of shock-disturbed cracks on the dynamic fragmentation of granite. Considering the complex behavior of rock materials, the Walsh’s model was revisited and extended by including the stress effect required to close an initially open crack and examining the unloading process in detail. This analysis leads to closed-form expressions for loading and unloading portions of the effective Young’s modulus, as functions of the crack density, characteristic aspect ratio, and crack friction coefficient. Subsequently, the effective Young’s modulus and cutting force are simulated and the influence of cracks is studied. The analysis results with different crack density and disturbed frequency are compared in terms of effective Young’s modulus and cutting force. Finally, the tool and damaged rock model with randomly oriented cracks by shock disturbed at a different frequency was demonstrated by the test. The good agreement between the simulation results and experimental data demonstrates the validity of the simulation method.
1. Introduction
A large diameter rotary drilling rig is often used in mining of large-scale surface mines. However, this rig is inefficient, and its cone bits experience serious wear when used in hard rock metal mines. Therefore, the new technology of shock-induced drilling is presented, and the principle is shown in Fig. 1. The strength of the rock mass is weakened by the redistribution of stress around the induced hole, so cutting a rock mass in the damaged zone becomes easy [1-3]. To study the cutting features of the damaged rock, constructing the tool-damaged rock model and the damaged rock-crack model is necessary to predict the cutting force on the damaged rock by shock disturbance.
A considerable effort has been made recently by researchers to numerically simulate the tool-rock interaction and rock fracture response during percussive drilling. Forquin and Hild [4] used a continuum approach to study the dynamic fragmentation in a wide range of brittle materials because of impact loadings. A plasticity model introduced by Swenson [5] is employed together with an anisotropic damage model developed by Denoual [6], Forquin and Hild [4]. This model was used to describe the fragmentation of two grades of limestone subjected to edge-on impact tests [7] and the strength improvement and failure pattern of microconcrete [8]. Saadati et al. [9] applied the model on granite and investigated the rock fragmentation process and the force-penetration response at percussive drilling. It was shown that the plasticity model is an appropriate tool for this purpose as it deals with both the dynamic fragmentation as a result of tensile stress and the plasticity-like deformation in compression. However, the finite element method based on the continuum mechanics theory of material simulation has serious problems in representing properly discontinuities of the material occurring during rock cutting.
The discrete element method can take into account most of kinds of discontinuities and material failure characterized with multiple fractures which make it a suitable tool to study rock cutting. Among the numerical studies that are performed in 2D, a work of Liu [10] and Wang et al. [11] can be mentioned. Both of these studies are performed using in-house numerical codes and do not account for inelastic strains in the rock. Another example of 2D numerical simulation of percussive drilling is the work by Saksala [12] where a viscoplasticity consistency model and an isotropic damage description are coupled to take both the compressive and tensile responses of a rock into account. The model has been improved recently to deal with 3D simulations [13]. Furthermore, Chiang et al. [14] also used a 3D finite element (FE) approach to simulate the rock fragmentation during the drilling process by using a linear Mohr envelope together with a tension cutoff plane. Among the studies using discontinuous mechanics approach, Thuro et al. [15] used a Particle Flow Code (PFC2D) to investigate the crack pattern in drilling and its correlation with existing foliations. However, this research did not consider the effect of cracks on the cutting force.
Various research studies of a cracks analysis for the damage rock have been reported. In 1965, Walsh [16, 17] published a set of three papers that provide the conceptual basis of the influence of cracks on the elastic rock deformation. Under hydrostatic loading [16], open cracks (i.e., at low stresses) initially contribute an excess compliance to the rock. As the stress increased, each crack closes up at a stress that is roughly equal to αE, where E is the Young’s modulus of the uncracked rock, and αis the initial aspect ratio of the crack. After a crack is closed, it is assumed not to contribute to rock behavior under hydrostatic loading, because such loading is assumed to cause no resolved shear stress on a closed crack face. This model has been extended [18] by adding a cohesion term to the frictional constitutive law for the cracks, thereby allowing the model to predict yield-type behavior, but again retained the simplification of assuming that the compressive stress required to initially close a crack is negligible. However, this research did not consider the effect of disturbance frequency on the cracks.
In the present investigation, the effect of the presence of cracks, which are produced by the former impact of the drill bit in the damage rock, is studied in detail and the simulations are compared with experimental observations. The different densities and orientations of the cracks are introduced in a numerical model, and their effect on the Young’s modulus is studied. Furthermore, the numerical tool is used to explore the influence of cracks on cutting force at different disturbance frequency.
2. Shock-induced drilling principle
The principle of shock-induced drilling is shown in Fig. 1. First, the impactor is used for drilling the center hole; the strength of rock mass is weakened by the redistribution of stress around the induced center hole. Second, the little cutting force on the damage zone can crush the rock. P is the axial pressure, Q is the impact load, and T is the rotary torque.
Fig. 1Shock induced drilling principle of
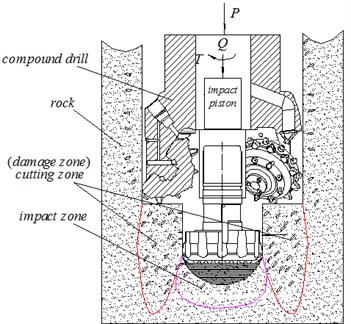
Fig. 2Force analysis of rock around induced hole during tooth intrusion
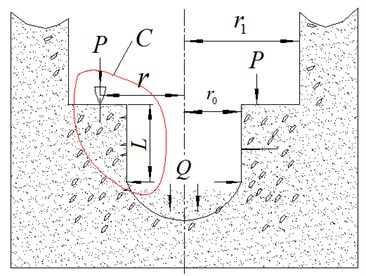
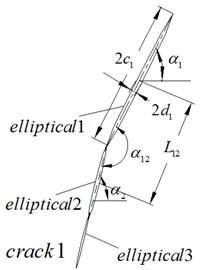
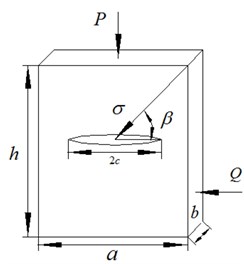
Fig. 2 is the force analysis diagram of the damaged rock around the induced hole during tooth intrusion. r0 is the radius of the induced hole, abL is the radius of the tooth intrusion, r1-r0 is the radius of the weakened zone of rock around the induced hole. Fig. 3 is the enlarged image of region C in Fig. 2, Fig. 3(a) is the cracks’ propagation conditions after the drill tooth penetration, Fig. 3(b) is the model of the cracks’ propagation during the tooth intrusion. Fig. 4(a) is the structure of the crack 1 in Fig. 2(b), assuming that it is constituted by three different shapes of elliptical cracks (because of the elliptical crack has two surfaces and the crack tip, so it’s similar to the actual crack), c1 is the half-length of elliptical crack 1, d1 is the half-length of the elliptical crack 1, α1 is the angle of the elliptical crack 1, α12 is the angle between elliptical crack 1 and elliptical crack 2, L12 is the center distance between the elliptical crack 1 and elliptical crack 2, changing the parameters and numbers of the elliptical crack, different shapes’ cracks can be obtained. Fig. 4 (b) is the force analysis of single elliptical crack around the induced hole during tooth intrusion.
Fig. 3Enlarged image of region C in Fig. 2
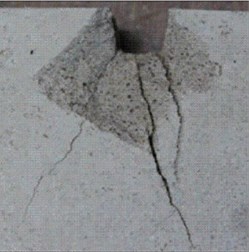
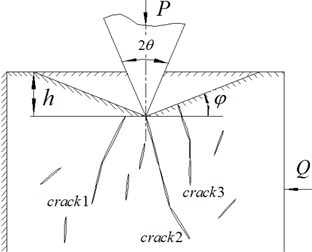
Fig. 4a) Structure of crack 1 and b) force analysis of single elliptical crack around induced hole during tooth intrusion
a)
b)
3. Mathematical model of damaged zone
3.1. Effect of single crack during loading
The rock specimen of length h, width a, and thickness b containing a single open elliptical crack of half-length c and subjected to a compression σ is considered (Fig. 4(b)):
The dimensionless functional relationships that link macroscopic and microscopic parameters can be postulated for a discrete element model [13]:
The effective Young’s modulus of the specimen can be defined by:
where E is Young’s modulus of the uncracked rock, l is a certain length parameter, A is a characteristic area related to the discrete element model, kn, kt are the contact stiffness in the normal and tangential direction respectively, Rn, Rt are the interface strength in the normal and tangential direction respectively, ΔW is the excess energy stored in the rock due to the presence of a crack and abh is the volume of the plate.
If the crack is open and the plane, in which it lies (not its normal vector), is oriented at an angle β to the direction of the applied stress, under the assumption of the plane stress, the excess energy term is equal to [17]:
This result can be transformed into one appropriate for plane strain by replacing E by E/(1-ν2), where ν is the Poisson’s ratio of the uncracked rock. To simplify the notation, the case of plane stress is considered, where ν does not appear. However, the term (1-ν2) is usually very close to the unity, in any event. Hence, the effective modulus of a rock containing this single crack will be:
where γ=c2/ah is the crack density parameter.
The case is considered when the crack is closed; the two opposing faces are thus in contact and sliding past each other. The energy, supplied by the externally applied stress that is required to cause the crack faces to slide, is given by [17]:
where σsinβcosβ=τ is the resolved shear stress along the crack plane and τf is the frictional stress that resists the sliding. Adopting the simplest law of sliding friction, τf=μσn is assumed, whereμis the friction coefficient, and σn is the resolved normal stress acting on the crack surface. Following the Walsh’s argument, if σc is the normal stress necessary to cause the crack faces to close up and come into contact, then the actual effective value of the resolved normal stress acting on the crack will be σeffn=σn-σc. However, σn=σsin2β; thus, in combining all of these relations, the difference between the resolved shear stress and the frictional resistive shear stress is:
In conjunction with the general Eq. (4), the effective elastic modulus for the rock containing a single sliding crack will be:
3.1.1. Open or closed crack criterion
Although the relations of the effects on the elastic modulus of an open crack or a closed sliding crack are obtained, a criterion is derived to decide whether a given crack is open or closed, or to choose if it is sliding when closed. The normal stress σc is required to close an elliptical crack whose initial aspect ratio is Eα/2, where α is defined to be the ratio of the minor axis to major axis, so that α<1. Furthermore, α is defined as the initial aspect ratio of the crack at zero stress. The original Walsh’s model and other aforementioned models correspond to the idealized case of α=0.
The resolved normal stress on the face of the crack is σn=σsin2β; thus, the criterion for a crack to be open at an applied compressive stress σ is σn<σc=Eα/2. Hence, at a given stress σ, a crack will be open if β<βc, and closed if β>βc, where the critical angle βc is given by:
Cracks at all orientations will be open at stresses below σc, which is at normalized stresses below 1. When ˆσ=1, βc(ˆσ)=π/2, only the cracks that are precisely normal to the loading direction will close. As σ increases, cracks that are oriented at smaller angles to the loading axis will close, because Eq. (11) shows that the critical angle βc(ˆσ) decreases as ˆσ increases.
3.1.2. Sliding crack criterion
For a crack to be sliding, it must already be closed. Hence, a necessary condition for sliding is β>βc. However, the sliding can occur only if the resolved shear stress exceeds the frictional resistive stress, which is from Eq. (8):
Using standard trigonometric identities, Eq. (12) can be rearranged as follows:
Eq. (14) can be rearranged as follows:
A manipulation of Eq. (13) shows that, when ˆσ=1, βs=π/2, and whenˆσ→∞, βs→arctan(1/μ). Moreover, for all normalized stresses ˆσ>1, the critical angle for sliding, βs, as given by Eq. (13), exceeds the critical angle for closure, βc, as given by Eq. (11).
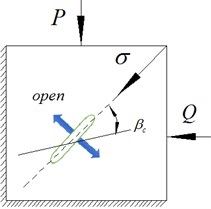
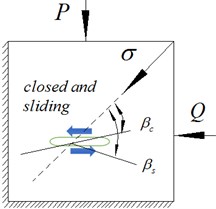
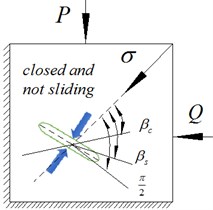
To summarize, if ˆσ<1, a crack at any orientation to the direction of externally applied stress will be open. If ˆσ>1 and if β<βc, cracks will be open, and closed if β>βc, where the critical angle for the closure is given by Eq. (11). A closed crack will be sliding if βc<β<βs, and will not be sliding if βs<β<π/2, where the critical angle for sliding is given by Eq. (13). The situation is illustrated in Fig. 5.
Fig. 5Cracks at different orientations, under given compressive stress P and impact loads Q
3.2. Loading and unloading of rock containing randomly oriented cracks
The rock that contains a distribution of N cracks is supposed, each with the same size and with their orientation angles uniformly distributed. By symmetry, only the range of values 0≤β≤π/2 is considered. To simplify the calculations, the no-interaction approximation is invoked, in which the excess energy because of each crack is computed as if it were an isolated crack in an infinite body [17]. This approximation is very accurate at low crack densities, but becomes gradually inaccurate as crack density increases.
In the regime ˆσ<1, all cracks remain open. If the interactions between cracks is continually ignored, the contributions of each crack to the compliance will be additive, and thus the right-hand side of Eq. (6) over the range 0≤β≤π/2, is averaged to find:
where γ=Nc2/aL is the standard two-dimensional crack density parameter. If a normalized elastic modulus is defined as ˆE=Eeff/E, then the normalized modulus for a body containing N randomly distributed open cracks will be ˆE=1/(1+πγ).
For ˆσ>1, the right-hand term in Eq. (6) must be integrated for those cracks that are open, β<βc, and the right-hand side of Eq. (10) for those closed cracks that are sliding, βc<β<βs. As mentioned above, the cracks, for which β>βs will be closed and not sliding do not contribute to the energy budget. The temporary notation 1/ˆE=1+Copen+Csliding is introduced, where the C terms are compliances due to the open and sliding cracks.
From Eq. (6), the compliance because of open cracks when ˆσ>1 is:
=2γ(arcsin√1/ˆσ-1ˆσ√ˆσ-1).
γ represents the total crack density; the proportions of cracks that are open or are sliding are accounted for by the stress-dependent limits of integration.
From Eq. (10), the compliance because of the sliding cracks is given by:
=γ[12(β-sin4β4)-μsin4β-μˆσcos2β]βsβc.
Thus, the full expression for the elastic modulus is given by:
The applied compressive axial stress is assumed to be increased to a certain value σmax, after which it begins to decrease. A decrease in the compressive stress can be considered as the super-position of a tensile stress or a stress of the opposite sign. If the applied stress is reduced fromσmax to a certain value σ; where σ=σmax-Δσ, an associated decrease Δτ will occur in the shear stress acting on the crack as well as a decrease Δτf will occur in the frictional resistive stress. Reverse sliding will occur if [17]:
The energy of the reverse sliding is given by:
where:
So Eq. (18) can be rearranged in terms of the normalized stresses as follows:
Using standard trigonometric identities, Eq. (18) can be rearranged as follows:
Therefore, the condition for reverse sliding can be summarized as follows:
where the critical (maximum) angle for reverse sliding is given by:
The excess compliance contributed by the cracks that are undergoing reverse sliding will be given by:
=γ[12(β-sin4β4)(ˆσmaxˆσ-1)-μ(ˆσmax+1)sin4β-2μˆσcos2β]βcβrs.
The full expression for the elastic modulus is now given by:
4. Simulation and test results
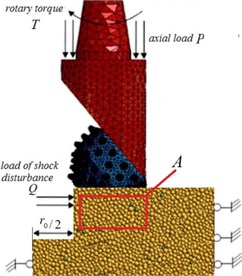
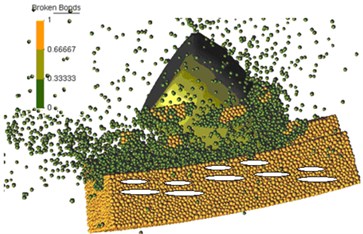
The bonded particle model of the rock material was built in the particle flow code software (PFC2D). Because the particle flow samples could reflect the macroscopic mechanical properties of real rock materials, a calibration of the microscopic parameters of particle model was necessary. The simulated system is shown in Fig. 6. Fig. 6(a) is the cutting simulation of the whole cone bit; Fig. 6(b) is the cutting simulation of a single drill tooth. In Fig. 6(a), the right and bottom boundary is fixed in the calculation process, while the left boundary is servo-controlled to provide periodic disturbance force in simulations. The rock material in this study was granite purchased from the Yuelu Mountain in the Hunan province. Considering great differences in stiffness between particles and the cutter, the cutter with the same size as that in experimental tests is simplified into rigid walls. The set of microscopic parameters of the simulation is: Rn=150 N, Rt=121 N, kn=kt=3.6×10⁶ N/m, μ=0.5. Table 1 shows the comparison of the simulated values and the macro parameters of real rock material. The error between the simulated values and the real values is very negligible.
Fig. 6Numerical simulation of rock cutting test a) numerical simulation principle b) cutting phenomenon of single drill tooth
a)
b)
Table 1Comparison of simulation values and macro parameters of real rock material
Mechanics property | Elastic modulus / GPa | Poisson ratio | Tensile strength / MPa | Compression strength / MPa | Cohesion / MPa |
Experimental value | 67.5 | 0.25 | 8.69 | 164.8 | 25.8 |
Simulation value | 66.8 | 0.23 | 8.53 | 159.6 | 24.9 |
Error / % | 1.04 | 8 | 1.84 | 3.16 | 3.49 |
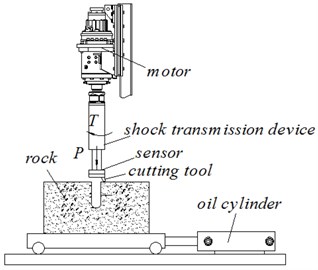
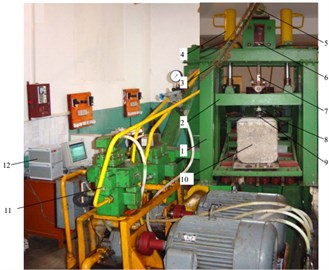
The experimental system is shown in Fig. 7. Fig. 7(a) and 7(b) shows the experimental principle and the experimental system, respectively. The specimen size is 400 mm×400 mm×500 mm (length×width×height). Before the test, the specimen surface is polished by a grinder. The induced hole is then drilled with an impactor at different frequencies of 0, 10, and 15 Hz. The diameter of the center hole is 100 mm, and the depth of the hole is 400 mm. Then the specimen is pushed to the right place by an oil cylinder. Finally, the cutting force of a single tooth around the center hole was tested under the same axial loads. The simulated and experimental results are shown in Figs. 8-13.
Fig. 7a) Experimental principle, b) experimental system: 1 – rack, 2 – lifting beam, 3 – lifting device, 4 – hydraulic cylinder, 5 – Motor, 6 – shock transmission device, 7 – shock rod, 8 – sensor, 9 – cutting tool, 10 – rock, 11 – hydraulic valve, 12 – display device
a)
b)
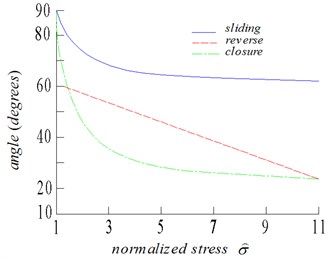
Fig. 8Relationship between normalized stress and critical angles
The comparisons of the experimental and simulation results are shown in Figs. 8-14. The following conclusions can be made:
(1) Fig. 8 represents, as a function of the normalized stress, the evolution of the critical angles for closure, sliding, and reverse sliding, as given by Eqs. (11), (13), and (19), respectively. The values of these critical angles are not given for ˆσ<1, because ˆσ=1 is the stress required to close the first crack. The friction coefficient is considered as μ=0.6. The cracks, whose orientation is below the closure criteria, can be seen as open cracks. Closure proceeds at a rate such that, for example, 70 % of the cracks are already closed when ˆσ=4. Nevertheless, a significant portion of the cracks remain open even during high stresses. The cracks mobilized by frictional sliding during loading are those cracks lying between the critical angles for closure and sliding (or reverse sliding during unloading). Reverse sliding does not occur at the beginning of unloading. Moreover, Eq. (19) can easily show that as ˆσ→ˆσmax, βrs→βc(ˆσmax)and it does not depend on the friction coefficient. Fewer cracks are mobilized more often during unloading than during loading.
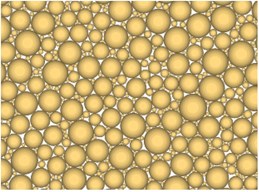
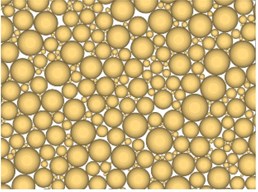
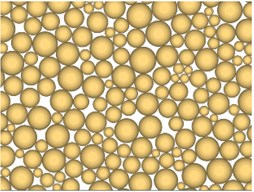
(2) When the disturbance force is constant, the cracks of the region A in Fig. 6 under the condition of different disturbance frequency, shown in Fig. 9. Fig. 9(a), Fig. 9(b) and Fig. 9(c), are the cracks’ propagation conditions of the region A under the condition of 0, 10 and 15 Hz. In contrast to Fig. 9(a), Fig. 9(b), and Fig. 9(c), the cracks of the region A increased as the disturbance frequency increased. This shows that the elastic modulus of granite decreased with an increase of the disturbance frequency.
Fig. 9Cracks’ propagation conditions of region A in Fig. 6 under different disturbance frequencies
a) 0 Hz
b) 10 Hz
c) 15 Hz
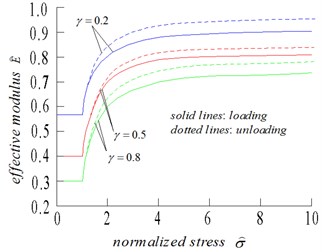
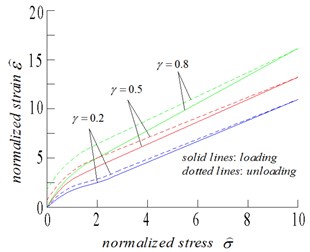
(3) Fig. 10 shows the stress dependence of the effective modulus and the resulting stress–strain curves for the three values of the crack density, γ=0.2, 0.5, and 0.8, for a fixed value of the friction coefficient, μ=0.6. Fig. 10 shows the equivalent plots for three values of the friction coefficient μ=0.3, 0.5, and 0.8, for a fixed value of the crack density γ=0.5.
Considering that no-interaction approximation is used for calculating the effective modulus, the compliance is a linear function of crack density. Hence, if all other parameters are held constant, the compliance (1/ˆE) will be a linear function of γ. The resulting effect of increasing the crack density is more pronounced compliance, more non-linearity, and a larger hysteresis loop, as illustrated in Fig. 10.
Fig. 10a) Normalized effective Young’s modulus, and b) normalized strain, as functions of normalized stress, for friction coefficient of 0.5, and three values of crack density: 0.2, 0.5, 0.8
a)
b)
Fig. 11(a) Normalized effective Young’s modulus, and (b) normalized strain, as functions of normalized stress, for crack density of 0.5, and three values of friction coefficient: 0.3, 0.5, 0.8
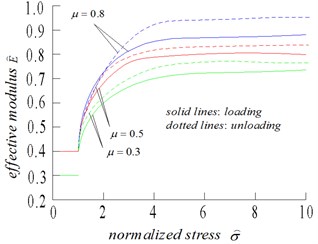
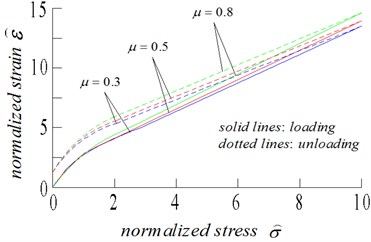
The only parameter whose influence cannot be seen clearly from the equations is the friction coefficient μ. Physically, the effect of sliding is expected to decrease with increasing values of μ, thus resulting in increased stiffness and less pronounced non-linearity and hysteresis, as illustrated in Fig. 11. The extreme case of μ=∞, although not physically realistic, is not shown in Fig. 11, but would result in a perfectly reversible stress-strain curve, without any hysteresis.
Research studies commonly assert that after a phase of non-linearity caused by the closure of the cracks, the subsequent nearly linear regime is representative of the compression of an uncracked elastic body. This result is a good approximation under a hydrostatic stress, but not under impact loading. For realistic values of the friction coefficient, as shown in Figs. 10 and 11, the frictional sliding of the cracks provides the excess compliance and causes a non-linear behavior, although the nonlinearity is less pronounced due to the closure of the cracks. For high values of stress, even when the cracks are mainly closed, the effective modulus during loading is never equal to the uncracked modulus, and has a value of approximately 70 %-90 % of E. The uncracked rock modulus E can only be inferred from the slope of the stress-strain curve at the beginning of unloading, because this slope does not depend on any of the microstructural parameters with the cracks being closed and stuck.
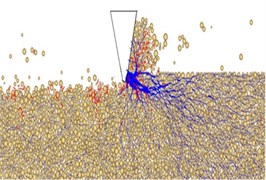
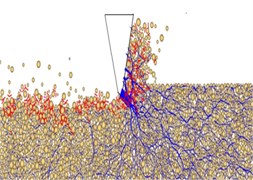
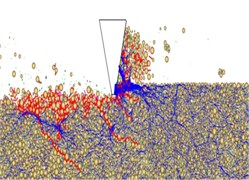
When the invasion load is constant, the drill tooth cutting phenomenon under different disturbance frequencies is shown in Fig. 12. Fig. 12(a), Fig. 12(b) and Fig. 12(c) are the drill tooth cutting phenomenon under the condition of 0, 10 and 15 Hz. In contrast to the Fig. 12(a), in the Fig. 12(b) and Fig. 12(c), it can be obtained that the cracks’ density increases as the disturbance frequency increases, the volume and the scope of the fractured rock are also increasing with the increase of the disturbance frequency. It is shown that the efficiency of the shock-induced drilling could be improved by increasing the disturbance frequency.
Fig. 12Cutting phenomenon of drill tooth under different disturbance frequencies
a) 0 Hz
b) 10 Hz
c) 15 Hz
Fig. 13Fracture condition of the granite under different disturbance frequencies
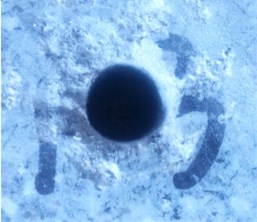
a) 0 Hz
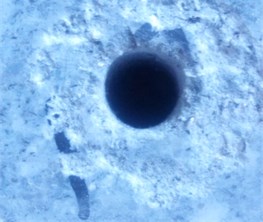
b) 10 Hz
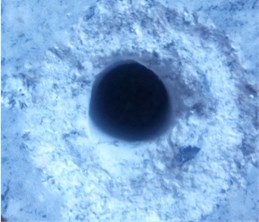
c) 15 Hz
In Fig. 13, Fracture condition of the granite under different disturbance frequencies of the impactor are shown. It can be obtained that the volume and the scope of the fractured rock are increasing with the increase of the disturbance frequency. This shows that the crack density is increasing with the increase of the disturbance frequency, and the elastic modulus decreases with the increase of the crack density, so the drill teeth intrusion more easily and the volume of the fractured rock under the same intrusive force is bigger.
The cutting forces between the simulation and experiment under different disturbance frequencies are shown in Fig. 14. In the experiment, the cutting force decreased when the frequency increase was greater than the values in the simulation results. The difference occurs due to the nonlinearity of rock materials. The peak values of the different frequencies in the simulation were 60, 30, and 25 KN, respectively, whereas in the test, these were 80, 40, and 20 KN, respectively. The fluctuation of the cutting force is caused by shock disturbance. There are nearly 25 % errors between the simulation and experimental data. These errors are caused by the differences between the calculated values and the actual values.
From the aforementioned analysis, the error of the simulation is acceptable for the application in this present paper. As such, the model can be used to analyze and predict the cutting force of the damaged hard rock.
Fig. 14Comparison between simulation and experimental results of cutting force under different disturbance frequency
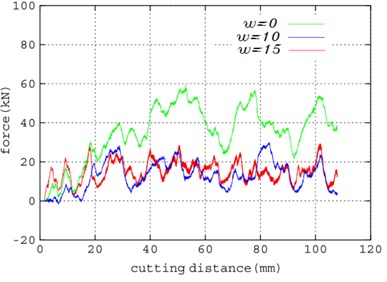
a) Simulated results
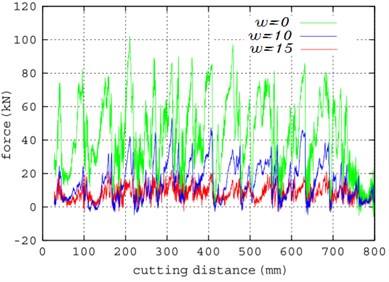
b) Experimental results
5. Conclusions
A new technology of shock-induced drilling was presented, and a crack model of the damaged rock around the induced hole was built. Subsequently, the effective elastic modulus of a damaged rock under the condition of the impact loads was analyzed, and the results showed that the effective elastic modulus significantly decreased with the increase of the crack density.
A numerical simulation and laboratory results, disturbance frequency of the cutting force of the damaged rock showed that the cutting force decreased with the increase of the disturbance frequency. When the disturbance frequency was 15 Hz, the cutting force was about one third of the force without disturbance.
The numerical simulation could reveal the cutting phenomenon. However, an error between numerical results and the experimental measurements still existed. Thus, the developed model is required to be further verified. More comprehensive experimental testing procedure is needed to calibrate the model, including a triaxial compression test, a direct shear test and a fracture mechanics test. The use of these test results for a model calibration could allow better model tuning and the subsequent improvement of the qualitative results during rock cutting.
References
-
Li X., Yao J., Du K. Preliminary study for induced fracture and non-explosive continuous mining in high-geostress hard rock mine – a case study of Kai Yang phosphate mine. Chinese Journal of Rock Mechanics and Engineering, Vol. 32, Issue 6, 2013, p. 1101-1111.
-
Gong F., Lu D., Li X., Rao Q., Fu Z. Toughness increasing or decreasing effect of hard rock fracture with pre-static loading under dynamic disturbance. Chinese Journal of Rock Mechanics and Engineering, Vol. 33, Issue 9, 2014, p. 1905-1915.
-
Cao W., Li X., Zhou Z., Ye H., Wu H. Energy dissipation of high-stress hard rock with excavation disturbance. Journal of Central South University (Science and Technology), Vol. 45, Issue 8, 2014, p. 2759-2767.
-
Forquin P., Hild F. A probabilistic damage model of the dynamic fragmentation process in brittle materials. Advances in Applied Mechanics, Vol. 44, 2010, p. 1-72.
-
Swenson D., Taylor L. A finite element model for the analysis of tailored pulse stimulation of boreholes. International Journal for Numerical and Analytical Methods in Geomechanics, Vol. 7, Issue 4, 1983, p. 469-484.
-
Denoual C., Hild F. A damage model for the dynamic fragmentation of brittle solids. Computer Methods in Applied Mechanics and Engineering, Vol. 183, Issue 3, 2000, p. 247-258.
-
Grange S., Forquin P., Mencacci S., Hild F. On the dynamic fragmentation of two limestones using edge-on impact tests. International Journal of Impact Engineering, Vol. 35, Issue 9, 2008, p. 977-991.
-
Forquin P., Erzar B. Dynamic fragmentation process in concrete under impact and spalling tests. International Journal of Fracture, Vol. 163, Issue 2, 2010, p. 193-215.
-
Saadati M., Forquin P., Weddfelt K., Larsson P., Hild F. Granite rock fragmentation at percussive drilling – experimental and numerical investigation. International Journal for Numerical and Analytical Methods in Geomechanics, Vol. 38, Issue 8, 2014, p. 828-843.
-
Liu H., Kou S., Tang C. Numerical simulation of the rock fragmentation process induced by indenters. International Journal of Rock Mechanics and Mining Sciences, Vol. 39, Issue 4, 2002, p. 491-505.
-
Wang S., Sloan S., Liu H., Tang C. Numerical simulation of the rock fragmentation process induced by two drill bits subjected to static and dynamic (impact) loading. Rock Mechanics and Rock Engineering, Vol. 44, Issue 3, 2011, p. 317-332.
-
Saksala T. Numerical modelling of bit–rock fracture mechanisms in percussive drilling with a continuum approach. International Journal for Numerical and Analytical Methods in Geomechanics, Vol. 35, Issue 13, 2011, p. 1483-1505.
-
Saksala T. 3D numerical modelling of bit–rock fracture mechanisms in percussive drilling with a multiple-button bit. International Journal for Numerical and Analytical Methods in Geomechanics, Vol. 37, Issue 3, 2013, p. 309-324.
-
Chiang L., Elias D. A 3D FEM methodology for simulating the impact in rock-drilling hammers. International Journal of Rock Mechanics and Mining Sciences, Vol. 45, Issue 5, 2008, p. 701-711.
-
Thuro K., Schormair N. Fracture propagation in anisotropic rock during drilling and cutting. Geomechanics and Tunnelling, Vol. 1, Issue 1, 2008, p. 8-17.
-
Walsh J. The effect of cracks on the compressibility of rocks. Journal of Geophysical Research, Vol. 70, 1965, p. 381-389.
-
Walsh J. The effect of cracks on the uniaxial compression of rock. Journal of Geophysical Research, Vol. 70, 1965, p. 399-411.
-
Lawn B., Marshall D. Nonlinear stress-strain curves for solids containing closed cracks with friction. Journal of the Mechanics and Physics of Solids, Vol. 46, 1998, p. 85-113.
About this article
This research was supported by the State Key Laboratory of High Performance Complex Manufacturing (zzyjkt2015-03).

