Abstract
In this paper the applications of group delay in seismic vibration signals analysis are discussed. A method which bases on the autoregressive model with sliding-window is used to track volatility of signal’s properties in time. The analysis of time-frequency maps of group delay can be used in a process of distinguishing signals of different characteristics. Moreover, the method is robust for the different parameters of the sliding-window AR model. In the article applications of the time-frequency maps of group delay in a signal segmentation and clustering are also discussed. In seismic analysis an ability to distinguish signals with different seismic nature is very important, especially in case of safety in copper-ore underground mines. Creation of tools for revealing the origin of vibration will have positive impact on evaluation of hazard level.
1. Introduction
The monitoring of seismic activity is one of the elements of preventing hazard in copper-ore mines. The knowledge about hypocenter, intensity and scale of the seismic event is crucial to evaluate level of hazard. But firstly we should get information about nature of the event. Sensors from the seismic monitoring system register not only the strong vibration derived from rock burst, but also from the other sources such as blasting or relaxation of rock. In view of that we need a tool for distinguishing different types of signals.
In previous works, various methods were proposed to determine characteristic behavior of the vibration events. For instance, time-varying attributes of amplitude spectrum has been examined for rotating machinery diagnostics [1-3], structural health monitoring [4, 5] or seismic signal analysis [6-10]. Such amplitude spectrum might be estimated using autoregressive model fitted to the considered data. The use of autoregressive modeling requires stationarity of examined time series. In case of seismic signals this assumption is not satisfied. In view of that we should analyze time-frequency maps to detect changes of signals nature. A tool which links autoregressive modeling and time-frequency domain is called ARgram [11] – it is a set of amplitude responses of autoregressive model fitted to sliding-window. Thus, the ARgram might be considered as a tool used in order to track seismic vibration properties. If several ARgrams have similar structures, the phase-related characteristics might reveal new properties of the signal. One of the phase-related attributes is group delay, which is derivative of phase spectrum with respect to frequency.
The group delay is widely used in signal processing, especially in application to speech signals [12]. Many algorithms using in speech segmentation are based on examination of group delay properties [13]. Interesting applications one can also find in seismology. For instance, modified version of group delay was used in research on seismic ground-motion and estimation of side effects [14].
In this paper we focus on the time-varying properties of the group delay and its application to seismic vibration signals acquired in the cooper-ore underground mine. The database includes different types of signals associated with blasting or rock burst. The first group of signals contains records with sequence of blasting, which are visible on the seismogram as a multi-event signal. Therefore, we are looking for an attribute which can separate each event from the multi-pulse signal. Moreover, the goal is to find properties for distinguishing different groups of the events.
2. Methodology
We focus on the group delay response and visualize its volatility by the time-frequency map. Mathematically, the group delay is derivative of phase spectrum with respect to frequency:
where Θ(ω) is phase response and ω is frequency.
The numerical computation of group delay is based on simple algorithm using Fast Fourier Transform (FFT). Using the Fourier transform, the signal in frequency domain can be described by formula:
where G(ω) – amplitude response, Θ(ω) – phase response. By taking logarithm on the both sides of Eq. (3) we obtain following decomposition:
Then we differentiate Eq. (3):
From the simple properties of logarithmic function’s derivative, we get:
where H(ejωT) is FFT from the signal and H'(ejωT) derivative of the FFT.
After several elementary transformations we obtained the numerical formula for group delay using Fast Fourier Transform.
Fig. 1Location of accelerometer in copper-ore mine
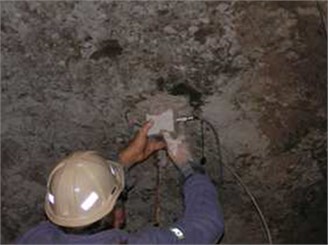
In this article analysis were made using the seismic vibration signals acquired in the copper-ore underground mine. Accelerometer used in the experiment measures vibration acceleration in range of 0.001-100 m/s2 with frequency range 0.5-400 Hz. Sampling frequency was set to 1250 Hz. Sensor registered signal from tree directions, but in this paper we include results only for one of them. The acquisition system which was installed on the mining corridor roof is shown in Fig. 1. Initially the distance between accelerometer and mining face was 20 meters, but it was changing due to advance of mining works.
Now we go into the explanation of using group delay response in seismic vibration signals analysis. The amplitude spectra for examined signals are time-varying what means that the assumption of stationarity is not fulfilled in this case. To fit the autoregressive (AR) model to stationary signal we use a method of sliding-window. An AR model is fitted to each 60 samples in consecutive and overlapping windows. The coefficients of AR model, which were estimated by Yule-Walker equations [15], were used to create a time-frequency maps of group delay. The algorithm of generating time-frequency maps of group delay is described in details in [16].
In our analysis, the AR model of order 10 is fitted to each window, because of the number of significant local maxima at the amplitude spectrum. An overlap of windows was set to 59 samples; thus 59 samples are the same for the two consecutive windows. Such choice of parameters provides detailed information of even little changes in signal properties. Results of applying the algorithm to a two-event seismic signal are presented at Fig. 2.
Fig. 2The algorithm of generating time-frequency maps of group delay: a) time series of signal, b) time-frequency map of group delay (fitted AR model of order 10), c) time-frequency map of group delay (fitted AR model of order 10), black area is connected with positive group delay and white area with negative values of group delay
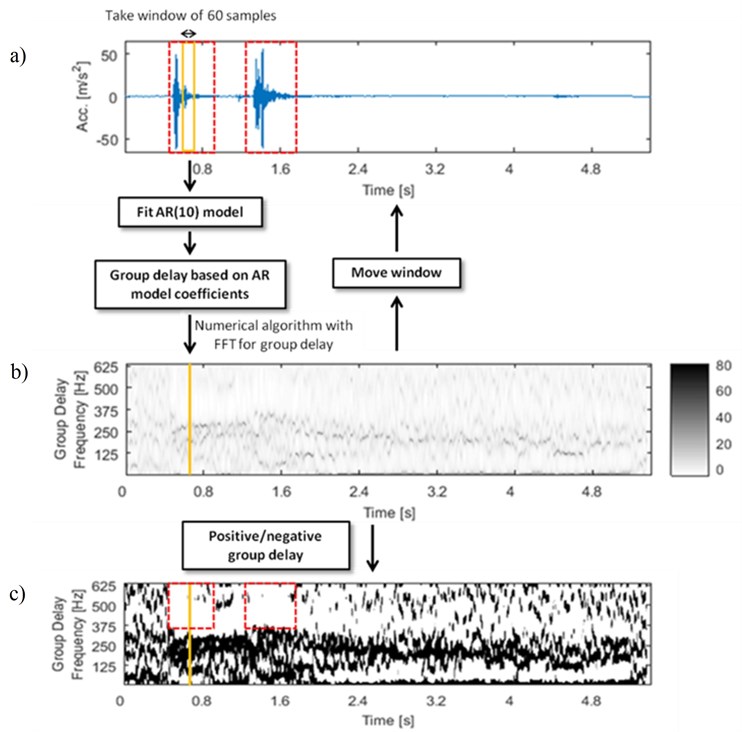
An attribute characteristic for each seismic signal is number and length of the ridges at time-frequency map, which indicates accumulation of high values group delay. The crucial thing is also location of the ridges at the time-frequency map. The parameters described above provide information of time-varying properties of signal in phase response domain. Negative values of group delay are connected with fast increase of phase response of the signal. In Fig. 2(c) we can notice that negative group delay (white area in red dashed line boxes) is connected with strong seismic event.
3. Robustness to parameters changes
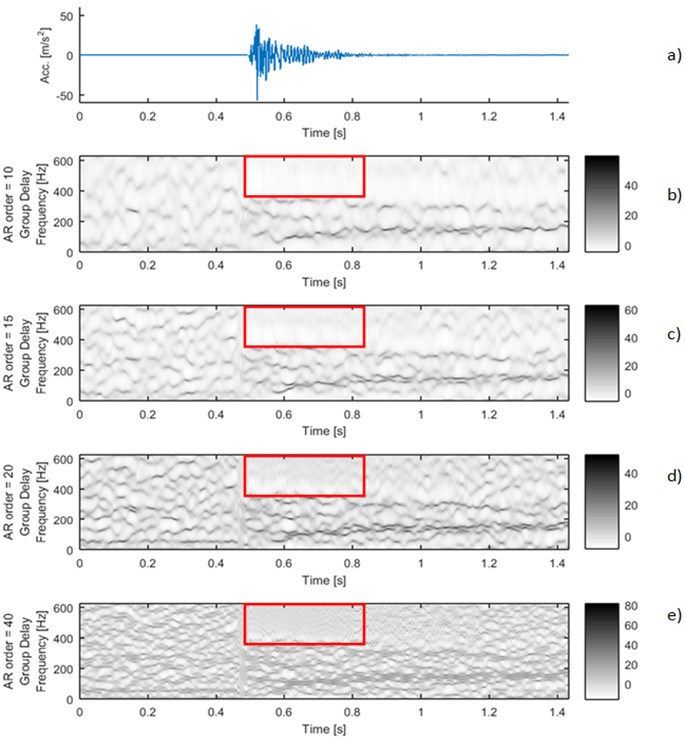
The main advantage of analysis time-frequency map of group delay is robustness to parameters changes of the proposed method. For the different orders of autoregressive model one can still obtain clear maps with the ridges of the high group delay values (Fig. 3). Brighter regions with lower values are also visible on the maps (Fig. 3). They are directly related to location of the strong seismic event on the time series. This property might be used in the clustering or the process of multi-event signals segmentation.
Differences in length of sliding-window in AR model do not have significant influence on the result. Elongation of window leads to smooth the ridges on the time-frequency map of group delay. Despite of this, the number of ridges for fixed AR order is the same.
Fig. 3Signal 4_45: a) time series and time-frequency maps of group delay for different AR orders: b) 10, c) 15, d) 20 and e) 40. In the red boxes characteristic regions of the group delay map are marked
4. Application to signal segmentation
Seismic signals recorded during the process of blasting in copper-ore underground mine are multi-pulse due to sequence of blasting pattern. For this kind of signals, we should use segmentation method as preprocessing for detection of characteristic properties which are responsible for different events. There are many ways for signal segmentation [17-19]. In the literature one can find several methods based on time-varying modeling. One of the most recent are using adaptive Schur filter [17] and time-frequency decomposition [18, 20, 21].
Applying simple algorithm of segmentation based on threshold on the envelope of the signal we did not obtain acceptable results. Two-events signal 3_7 (Fig. 4(a)) was divided into several dozen segments (Fig. 4(b)) which is inadequate segmentation in this case.
Fig. 4Signal 3_7: a) time series with envelope (red line) and threshold equal 0.5 m/s2 (green line), b) simple segmentation based on threshold on the envelope. Time-frequency maps of group delay for different AR orders: c) 10, d) 15, e) 20 and f) 40
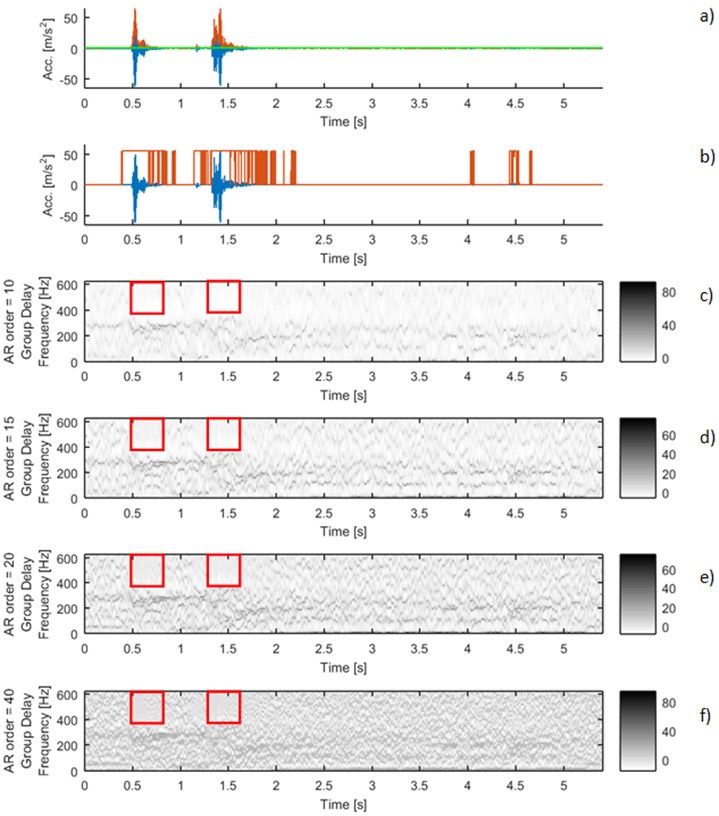
A novel method of segmentation might be found on time-frequency maps of group delay. Changes of structure on the time-frequency maps indicate start of a new seismic event. It is clearly visible at Fig. 4. where time-frequency maps of group delay for different AR orders are shown. The red boxes mark region where the structure of map is changed. The ridges are cumulated at lower frequencies and for the higher frequencies we observe bright areas, which point to lower values of group delay. This event is strongly connected with beginning of new seismic event observable at time series, as well.
Moreover, the location of the characteristic bright regions at the time-frequency map is invariant to different orders of autoregressive model (Figs. 4(c)-4(f)). This proves the robustness to the parameters changes. It could be a basis for new algorithm for multi-pulse signal segmentation.
As was explained in chapter 2. the crucial parameter for the segmentation process will be location of negative values of group delay at the time-frequency map (see Fig. 2(c)). The group delay considers information only of the phase response change with respect to the frequency. Therefore, it should be emphasized that in the proposed method there is no impact of amplitude response to segmentation results.
5. Application to signal clustering
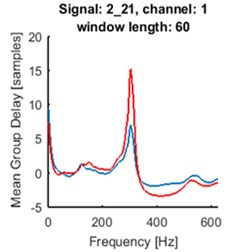
One of the statistics distinguishing different signals is a function of frequency, which indicates mean value of the group delay time-frequency map with respect to time:
where T – length of the signal, wl – window length, Dt(ω) – value of group delay for the frequency ω in time t.
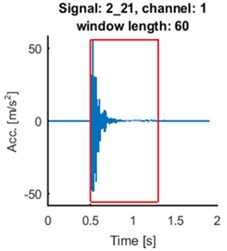
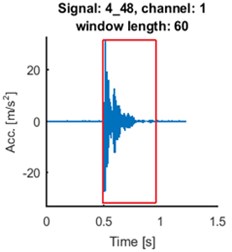
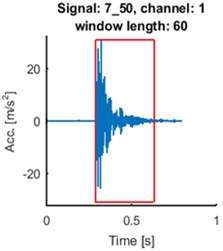
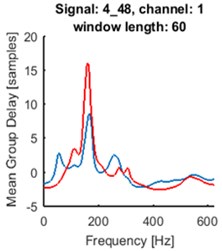
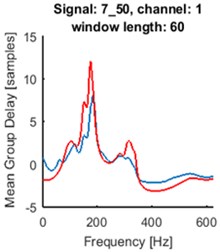
Fig. 5Time series of the signals (blue time series at upper panels) and mean of time-frequency map of group delay with respect to time (blue lines at lower panels) for signals 2_21: a) and d), 4_48: b) and e), 7_50: c) and f). AR(10) model with sliding-window length of 60 was fitted. Time series for the segments are marked by red box (upper panels). Their mean group delay function is colored by red (lower panels)
a)
b)
c)
d)
e)
f)
As one can see at Fig. 5. the seismic event does not start at the beginning of registered signal. Separated events are marked with red boxes at upper panels. We made the same analysis for the selected parts of the signals. The results are plotted in red at the lower panels at Fig. 5. Peaks at plots of mean group delay for segments are higher. It is caused by elimination of noisy regions from the time-frequency map of group delay.
For all signals from the database one can distinguish groups of signals characterized by similar patterns of mean group delay function. It might have application in clustering of seismic events. The main goal is to systemize signals in groups related to different origin of signal, which can help in future analysis.
6. Conclusions
The analysis of the time-varying behavior of group delay response has promising applications in many domains of seismic signals processing. The main advantage of the proposed method is that we can distinguish signals with similar time series and amplitude response structures. The patterns at the time-frequency map of group delay are robust for the parameters changes, what is preferable attribute in algorithms for distinguishing signals. Time-frequency map of the group delay has also characteristic structure. For the strong seismic event visible at the seismogram, the brighter regions appeared at the time-frequency map. This kind of changes are useful for the segmentation process. In this paper the promising solutions for clustering were also presented. The mean group delay function with respect to time has different shape for each signal, but location of peaks or the shape of the plot are similar for groups of examined seismograms. Due to distinguishing properties of the mean group delay function, it might be one of the criteria in clustering process. A novel method of signals analysis related to group delay is therefore a promising tool for signal processing.
References
-
Makowski R., Zimroz R. Parametric time-frequency map and its processing for local damage detection in rotating machinery. Key Engineering Materials, Vol. 588, 2013, p. 214-222.
-
Makowski R., Zimroz R. New techniques of local damage detection in machinery based on stochastic modelling using adaptive Schur filter. Applied Acoustics, Vol. 77, 2014, p. 130-137.
-
Thanagasundram S., Schlindwein F. S. Autoregressive order selection for rotating machinery. International Journal of Acoustics and Vibration, Vol. 11, Issue 3, 2005, p. 144-154.
-
Kopsaftopoulos F. P., Fassois S. D. Vibration based health monitoring for a lightweight truss structure: experimental assessment of several statistical time series methods. Mechanical Systems and Signal Processing, Vol. 24, Issue 7, 2010, p. 1977-1997.
-
Mailhes C., Martin N., Sahli K., Lejeune G. Condition Monitoring Using Automatic Spectral Analysis. Structural Health Monitoring. DEStech Publications, Inc., 2006, p. 1316-1323.
-
Steeghs P., Drijkoningen G. Time-frequency analysis of seismic reflection signals. Proceedings of the Acoustics, Speech, and Signal Processing, Washington, DC, USA, Vol. 5, 1996, p. 2972-2975.
-
Dong Y. F., Li Y. M., Xiao M. K. Unscented Kalman filter for time varying spectral analysis of earthquake ground motions. Applied Mathematical Modelling, Vol. 33, Issue 1, 2009, p. 398-412.
-
Gabarda S., Cristóbal G. Detection of events in seismic time series by time-frequency methods. Signal Processing, IET, Vol. 4, Issue 4, 2010, p. 413-420.
-
Kozin F. Autoregressive moving average models of earthquake records. Probabilistic Engineering Mechanics, Vol. 3, Issue 2, 1988, p. 58-63.
-
Thostehim D. Some autoregressive models for short-period seismic noise. Bulletin of the Seismological Society of America, Vol. 65, Issue 3, 1975, p. 677-691.
-
Padovese L., Martin N., Millioz F. Time-frequency and time-scale analysis of Barkhausen noise signals. Proceedings of the Institution of Mechanical Engineers. Part G: Journal of Aerospace Engineering, Vol. 223, Issue 5, 2009, p. 577-588.
-
Murthy H. A., YegnanarayanaB. Group delay functions and its applications in speech technology. Sadhana – Academy Proceedings in Engineering Sciences, Vol. 36, Issue 5, 2011, p. 745-782.
-
Prasad V. K., Nagarajan T., Murthy H. A. Automatic segmentation of continuous speech using minimum phase group delay functions. Speech Communication, Vol. 42, Issues 3-4, 2004, p. 429-446.
-
Beauval C., Bard P.-Y., Moczo P., Kristek J. Quantification of frequency-dependent lengthening of seismic ground-motion duration due to local geology: applications to the Volvi Area (Greece). Seismological Society of America, Vol. 93, Issue 1, 2003, p. 371-385.
-
Brockwell P. J., Davis R. A. Time Series: Theory and Methods. Springer Science and Business Media, 2013.
-
Polak M., Obuchowski J., Madziarz M., Wyłomańska A., Zimroz R. Differences in time-varying group delay of seismic signals. Vibroengineering Procedia, Vol. 6, 2015, p. 206-211.
-
Hossa R., Makowski R., Zimroz R. Automatic segmentation of seismic signal with support of innovative filtering. International Journal of Rock Mechanics and Mining Sciences, 2015, (in Press).
-
Zimroz R., Madziarz M., Żak G., Wyłomańska A., Obuchowski J. Seismic signal segmentation procedure using time-frequency decomposition and statistical modelling. Journal of Vibroengineering, Vol. 17, Issue 6, 2015, p. 3111-3121.
-
Palivonaite R., Lukoseviciute K., Ragulskis M. Algebraic segmentation of short nonstationary time series based on evolutionary prediction algorithms. Neurocomputing Vol. 121, 2013, p. 354-364.
-
Burdzik R., Konieczny Ł., Figlus T. Concept of On-Board Comfort Vibration Monitoring System for Vehicles. Activities of Transport Telematics, CCIS Vol. 395, Springer, Heidelberg, 2013, p. 418-425.
-
Burdzik R., Konieczny Ł. Application of Vibroacoustic Methods for Monitoring and Control of Comfort and Safety of Passenger Cars. Mechatronic Systems, Mechanics and Materials II, Solid State Phenomena, Vol. 210, 2014, p. 20-25.
About this article
This article is the result of teamwork. Marta Polak prepared a manuscript and implemented the algorithm. Jakub Obuchowski made conception of the methodology. Maciej Madziarz acquired and interpreted the data. Agnieszka Wyłomańska examined utility of proposed method in application to segmentation and clustering. Radosław Zimroz provided the mining knowledge and revised the article critically for important intellectual content.
