Abstract
We investigated the movement of particles in screening process over the sieve plate of a linear vibrating screen using the Discrete Element Method (DEM). The behavior of particles which is affected by a series of vibrational parameters including amplitude, frequency and vibration direction angle determining screening performance. This paper centers on particles looseness by analyzing the looseness coefficient and looseness rate. The relationships between the looseness coefficient, looseness rate and vibration parameters were profoundly discussed. Mathematical models relating looseness coefficient to time were established using the least squares method. An experimental platform which combines high-speed camera system with experimental prototype of vibrating screen was designed. The research made a more in-depth investigation of particles’ movements and analysis of particle looseness. Physical experiments were used to verify the reliability of simulation results. Finally, we would come into the following conclusions: high frequency and large amplitude make particles obtain more energy to be active and the average distances among particles get larger slowly. On the contrary, at low frequency and amplitude, the looseness coefficient and looseness rate were relatively low. When the amplitude approaches 2.7 mm, the frequency is about 34 Hz and the vibration angle is around 42 degrees, the looseness ratio produces better performance. The paper offered insights to the design and manufacturing of vibrating screen.
1. Introduction
Vibration sieve is the most commonly used screening machinery in engineering field. The cognition of the complicate sieving process is incomplete due to the separation process involving interactions of thousands of particulates. The motion of the material that is affected by the vibration parameters determines the screening performance [1, 2]. In order to improve the imperfect screening theory, the separation process is divided into four parts: looseness, stratification, percussion and penetration. Numerical modeling using DEM has been proven to be a useful tool to simulate the complex process of sieving phenomenon [3, 4].
Particles loaded in the sieve plate are rebounded. The fine materials pass through large particles, and move to the screen surface. When particles on the screen surface are rebounded, the suitable average distance of them benefit for particles penetration. The process of particles looseness has a direct influence on the particles stratification and penetration. Some particles touch wire screen, and others go through various zones depending on their physical characteristics and the conditions of vibration. Early works only explored particle stratification and penetration in screening process. The process of stratification and penetration has been studied in terms of vibration parameters and structural parameters respectively [5-7]. Mosby used several factors to analyze stratification process and explain materials accumulation phenomenon [8]. Standish deemed that penetration process is a kinetic constant which is related to penetration [9]. Dong presented a numerical study on penetration behavior under different vibration modes [10]. The voids occur among the particles which are rebounded by the sieve plate. These appropriate voids contribute to the particles stratification. Yet few discussion focus on particles looseness. When particles are scattered, the looseness improves the capability of the fine particles to approach to the screening surface. Jiao and Zhao studied the particles screening with DEM simulation, and they furtherly discussed the penetration behavior of particles in a screen plate [11, 12]. Particles are properly dispersed will contribute to particles stratification and penetration.
This paper centers on particles looseness under various single parameter experiments using the Discrete Element Method (DEM). Physical experiments were used to verify the reliability of simulation results. We optimized the screening parameters which influence on screening efficiency in terms of particles looseness. It provides an insight about screening process and a theoretical foundation for designing screening equipment.
2. DEM and 3D-DEM simulation
2.1. Introduction to DEM
It is an improvement that applying the Discrete Element Method (DEM) simulates and analyzes screening process of a linear vibrating screen [13]. The discrete element method that stems from the idea of molecular dynamics, is an explicit numerical method. It simulates the interactions of discrete particles including contact and collision in detail. Consequently, we can get certain information such as particle’s speed, location and so on. The fundamental theory of DEM is suitable for modeling of particle screening process. At a certain time, add up the contact forces acting on each particle, we can get the resultant force and resultant moment. According to Newton’s second law, we can get the following equation for the ith particle:
In the both equations, Xi is the translational distance, ∑F(t) is the resultant force and mi is mass of the ith particle. θi,∑M(t) and Ii are angular displacement, resultant moment and rotary inertia of the ith particle respectively.
2.1.1. 2.2 3D-DEM simulation
In this section, a 3D-DEM model was set up (Fig. 1) to simulate the movements of all particles in screening process. DEM model was proved that it has a good agreement between numerical simulation and experimental results [14].
Fig. 13D-DEM model of vibration screening
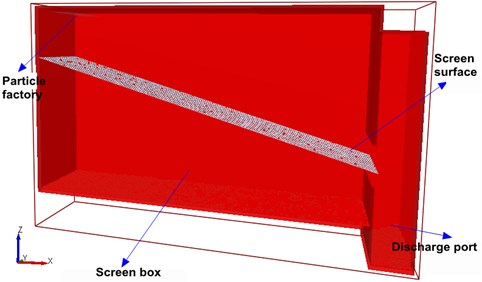
The model consists of screen box, screen surface and particle factory. The screen box is 162 mm in length, 32 mm in width and 80 mm in height. The screen mesh is combined with wire diameter is 0.7 mm and the aperture which is square with side length 1 mm. The particle factory provided the particles which are composed of different sizes. This paper employed a bimodal normal distribution of particles with the standard deviation which is 0.545. The particles consist of approximately spherical sands with mean diameters 0.5 mm and 1.0 mm respectively. The particles generated by the particle factory drop to screen surface under the action of gravity, and then particles will be rebounded when they touch screen surface. The average distances of particles which are rebounded over the screen surface are time-varying. The simulation conditions and parameters are listed in Table 1. There are three groups of parameters in case that each groups of experiment only changed one parameter value while others kept constant have been performed.
Table 1Summary of conditions
Material properties | Poisson’s ratio | Density | Shear modulus |
Particles | 0.3 | 2678 kg/m3 | 23 MPa |
Screen | 0.29 | 7861 kg/m3 | 79.92 GPa |
Collision properties | Coefficient of restitutions | Coefficient of static friction | Coefficient of rolling friction |
Particle-particle | 0.1 | 0.545 | 0.01 |
Particle-screen | 0.2 | 0.5 | 0.01 |
Particle generate rate 50000 particles/s | Screen declination 21° | Screen vibration Sinusoidal translation | Total number 30000 |
Text group Group one | Amplitude (mm) 1.5, 2.55, 3.55, 4.49, 5.7 | Frequency (Hz) 20 | Vibration angle (°) 100 |
Group two | 2.55 | 10, 20, 30, 40, 50 | 100 |
Group three | 2.55 | 20 | 30, 45, 51, 60, 70, 80 |
3. Analyses of the simulation results
3.1. The movement of the screen surface
In order to study the particles rebounded over the screen surface, it is necessary to get the location of the screen surface. Screen surface was driven a sinusoidal translation in the direction of vibration (Fig. 2), the equation of displacement is given as following:
where A is the amplitude moves along the vibrational direction, ω is the circular frequency, t is the time, and φ is the phase angle. The displacement is compartmentalized into Sx (perpendicular to the screen surface) and Sy (parallel to the screen surface), given by:
where β is the vibration direction angle (Fig. 2).
3.2. Definitions of the average distance, looseness coefficient and looseness rate
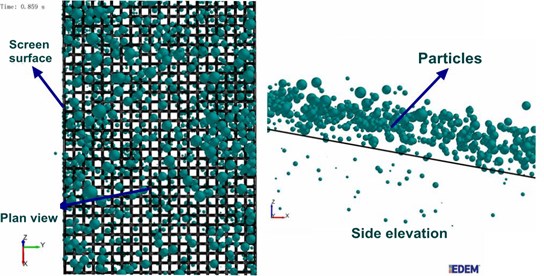
Because of particle-particle and particle-screen interactions over the screen surface, the average distance between two particles is diverse in different vibrational parameters over time. If the distance is too large or too small, the number of particles which penetrate aperture of screen will decrease. The material looseness is a main factor which affect the screening efficiency [15]. Fig. 2 shows a sketch about the side elevation and plan view of vibrating screen. Fig. 3 shows the projection of particles on the vibrating screen in EDEM software. The distance between particle 1 and particle 2 along the X direction is Lx, as well as Ly is the length in Y direction. So the distance length, L1, is given by:
Fig. 2The side elevation and plan view of vibrating screen
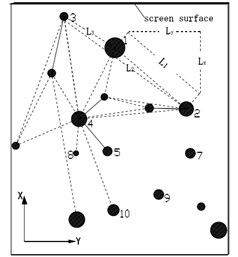
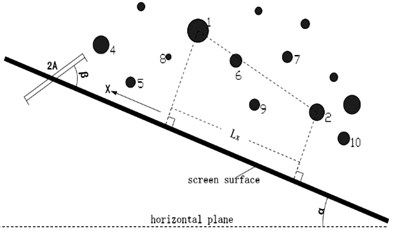
Fig. 3The side elevation and plan view of vibrating screen in EDEM
In this case, we assume that there are a total of i particles rebounded over screen surface, and we can get N lines by connecting any two particles’ centers. The average distance LA is expressed as follows:
In addition, in order to describe the looseness accurately, this paper defined a looseness coefficient. The looseness coefficient C is given by:
where DA is the mean diameter of particles rebounded over screen surface. The looseness rate is the derivative of looseness coefficient with respect to time:
where vc is the looseness rate which indicates the tendency of particles being scattered reasonably, in other words, whether a favorable looseness or not; ˙C the derivative of C with respect to time.
3.3. Calculations and discussions
3.3.1. Looseness coefficient: change over time
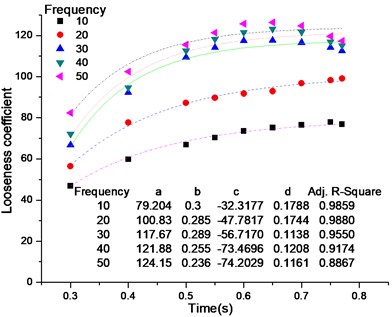
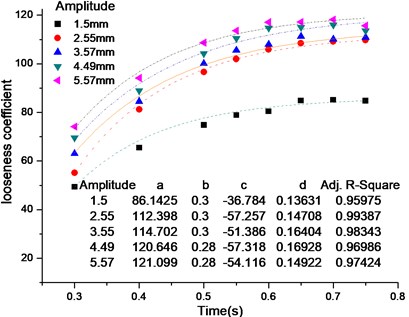
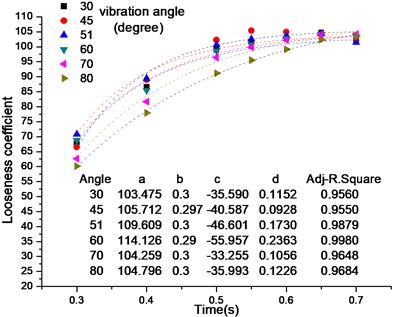
During the simulation of the screening process, the particles which dropped from the particle factory took 0.3 s to move to the end of screen surface and took approximately 1.3 s to complete the whole screening. The period from 0.3 to 0.65 s was used to study the process of particles looseness because, in the meantime, particles flowed over the whole screen surface and the condition of particles looseness is an easy experimental phenomenon to observe. When particles were rebounded, the average distance between particles increased gradually and then remained stable. The period of looseness was divided into 0.3, 0.4, 0.5, 0.55, 0.6, and 0.65 s, in particles looseness process, the simulation data were used to obtain the change in looseness coefficient over time. A fitting function was given by:
where t is time, in seconds; y the looseness coefficient; and a, b, c, and d change with the vibrational parameters. The fitting function curve of looseness coefficient to time is shown in Fig. 4. Those figures and curves showed that the looseness coefficient increases with the course of time and it has little change after about 0.65 s.
Fig. 4Looseness coefficient vs. time
a) Looseness, parameterized by frequency
b) Looseness, parameterized by amplitude
c) Looseness, parameterized by vibration direction angle
Only change one value of one parameter while other parameters keep constant. Fig. 4(a) and 4(b) show that the looseness coefficient increase with amplitude or frequency increase gradually. And the looseness coefficient is greater than 80, particles were sufficiently scattered. Amplitude impacts on the kinetic energy of the particles rebounded over screen surface and frequency mainly influences the bounce state of particles rebounded over screen surface. Large amplitude and high frequency were easy to make the particles full of the screen-box, and the particles were bounced higher and further easily. It indicates that particles have less chance to hit screen surface. Fig. 4(c) shows there is little effect on the energy of particles. The diversities in looseness coefficient is small in different vibration direction angles.
Table 2Mean values of looseness rate for different conditions
Frequency (Hz) | 10 | 20 | 30 | 40 | 50 | |
Mean vc | 74.3108 | 101.6911 | 137.1371 | 133.4182 | 104.9135 | |
Amplitude (mm) | 1.5 | 2.55 | 3.55 | 4.49 | 5.57 | |
Mean vc | 92.172 | 133.165 | 121.953 | 119.6222 | 108.1037 | |
Vibration angle (°) | 30 | 45 | 51 | 60 | 70 | 80 |
Mean vc | 90.6347 | 112.0823 | 94.3309 | 105.6343 | 108.6569 | 111.2023 |
3.3.2. Looseness rate for different vibration parameters
During screening process, the actual rate of looseness is hard to calculate. According to Eq. (10), the looseness rate is obtained as the derivative of Eq. (11):
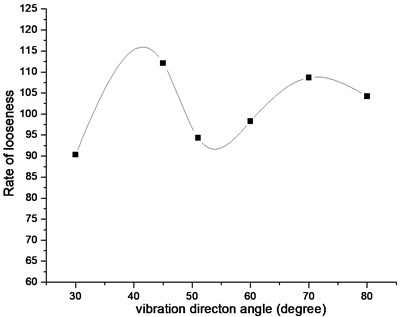
By using the mean, vc, a statistical analysis between a looseness and a vibration parameter is given in Table 2. As well as the relationships among them were represented in Fig. 5, Fig. 6 and Fig. 7. In these figures, neither small values nor large values of parameters are beneficial to looseness. Fig. 5 and Fig. 6 depict that when amplitude is close to 2.7 mm and frequency approaches 34 Hz, the looseness rate reaches maximum. The reason accounts for those phenomena is that particles are fully scattered and reach stable state quickly. This two curves illustrate that the high frequency and large amplitude make particles obtain more energy to be active and the average distances get larger gradually. On the contrary, at low frequency and amplitude, the looseness coefficient and looseness rate are relatively low. In vibration direction simulation, two convex spots around 42 degrees and 70 degree depicted in the curve of Fig. 7. The degree of 42 produces the best performance.
Fig. 5Looseness rate vs. amplitude
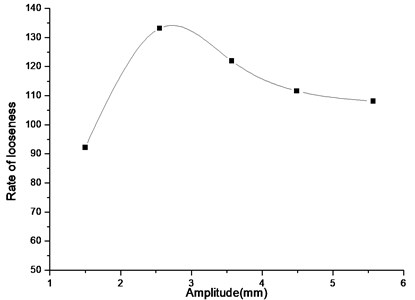
Fig. 6Looseness rate vs. frequency
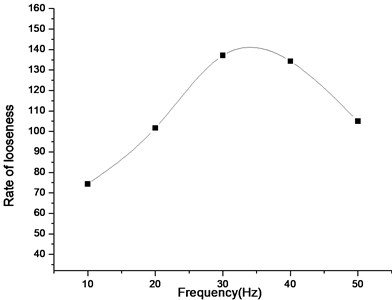
When the amplitude approaches 2.7 mm, the frequency is about 34 Hz and the vibration angle is around 42 degrees, the looseness ratio produces better performance. In order to improve screening efficiency of vibrating screen, we optimized the screening parameters which influence on screening efficiency in terms of particles looseness. In next part, physical experiments were used to verify the reliability of simulation results.
Fig. 7Looseness rate vs. vibration direction angle
4. Experimental setup and analysis
4.1. Experimental setup
In this section, Sands (Fig. 8) were selected as raw materials. The shock type-based vibrating screen was used to separate different sized particles for matching the particle size distributions in simulation. The electric motor transmits power to the spindle through the drive plates. Then the worm gear located in the spindle drives the cam shaft, causing the vibration that drives the screen pedestal for both rotary and vibrating motions. Next, different sized particles were obtained through the screen meshing (Fig. 8).
Fig. 8Experimental particles with different size distributions
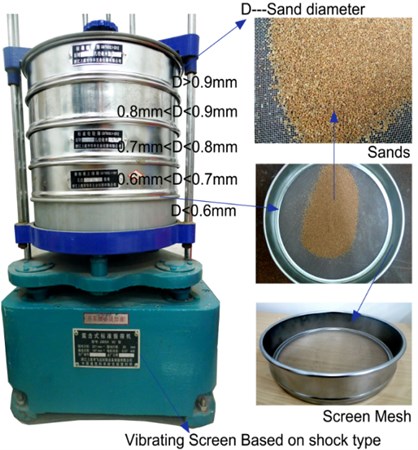
Fig. 9The particle movements are recorded by high-speed camera system and experimental prototype
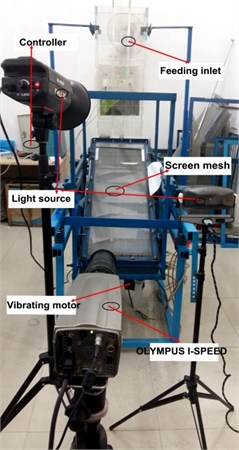
Fig. 9 presents an experimental platform for tracking particles’ trajectory by using high-speed camera system and experimental prototype. Images of particles’ motions during the screening process were obtained and image quality was enhanced effectively. The means of the image processing including background elimination, image filter and binary processing. The combined and adjustable screen is an innovative design. Many screening parameters which under the influence of vibrational parameters can be conducted [2]. In this paper, the average distance and rate of looseness were carried out with different vibration frequency.
4.2. Experimental analysis and results
The purpose of these experiments is to obtain the relationship between two-dimensional image and three-dimensional information. From Fig. 10(a) three-dimensional information of calibration plate in world coordinate system by high-speed camera. Two-dimensional calibration plates’ images restore the three-dimensional information. By Matlab software the two-dimensional coordinates with image processing. Because of the large, complex and traditional calibration algorithm, this paper comes up with the camera calibration technique on account of neural network. The method is that the neuron conveys network information, network learning which decides network weights of neuron. The system sets up the mapping relationship between space point and image point in the range of allowable error. From Fig. 11, in the first image, the particles over the screening surface are shot. By image processing and BP neural network, three-dimensional coordinates were obtained.
Fig. 10Camera calibration process
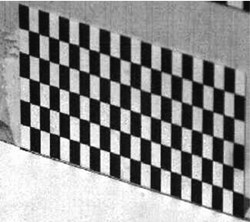
a) Calibration plate shooting
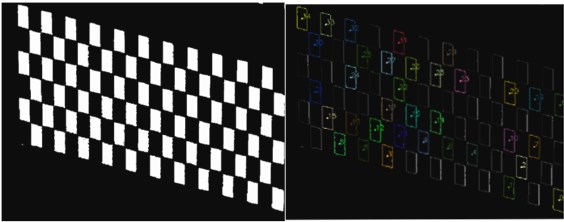
b) Program processing of effective data points
Fig. 11Get particles coordinates
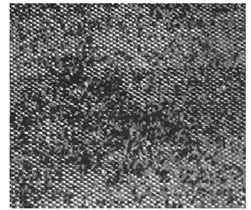
a) Grayscale image
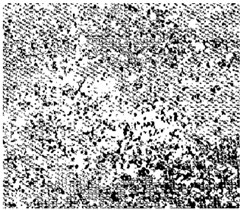
b) Binary image
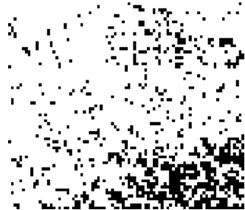
c) Coordinates of particles
4.3. Experimental results and comparison
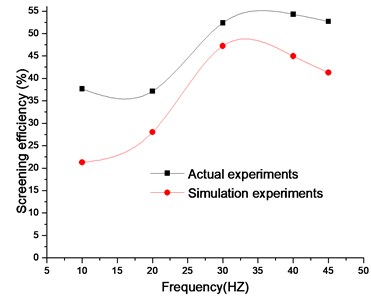
As numerical simulation mainly concerns collision properties, material properties, the size of vibrating screen and input quantity cannot match up with laboratory scale vibrating screen. There is a certain gap in the average distance among particles and rate of looseness between simulations and experiments. Cleary explores the critical influence of particle shape on granular system behavior [16-18]. Also, how to comprehensively and systematically describe the morphology of random particles reduces the gap. The average distance among particles is changed in different vibration frequency with time (Fig. 12). The same as Fig. 4(a), in some time the distance keeps stable. Meanwhile, when the frequency is about 30 Hz, the rate of looseness reaches the top as shown in Fig. 13. The screening efficiencies slightly differ (Fig. 14), however their screening principles are consistent. It indicates that we can understand the actual screening principle and looseness using numerical simulation.
Fig. 12Looseness distance under different frequencies with time
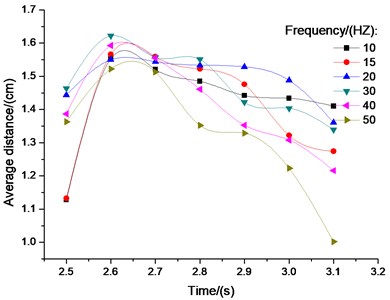
Fig. 13Average distance and looseness coefficient different frequencies with time
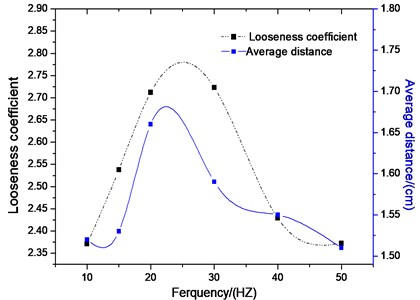
Fig. 14Comparison of experimental and simulation results
5. Conclusions
1) The looseness coefficient and looseness rate were defined. The ratio of the average distance to average diameter of particles above screening surface and the time derivative of the looseness coefficient were used to evaluate performance of looseness.
2) The relationships between vibration parameters and looseness coefficient have been profoundly discussed and the fitting models for looseness were established. The results showed the looseness coefficient tended to be stable after 0.65 s. The period from 0.3 to 0.65 s was used to study the process of looseness because particles swarmed over the whole screen length and the looseness is obvious. Unlike amplitude and frequency, vibration direction angle has a slight effect on the average distance of particles. The relationships between vibration parameters and looseness rate also were conducted.
3) This paper presents an experiment platform which combine high-speed camera system with experimental prototype of vibrating screen. The research made a more in-depth investigation of particles’ movements and analysis of particle looseness. Physical experiments were used to verify the reliability of simulation results. We optimized the screening parameters which influence on screening efficiency in terms of particles looseness. When the amplitude approaches 2.7 mm, the frequency is about 34 Hz and the vibration angle is around 42 degrees, the looseness ratio produces better performance. We optimized the screening parameters which influence on screening efficiency in terms of particles looseness. It provides an insight about screening process and a theoretical foundation for designing the screen equipment.
References
-
Jiao Hongguang, Ma Jiao, Zhao Yuemin Study on the numerical simulation of batch sieving process. Journal of Coal Science and Engineering, Vol. 12, 2006, p. 80-83.
-
Li Z. F., Tong X., Zhou B., Wang X. Y. Modeling and parameter optimization for the design of vibrating screens. Minerals Engineering, Vol. 83, 2015, p. 149-155.
-
Webb C., Pandiella S. S., Campbell G. M. Discrete particle motion on sieves-a numerical study using the DEM situation. Powder Technology, Vol. 133, Issue 3, 2003, p. 190-202.
-
Chen Yanhua, Tong Xin Application of the DEM to screening process: a 3D simulation. Mining Science and Technology, Vol. 19, 2009, p. 493-497.
-
Subasinghe G. K. N. S., Schaap W., Kelly E. G. Modeling the screening process: a probabilistic approach. Powder Technology, Vol. 59, Issue 1, 1989, p. 37-44.
-
Xiao Jianzhang, Tong Xin Particles stratification and penetration of a linear vibrating screen by the discrete element method. International Journal of Mining Science and Technology, Vol. 22, 2012, p. 357-362.
-
Jansen M. L., Glastonbury J. R. The size separation of particles by screening, Powder Technology, Vol. 1, Issue 6, 1968, p. 334-343.
-
Mosby J. Investigation of the Segregation of Particulate Solids with Emphasis on the Use of Segregation Testers. Ph.D. Thesis, Telemark College, Norway, 1996.
-
Standish N., Bharadwaj A. K., Hariri-Akbari G. A study of the effect of operating variables on the efficiency of a vibrating screen. Journal of Powder Technology, Vol. 48, 1986, p. 161-172.
-
Dong Hailin, Liu Chusheng, Zhao Yuemin Influence of vibration mode on the screening process. International Journal of Mining Science and Technology, Vol. 23, 2013, p. 95-98.
-
Jiao Hongguang, Zhao Yuemin Screen simulation using a particle discrete element method. Journal of China University of Mining and Technology, Vol. 36, Issue 2, 2007, p. 232-236.
-
Jiao Hongguang, Zhao Yuemin, Wang Quanqiang Numerical study of collision and penetration behavior between particles and screen plate. Journal of China University of Mining and Technology, Vol. 16, Issue 2, 2006, p. 137-140.
-
Cundall P. A., Strack O. D. A discrete numerical model for granular assemblies. Geotechnique, Vol. 29, 1979, p. 47-65
-
Dong K. J., Yu A. B., Brake I. DEM simulation of particle flow on a multi-deck banana screen. Minerals Engineering, Vol. 22, 2009, p. 910-920.
-
Zhang E. L., et al. Study on loose mechanism of vibrating screen based on DEM. Mining and Processing Equipment, 2012, p. 67-70, (in China).
-
Cleary P. W. DEM prediction of industrial and geophysical particle flows. Particuology, Vol. 8, 2010, p. 106-118.
-
Cleary P. W., Sinnott M. D., Morrison R. D. Separation performance of double deck banana screens. Part 2: quantitative predictions. Minerals Engineering, Vol. 22, Issue 14, 2009, p. 1230-1244.
-
Cleary P. W., Sinnott M. D. Simulation of particle flows and breakage in crushers using DEM. Part 1: compression crushers. Minerals Engineering, Vol. 74, 2015, p. 178-197.
Cited by
About this article
The authors gratefully acknowledged the support from the National Natural Science Foundation of China (51175190) and Young Teachers’ Education in Fujian Province Department of Education Scientific Research Projects (JA15331).

