Abstract
Comparing the frequency spectrum distributions calculated from several successive frames, the change of the frequency spectrum of speech frames between successive frames is larger than that of the ship-radiated noise. The aim of this work is to propose a novel speech detection algorithm in strong ship-radiated noise. As inaccurate sentence boundaries are a major cause in automatic speech recognition in strong noise background. Hence, based on that characteristic, a new feature repeating pattern of frequency spectrum trend (RPFST) was calculated based on spectrum entropy. Firstly, the speech is detected roughly with the precision of 1 s by calculating the feature RPFST. Then, the detection precision is up to 20 ms, the length of frames, by method of frame shifting. Finally, benchmarked on a large measured data set, the detection accuracy (92 %) is achieved. The experimental results show the feasibility of the algorithm to all kinds of speech and ship-radiated noise.
1. Introduction
With the increasing of the economic benefit of the sea, it has been more and more common and frequent to work on a ship, and so conversation and communication are naturally essential. However, the ship-radiated noise is always so strong that it seriously affects the conversation, even it covers the voice completely. Thus, it is necessary to investigate some methods to enhance the speech signal and suppress background ship-radiated noise. But firstly, the speech signal should be detected exactly from the complex ship-radiated noise background.
So many different features defined in the time domain or in frequency domain have been proposed. Such as root mean square energy, zero-crossing [1], perceptual features like timbre and rhythm [3], and dynamism features, etc. And in many other methods, spectral entropy [4], time-frequency analysis [5] and histogram equalization-based features [6] are also used to improve the audio feature extraction and detection techniques. Ozerov et al. developed an accompanying model based on a probabilistic latent component analysis and fixed the model to learn the vocal parts. Also, they trained Bayesian models to adapt the accompaniment model using mel-frequency cepstrum coefficients and Gaussian mixture models [7]. However, the models’ learning techniques require a sufficient amount of non-vocal segments and prior segmentation.
Cooper and Foote focus on the similarity matrix, a two-dimensional matrix which measures the dissimilarity between any two instances of the audio [8]. A Toeplitz de-noising method was proposed using the maximum eigenvalue for the voice activity detection at low SNR scenarios [9]. The similarity matrix can be built from different features, the spectrogram, or other features, as long as similar sounds yield similarity in the feature space. It also can be used in such tasks as audio segmentation, music summarization and beat estimation, and our similarity analysis. A variational mode decomposition based method has been proposed for the instantaneous detection of voiced/non-voiced regions in the speech signals [10]. An evaluation of three different approaches speech detection was discussed on consumer-produced audio [11].
Environmental noise is often chosen as a research subject because of the variety of environments [15-20]. The features mentioned above encounters the following problems: (1) The characteristics of a ship-radiated noise is related to the category and navigation states of a ship, but there are a great variety of ships with different navigation states, which result in changeable values of the same characteristics; (2) The ship-radiated noise is sometimes so strong that the speech signal is covered completely, which is the failure reason of those features defined in the time domain. And on the other hand, the characteristics of speech are also changeable with the different ages and gender of the speakers.
In summary, it has remained a challenge to settle those problems above. One possible solution may be to propose a novel speech detection algorithm in strong ship-radiated noise. In the current work, we aimed to propose a method to improve the detection precision in ship-radiated noise and verify the validity to carry out an empirical experiments and performance evaluation of the proposed algorithms.
2. Material and methods
2.1. Characteristic description of signals
Although there are a great variety of ships and many different navigation states, which result in changeable values of the same characteristics, there exits the fact that ship-radiated noise mainly consists of noises radiated from the running of the mechanical equipment, such as propeller rotation, dynamo etc. Furthermore, for a ship, its shape, propeller rotation, running of all equipment and so on are of the key factors that affect the characteristics of its noise. So if the running state of the key factors changes, the characteristics of a ship-radiated noise will change relevantly, but if the running states of all the key factors keep unchanged or change little, its characteristic will maintain stable. Actually, for the actual situation, all parts or that key factor of a ship always changes very little within a very short interval such as 1s or a shorter interval. So, if the characteristics of a ship-radiated noise is analysed in a very short interval by methods of frequency spectrum trend, it can be concluded that the spectrum trends from successive frames are approximately accordance, just like what is shown in Fig. 1, and that is what we called RPFST.
Fig. 1Spectrum trends of ship-radiated noise, and the distributions of the two curves are just similarity
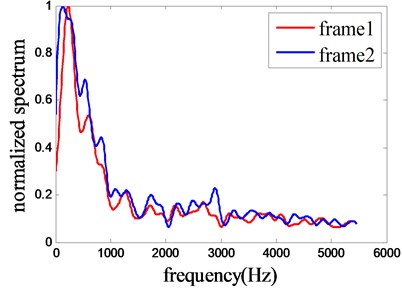
Fig. 2Spectrum trends of speech from successive frames and the distributions of the two curves are quite different
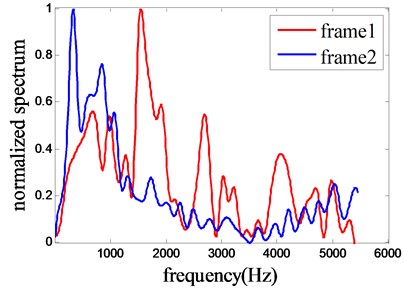
Here, the two spectrum trends are calculated using the same method as that in ship-radiated noise analysis, but their trend curves are explicitly discordance (Fig. 2). For speech signal, phonemes are the minimum pronunciation unit and each of them has their unique and distinct pronunciation, forming their distinct frequency spectrum. Several phonemes constitute words to express speech meanings. So even in a short interval which is just equal to the interval mentioned in ship-radiated noise analysis, the two spectrum trends from successive frames are quite different from each other because of the different phonemes in each frame. And then it can be concluded that the feature RPFST of the speech signal is quite different from that of ship-radiated noise and it can be exploited to be used in the speech detection algorithm.
To further verify the difference RPFST between speech and radiated noise, the similarity matrix built from the frequency spectrum trend just like that in Foot [8] is used, and the result is shown in Fig. 3 and Fig. 4. Here, the grey value is in the range of 0 to 64 to show the similarity more clearly and the higher grey values imply the greater similarity of spectrum trends. The grey values of the whole figure of a ship-radiated noise is mostly higher than that of speech signal which implies the different RPFST.
Fig. 3Similarity matrix of frequency spectrum of noise and speech
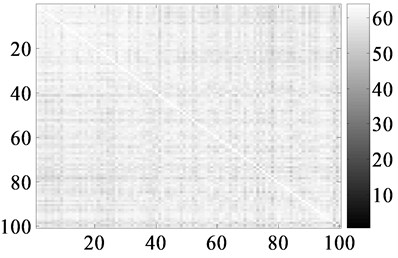
a) Ship-radiatednoise
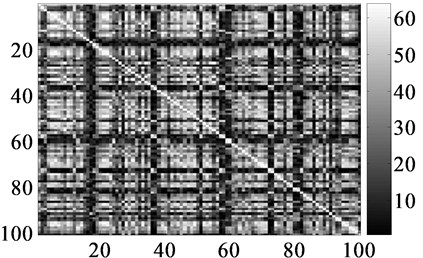
b) Speech signal
2.2. Speech detection algorithm
The entropy H(x) of a discrete random variable x, where x takes values xi with probabilities pi, is defined as:
where ∑ipi=1.
Entropy is a measure of the uncertainty in a given distribution [5]. In current work, the better RPFST of the ship-radiated noise means that the uncertainty in the spectrum trends of each two successive frames in a short interval. Thus, the discrepancy of the entropy value is not bigger. But the uncertainty is quite different from the lack of RPFST, effecting in an unstable value of entropy. Hence, entropy is a good method to calculate the feature RPFST.
2.2.1. Feature extraction
Given a mixed 1-s signal segment x, the magnitude spectrogram F(w) is derived by applying the FFT to each 20 ms frame in the segment. Some fitting method is applied to each column of F(w) to calculate the trend spectrogram f(w) in order to reduce the impact of the simultaneous mutation. Then the entropy of each row of the power spectrogram f2(w) (element-wise square of) is calculated using Eq. (1). The entropy vector En will be obtained. f2(w) is used to enlarge the RPFST difference. The RPFST of x respected by VRPFST is obtained as follows:
for i=1,2,…,n (frequency) where n=N/2-1 and for j=1,2,…,m where m is the number of frames in the given segment.
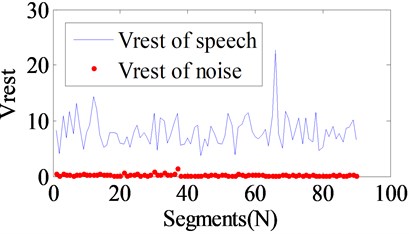
En can express the different RPFST, but it gives different values for segments (Fig. 4). So we use VRPFST instead to express RPFST. VRPFST is sufficiently different between speech and radiated noise segments, and with appropriate thresholds the speech signal can be detected correctly with the precision of 1 s (Fig. 5).
Fig. 4En distributions in one frame
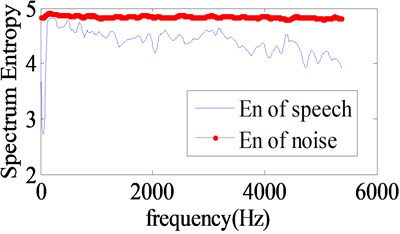
Fig. 5VRPFST distributions of speech signal and ship-radiated noise
2.2.2. Threshold determination and context smoothing
To feed the need of real-time processing, some pattern classifier should be avoided and the feature is limited to be only the VRPFST. So the threshold and the classifying method are obviously significant for the efficiency of the discrimination algorithm.
The threshold determination is based on the histogram of the VRPFST distribution:
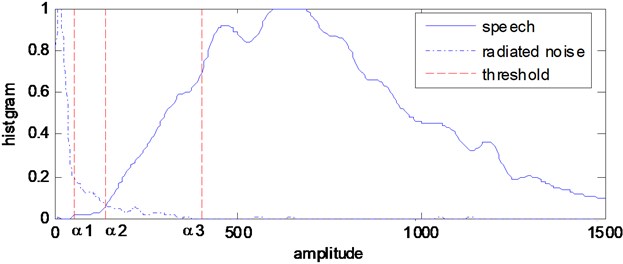
where, nd is the number of VRPFST whose value is equal to d, and n is the total number of the VRPFST. Fig. 6 shows the histogram distribution for the speech signal and radiated noise and all the amplitude multiply by 50 to show clear. The bimodal characteristic is obvious and according to the histogram threshold determination method, we should select α2 which is located in the valley as the threshold and it gives us the best classification accuracy. But after a lot of experiments based on a large measured data set, it is found that some values exceed the threshold and discriminated incorrectly. The three values α1, α2 and α3 are selected as the multiple thresholds and context smoothing is introduced to improve the discrimination accuracy. α1 and α3 are determined based on the experimental results, and when α1=50, α2= 145, and α3=405, a good and stable discrimination result will be get.
Also, speech signals and radiated noises normally last periods of time during the information transfer. Hence, if there is a sudden change in some segment t but its neighbour segments t+1 and t-1 are the same categories. The change is in the most cases caused by some instant noise and should be ignored except that the values of VRPFST is large enough. The context smoothing process is as follows, where α is the value of VRPFST of the current segment, and α1, α2, α3 are the threshold mentioned above:
When α≥α1, the segment is discriminated to be speech signals.
When α≤α1, the segment is discriminated to be radiated noise signals.
When α1<α≤α2, the segment is discriminated to be undetermined radiated noise signals.
When α2<α<α3, the segment is discriminated to be undetermined speech signals.
The context smoothing process is only used for the last two undetermined signals, that is to see that if the VRPFST of the segment t is large or small enough and has been determined to be one of the first two conditions, context smoothing is ignored even though the segments t+1 and t-1 are the same categories. This procedure introduces a delay of 1 s, which is necessary for the final determination. At the end of this procedure, the category of each segment is decided roughly, but the precision of 20 ms has not been achieved.
Fig. 6The histogram of VRPFST values of the speech signal and radiated noise
2.2.3. High precision detection
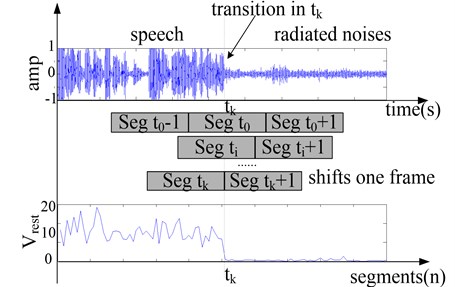
The frame shifting method [1] is introduced to improve the detection precision to the maximum precision of 20 ms. If segment t is detected to be speech segment and segment t+1 is all ship-radiated noise, the transition segment t is located, and the high precision detection is realized in the segment t and t+1. Fig. 7. shows the high precision detection processing. The noise segment t+1 shifts one frame towards the transition segment t to form a new segment t1+1, and then VRPFST of the new segment t1+1 is calculated and the detection is conducted. If the new segment includes speech, the frame shifted above is located to be the transition frame that indicates the beginning or end of speech signal, and if not, we shift the next frame to form segment t2+1 until the transition frame is determined The duration of the new segment is always 1 s and then the maximum precision of 20 ms, the length of transition frame, can be achieved.
Fig. 7Illustration of the frame shifting method
3. Results and discussion
The proposed algorithm is tested on measured data sets containing speech signals and ship-radiated noise. The speech signals are spoken by a variety of both male and female speakers at different ages and the ship-radiated noises, include many kinds of ships in different navigation states. Both of the data are 100 minutes and sample frequency is 44.1 KHz.
3.1. Performance test of the detector
The experiment is divided into three parts to assess the performance of the algorithm and its feasibility to different kinds of signal, as follows:
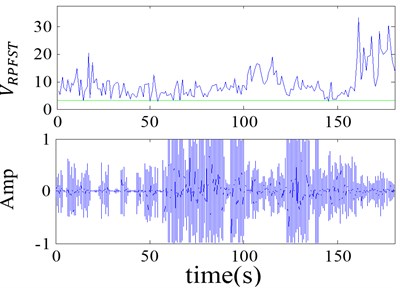
Data set 1: This data set consists of speech records of male and female speakers at different ages, and 20 second segments of each record are intercepted. It is mainly used to test if the detection algorithm is applicable to all kinds of speech signal (Fig. 8(a)). The VRPFST is all bigger than the selected threshold shown in the green line.
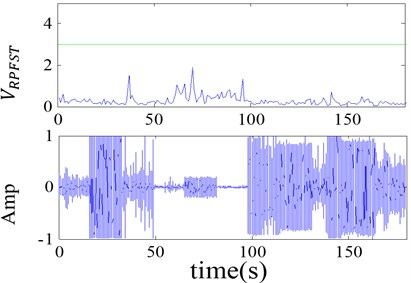
Data set 2: This data set comprises of different ship-radiated noise records, and its structure is the same as data set 1. It is used to test the feasibility of the algorithm to different kinds of strong background of the ship-radiated noise (Fig. 8(b)). The VRPFST is all smaller than the selected threshold shown in the green line.
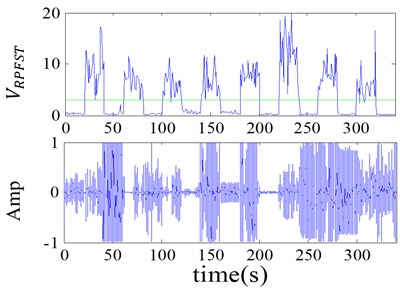
Data set 3: This data set is very important for the algorithm test because of that it consists of records coming from different speakers interleaved with a different strong ship-radiated noise (Fig. 8(c)). The VRPFST is obviously different for speech and ship-radiated noise.
The first subplot of each figure is the detection result, where the line is the threshold. Therefore, the detector is available to all kinds of ship-radiated noise and speech signal and is suitable for the changing values of the characteristics of the two signals.
Fig. 8Performance test of the detector
a) Set 1
b) Set 2
c) Set 3
3.2. Available for multi-language
Different languages possess many different and specific characteristics. For example, some languages place more focus on pronunciation and some place more focus on tones. Hence, it is very essential to test the detection of speech in different languages.
Mandarin is a tonal language like most other Chinese dialects. It has four tones, high-level-tone, rising tone, low-falling-raising tone and high-falling tone. These tones may be the most differences distinguish characteristics between English and Mandarin. Therefore, the tones are used to distinguish words form one another like consonants and vowels. Here, data set 4 is used to test the availability of our system for different languages, which consists of Chinese with different dialects and English with different pronunciation from different countries, German, Russian, Korean and so on. The sample frequency is 44.1 KHz and segments of 30 seconds of each record are intercepted.
Integrated signals including nine speech segments of 30 seconds are used and their amplitude distributions are shown Fig. 9. The segments are in turn Mandarin, two Chinese dialects, Germen, two Russian segments, Korean, English and American. The VRPFST distributions of the integrated signals are shown in the first subplot of Fig. 9, in which the green line is a critical threshold. The VRPFST of all the speech segments for different language are mostly bigger than the selected threshold with the green line. With a critical threshold, the speech segments can be detected correctly with our method in this current study.
Fig. 9Performance test of the detector for multi-language
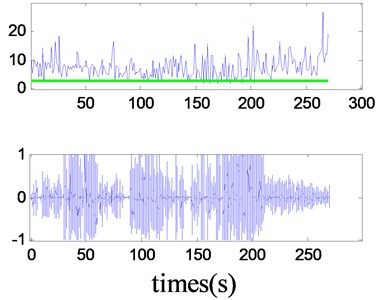
Also, the experiment result is accordance with the principle of our detection method with the feature variable VRPFST. As previous discussion, the aim is to reveal the difference of the spectrum distributions between speech and ship-radiated noise by using the feature VRPFST. Though different languages may focus on specific characteristics such as pronunciation or tones, their pronunciation can cause different spectrum distributions from that of the ship-radiated noise, which resulting in the feasibility of the feature VRPFST. Thus, our detection method is available to cope with the detection of multi-language in ship-radiated noise background.
3.3. ROC curves
Here, signal detection theory was used to test the performance of this detector in different signal-to-noise ratios. The tasks reported here are mathematically equivalent to a ‘two-class prediction’ problem with four possible outcomes in which P(Y/sn) and P(N/sn) denoting the probabilities of responding ‘yes’ or ‘no’ to a signal in noise.
In detail, the test signal is mixed as follows, speech segments are mixed into ship noise, according to the segment SNR (5) in random intervals (Fig. 10). The segment SNR is only calculated in segments that include speech and noise:
where, M is the number of segments, N is sample numbers in a segment. X(n) and y(n) are samples of speech and noise in speech segment duration.
Fig. 10The test mixed signal and the detection results
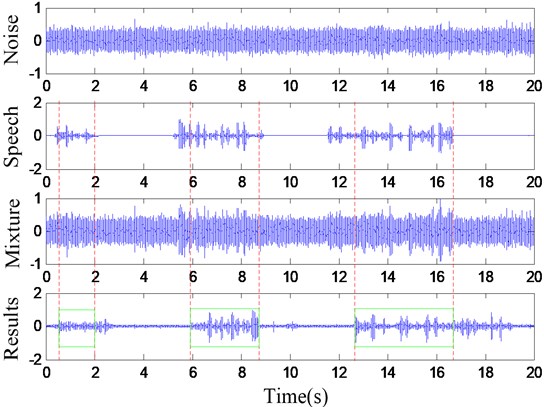
The probability of correct detection was computed by comparing the time stamps of the automatic detections with those speech segments mixed into the test signal. If the detector showed any number of detections within speech segments just as the rectangle duration (Fig. 10), this was considered as one correct detection. Then, the number of correct detections was divided by the total number of speech segments to yield the probability. All detections that fell outside of that speech segment duration were considered false alarms.
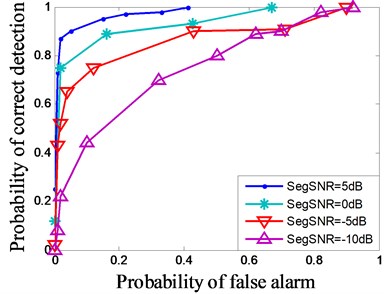
In receiver-operating-characteristic (ROC) plots, the probability of false alarms is plotted versus the probability of correct detections. If one changes the threshold of a detector, so-called ROC curves are produced (Fig. 11). The ROC curves are plotted on different segments SNR. Thus, the detector reported here can achieve a good detection result when the segment SNR is bigger than –10 dB and in the segment SNR of smaller than –10 dB or –15 dB. Moreover, the detection result appears unstable and should be improved with the help of other methods.
Fig. 11Varying the threshold yield ROC curves in different segment SNR. The best detection result is the one reaching closest to the point (0, 1)
4. Conclusions
An effective algorithm for speech detection in strong ship-radiated noise was presented using a simple feature RPFST calculated based on spectrum entropy. The algorithm was verified on many kinds of measured data sets-speech signals, ship-radiated noise as well as the mixing of the two signals. Experimental results revealed that the algorithm is suitable for different kinds of speech and ship-radiated noise. Furthermore, the efficiency is exceptionally good with a detection accuracy of 92 %.
References
-
Costas P., George T. A speech/music discriminator based on RMS and zero-crossings. IEEE Transactions on Multimedia, Vol. 7, Issue 1, 2005, p. 155-167.
-
Scheier E., Slaney M. Construction and evaluation of a robust multifeature speech/music discriminator. Proceedings of IEEE International Conference on Acoustics, Speech and Signal Processing, 1997, p. 1331-1334.
-
Tzanetakis G. Musical genre classification of audio signals. IEEE Transactions on Speech Audio Process, Vol. 10, Issue 4, 2002, p. 293-302.
-
Zhang C., Hansen J. Whisper-island detection based on unsupervised segmentation with entropy-based speech processing. IEEE Transactions on Audio, Speech, Lang, Process, Vol. 19, Issue 4, 2011, p. 883-894.
-
Karthikeyan U., Sridhar K., Shihab J. Multigroup classification of audio signals using time-frequency parameters. IEEE Transactions on Multimedia, Vol. 7, Issue 2, 2005, p. 308-315.
-
Ascension G. A., Juan M. M. Histogram equalization-based features for speech, music, and song discrimination. IEEE Signal Processing Letters, Vol. 17, Issue 7, 2010, p. 659-662.
-
Raj B., Smaragdis P., Shashanka M., Singh R. Separation a foreground singer from background music. International Symposium on Frontiers of Research on Speech and Music, Mysore, India, 2007, p. 8-9.
-
Cooper M., Foote J. Automatic music summarization via similarity analysis. Proceedings of 3rd International Conference on Music Information Retrieval, Paris, France, 2002, p. 81-85.
-
Wang J. Voice activity robust detection of noisy speech in Toeplitz. Indonesian Journal of Electrical Engineering, Vol. 13, Issue 1, 2015, p. 137-144.
-
Abhay U., Ram B. P. Instantaneous voiced/non-voiced detection in speech signals based on variational mode decomposition. Journal of the Franklin Institute, Vol. 352, Issue 7, 2015, p. 2679-2707.
-
Elizalde B. Three approaches for speech/non-speech detection in consumer-produced videos. IEEE International Conference on Multimedia and Expo (ICME), 2013, p. 1-6.
-
Milton S. P., Tiago H. F. Whispered speech detection in noise using auditory-inspired modulation spectrum features. IEEE Signal Processing Letters, Vol. 20, Issue 8, 2013, p. 783-786.
-
Chung Kyungyong, Oh SangYeob Improvement of speech signal extraction method using detection filter of energy spectrum entropy. Cluster Computing, Vol. 18, Issue 2, 2015, p. 629-635.
-
Wang K. C., Tsai Y. H. Voice activity detection algorithm with low signal-to-noise ratios based on spectrum entropy. Proceedings of the International Symposium on Universal Communication, 2008, p. 423-428.
-
Kang S. K., Chung K. Y., Lee J. H. Development of head detection and tracking systems for visual surveillance. Personal and Ubiquitous Computing, Vol. 18, 2014, p. 515-522.
-
Boutaba R., Chung K., Gen M. Recent trends in interactive multimedia computing for industry. Cluster Computing, Vol. 17, Issue 3, 2014, p. 723-726.
-
Kim J. H., Chung K. Y. Ontology-based healthcare context information model to implement ubiquitous environment. Multimedia Tools and Applications, Vol. 71, Issue 2, 2014, p. 873-888.
-
Park R. C., Jung H., Jo S. M. ABS scheduling technique for interference mitigation of M2M based medical WBAN service. Wireless Personal Communications, Vol. 79, Issue 4, 2014, p. 2685-2700.
-
Park R. C., Jung H., Shin D. K., Cho Y. H., Lee K. D. Telemedicine health service using LTE-advanced relay antenna. Personal and Ubiquitous Computing, Vol. 18, Issue 6, 2014, p. 1325-1335.
-
Karthikeyan U., Sridhar K., Raveendra K. R. Audio signal feature extraction and classification using local discriminant bases. IEEE Transaction on Audio, Speech and Language Processing, Vol. 15, Issue 4, 2007, p. 1236-1246.
About this article
This work was supported by the National Natural Science Foundation of China (No. 61271444). Yingchun Zhong was supported by Financial and Educational Fund of Guangdong Province [2015]304.
