Abstract
In the paper a novel automatic seismic signal segmentation procedure is proposed. This procedure is motivated by analysis of real seismic vibration signals acquired in an underground mine. During regular mining activities in the underground mine one can expect some seismic events which appear just after the mining activity, e.g. blasting procedures, provoked relaxation of rock and some events that are unexpected, like natural rock burst. It often happens that, during one signal realization, several shocks (events) appear. Apart from two main sources of events (i.e. rock burst and blasting), other activities in the mine might also initiate seismic signal recording procedure (for example machine moving nearby the sensor). Obviously, significance of each type of recorded signal is very different, its shape in time domain, energy and frequency structure (i.e. spectrum of the signal) are different. In order to recognize these events automatically, recorded observation should be pre-processed in order to isolate a single event. The problem of signal segmentation is investigated in literature, several application domains might be found. Although, there are just a few works on seismic signal segmentation. In this paper we propose to use a time-frequency decomposition of the signal and model each sub-signal at every frequency bin using statistical methods. Narrowband components are much easier to search for so called structural breakpoint, i.e. time instance when properties of signal significantly change. It is obvious that simple energy-based methods applied to raw signal fail when one event begins before the previous one relaxed. In order to find beginning and end of a single event we propose to use measures based on empirical quantiles estimated for each sub-signal and, finally, aggregate 2D array into 1D probability vector which indicates location where statistical features has switched from one regime to another one. The proposed procedure can be applied in order to improve time domain isolation of single event for the case, when duration of signal acquisition is longer than duration of the event or to isolate single event from sequence of events (recorded for example during blasting).
1. Introduction
Seismic signal analysis is a well-established scientific discipline [1-8]. From mining industry perspective, it is one of the most important issues to identify, quantify and understand seismic activity by seismic signal analysis. Mining operations in underground mine for the case considered here produce many different seismic events related to mining room and pillar technology, blasting technology, complicated geomechanical conditions in deep (>1000 m) underground mine, heavy duty machinery systems etc. To monitor, localize and characterize seismic events there is a network of sensors developed in the considered mine for seismic data acquisition. All data from the multichannel acquisition system are transmitted to so called “mine seismic center” and all data are processed, stored and some reports are prepared and distributed to pre-defined departments in the mine as well as some external institutions.
As mentioned, limited analysis related to localization of the event and estimation of its energy are performed on the regular basis. Development of signal processing techniques, data mining tools as well as spatial IT systems combined with geophysical and mining experience might provide wider knowledge. Our long term task is to develop the system for automatic detection, segmentation, recognition and finally visualization of seismic events appearing in the mine using GIS (Geographical Information System) data base environment. However, as mentioned, the very first step is signal pre-processing, including signal segmentation which is core of this paper.
During regular mining activities in the underground mine, seismic events might be related to events induced in somehow predictable way by mining activity (blasting procedures, provoked relaxation of rock) and unexpected, as natural rock burst. Apart from these two main sources of events, other activity in the mine might also initiate seismic signal recording procedure (for example mobile machine moving nearby the sensor). Obviously, significance of each type of recorded signal is very different, its shape in time domain, energy and frequency structure, (spectrum of the signal) will be different. It was shown in [1], that spectra of different types of seismic events might differ significantly. Moreover, depending on the physical background of the event, seismic signal might contain very complex structure, that in fact is a sequence of impulses related to sequence of events. It is easy to imagine the case for blasting, however, also multiple rock burst might appear, too.
In order to recognize these events automatically [7, 8], recorded observation should be pre-processed to isolate single event [6]. The problem of signal segmentation is investigated in the literature [9-16], several application domains might be found, i.e. condition/process monitoring [17-21], experimental physics [22], electromagnetic field analysis [23], radioactivity measurement [24], biomedical signals (ECG signals), speech analysis (automatic speech recognition and understanding) [4-6, 31] and econometrics [7]. Surprisingly, there are just a few works on seismic signal segmentation [2-6, 30, 31], but a few of them has been developed 30 years ago.
In the paper we propose to use time-frequency decomposition of the signal and next incorporate statistical tools to model sub-signals for each frequency bin. Time-frequency representation is commonly used in analysis of non-stationary signals [4, 17, 19, 24, 28, 32, 33]. It is obvious that simple, raw signal’s energy based methods in time domain failed. It is known that narrowband components are much easier to analyze in order to find so called structural breakpoint, i.e. time instance when properties of signal change significantly. In order to find borders of single event we propose to use measures based on empirical quantiles estimated for each sub-signals and finally – by aggregation of decisions for each sub-signal – we introduce 1D array of probability that indicate location of change of regimes in the signal.
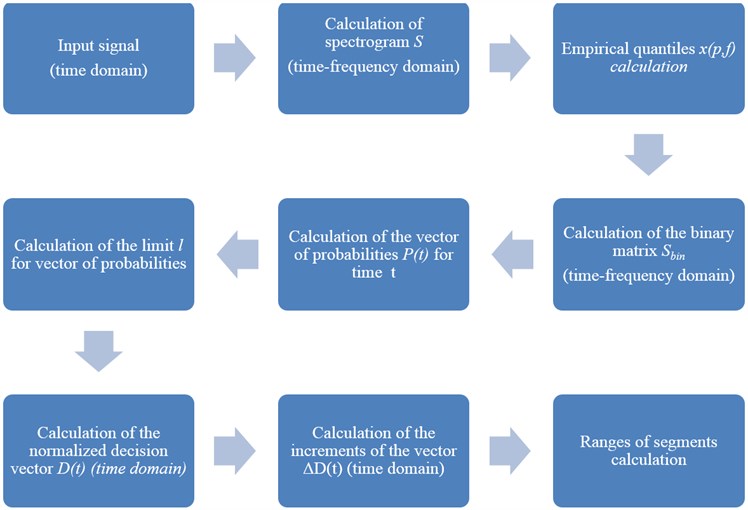
In the segmentation method we rely on the time-frequency representation (spectrogram) of examined signal and analyze sub-signals corresponding to appropriate frequencies. More precisely, we calculate a one-dimensional vector of probabilities which indicate that amplitudes of a signal in time-frequency representation exceed a value specified as a quantile of a given order and frequency bin. On the basis of the vector of probabilities we finally calculate the decision vector and segment the signal.
The proposed procedure can be applied in order to improve time domain isolation of a single event for the case when duration of signal acquisition is longer than duration of the event or to isolate single event from sequence of events (recorded for example during blasting).
The paper is organized as follows: in Section 2 a short description of the experiment performed in the mine is introduced, in Section 3 we present theoretical background of the segmentation method and finally in Section 4 we present results of proposed methodology. In the last section results pointing out drawback of the method are discussed and conclusions are provided.
2. Experimental setup
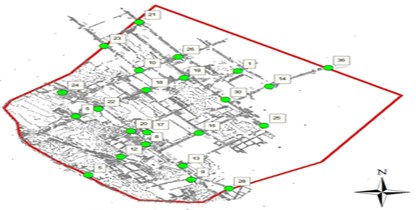
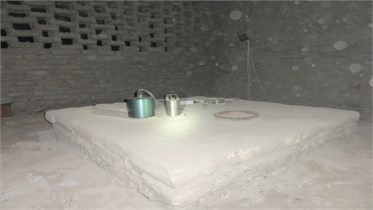
As mentioned, a commercial monitoring system is installed in the mine. It is used to monitor seismic activity in the mine including localization of the rock burst as well as their evaluation in terms of energy of the event. The system consists of dozen sensors distributed in the mine, it is operating online 24 h/day. In Fig. 1(a) a map with location of the sensors is presented, while Fig. 1(b) shows sensor in a so called „seismic chamber”.
Fig. 1a) Location of sensors in the mine, b) a sensor in “seismic chamber”
a)
b)
However, in this paper, we do not use data from system described above. During the project carried out in KGHM Cuprum, a prototype system for seismic data (namely acceleration) acquisition was developed to acquire vibrations independently from mine seismic sensor network. The main idea of that project was to combine information about seismic velocity and acceleration signals with stresses measured on specially designed bolt (recall that a bolting system is used to ensure adequate stability of mining corridor, i.e. floor, roof and side wall). In this work vibration acceleration is used.
For the purposes of vibrations acquisition coming from the seismic event a triaxial accelerometer sensor (which operates independently of this system of mine) was installed on the roof of the mining corridor (Fig. 2). The developed system allows to measure vibration acceleration in the range of 0,001 do 100 m/s2, with frequency range 0,5-400 Hz (with a small oversampling, since sampling frequency fs= 1250 Hz). During calibration procedure it was shown that amplitude characteristic is flat in this range (no resonances are present in the data acquisition system). The sensor was mounted on the roof of the mining corridor using gypsum binder. This method provides very good (rigid) mechanical sensor – rock connection. During the seismic observation, the measurement data were downloaded from the recorded and, if necessary, the battery was charged on weekly basis.
Fig. 2Location of the sensor on the roof of the mining corridor using gypsum binder
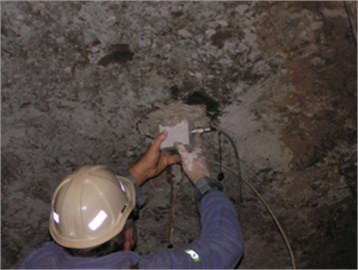
Fig. 3A general view on developed system
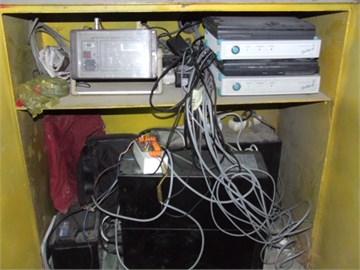
The sensor was located at a distance of 20 to 140 m from the face of mining face. The distance increased due to advance of mining works. The signal is recorded close to the expected source, in the controlled area. The measuring system was placed in a lockable, metal cabinet. Using the specialized sensor with high dynamic range allows to overcome overdriving of sensor when energy of shock is high. Fig. 3 presents a safety cabinet interior with elements of the measurement system.
3. Methodology
In this section we introduce the segmentation method which we apply to the seismic signals. It is based on the time-frequency representation of the signal and on statistical properties of sub-signals corresponding to a given frequency bin. We propose to apply the spectrogram, which is based on the short-time Fourier transform defined as follows [34]:
where {X(τ)} is the analyzed process and W(t) is an appropriate window. In case of real signal X1, X2,…, XN analysis the discrete short time Fourier transform takes the form:
On the basis of S(t,f) function, the signal can be analyzed in time-frequency domain (as a set of sub-signals corresponding to appropriate frequencies) as well as in frequency domain [17, 18]. The square of the absolute value of the matrix S={S(t,f)} is called spectrogram. In the next step of proposed segmentation procedure of seismic signal, for each frequency f we analyze the time series S(:,f) separately. Such time series are called sub-signals. For each sub-signal we calculate quantiles of given order p. From the theoretical point of view, the quantile of order p of a random variable X is a number x(p), that satisfies the following conditions:
The theoretical distribution of sub-signals is unknown, thus in proposed segmentation procedure we calculate the empirical quantiles, i.e. quantiles calculated on the basis of the sub-signals corresponding to given frequencies. The empirical quantile of order p is an observation taken from the ascendingly sorted data on the position number N*p/100, where N is a length of given sub-signal. For the analyzed seismic signals (see next section) we take p=60. Because for each frequency f we obtain different quantile of order p, therefore in the further analysis the appropriate quantiles we denote as x(p,f).
In the next step of our segmentation procedure we calculate so called binary matrix, which contains zero-one values and indicates if given observation from sub-signal corresponding to frequency f exceeds the quantile x(p,f). The binary matrix we define as follows:
Since the frequency range of the signal is 0.5-400 Hz, in the real data analysis Sbin(t,f) for f>400 Hz are set to 0. Next, we calculate the vector of probabilities for each time point t, which is equal to the mean of the binary matrix at each time point. Therefore it is defined as follows:
After calculating the vector of probabilities, we determine the percentage threshold k. On the basis of this threshold we calculate the limit of normalized vector {P(t)}. This limit is calculated as follows:
For majority of the examined seismic signals we use k=80 %.
On the basis of calculated limit we analyze a decision vector defined as follows:
Next we analyze the increments of the decision vector D(t):
The beginnings of the appropriate segments are at the time points where the vector ΔD(t) has negative value, while the ends of the segments – where ΔD(t) is positive.
In Fig. 4 we present the scheme of the described above segmentation method.
Fig. 4Block diagram of the proposed segmentation procedure
4. Application of the segmentation method to seismic data from undergorund mine
In this section we present results of application of the proposed segmentation method to real data acquired during the experiment described in Section 2. In order to prove efficiency of the method two examples are discussed. The first case illustrates a single event, however length of observation is several times larger than duration of the event. So, the aim of the procedure is to precisely localize the event in time. The second case is much more complicated, since it contains data recorded during blasting procedure, when a sequence of events of similar lengths is expected. However, other seismic events might appear during the acquisition. The purpose of the procedure is to divide the signal into different segments containing separated events.
4.1. Signal with a single event
We analyze here the signal 4_45 in which we observe the single event (segment). In Fig. 5 we present the examined signal and the spectrogram calculated according to Eq. (2).
Fig. 5a) Signal 4_45 and b) corresponding spectrogram

a)

b)
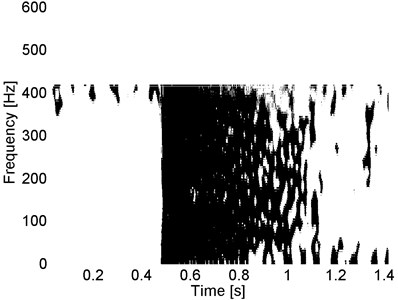
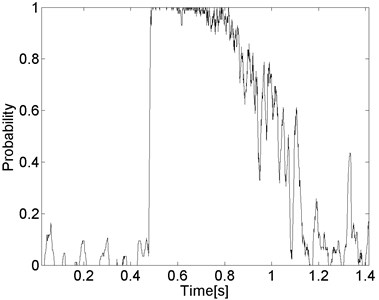
According to the presented segmentation procedure in the next step of the analysis we calculate the empirical quantiles corresponding to appropriate frequencies from spectrogram and on the basis of them we calculate the binary matrix (Eq. (4)) and vector of probabilities for each t (Eq. (5)). In Fig. 6 we present the a) binary matrix for the examined signal and b) corresponding vector of probabilities.
Fig. 6The binary matrix (black – 1, white – 0) for signal 4_45 and corresponding vector of probabilities
a)
b)
As a result of the segmentation method, in Fig. 7 we present the signal with selected segment. The introduced segmentation method applied to the signal gives the expected result.
Fig. 7The final result of the segmentation method applied to signal 4_45

4.2. Signal with multiple events
As the second example we analyze signal 2_13 that consists of a lot of segments. In Fig. 8 we present a) the examined signal and b) corresponding spectrogram. We observe that the signal is impulsive and the impulses have different amplitudes. Those impulses are also represented in the time-frequency map of the signal as wideband excitations.
Fig. 8a) The examined signal 2_13 and b) corresponding spectrogram

a)

b)
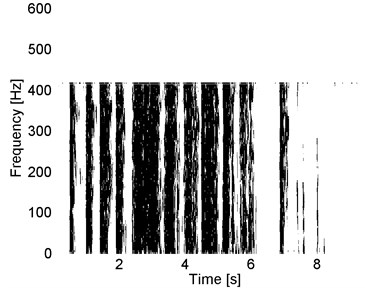
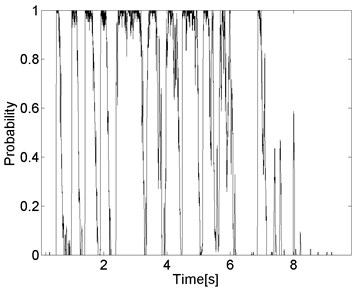
Fig. 9a) The binary matrix (black – 1, white – 0) for signal 2_13 and b) the plot of the vector of probabilities
a)
b)
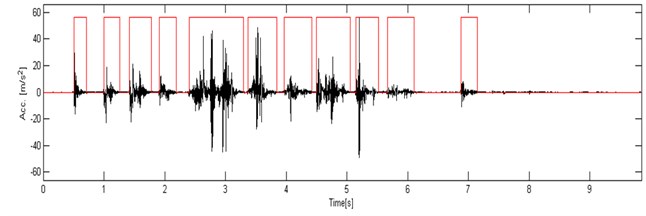
Fig. 10The result of the segmentation of the signal 2_13 by using the proposed segmentation method
In Fig. 9(a) we present the binary matrix of the signal. It is easy to conclude the number of segments is equal to 11 – it is indicated by the vertical lines in the plot of the binary matrix. The fifth segment is probably a combination of other segments, however by using this procedure we cannot recognize them. The differences between those segments are sufficiently small, therefore it is difficult to split the segment into smaller events. Additionally, in Fig. 9(b) we present also the vector of probabilities on the basis of which we can perform the segmentation.
In Fig. 10 we show the signal with selected segments. Also in this case the applied procedure gives the expected result.
5. Conclusions
In the paper a seismic signal segmentation procedure was proposed. The purpose of the method is to isolate a single event from collection of events that might appear during blasting procedure or alternatively to limit the duration of acquired signal to the informative part only (depending on application, before and after the event some noise might be stored). It should be highlighted that simple criteria based on energy of raw signal in time domain do not provide satisfactory results. The proposed method is based on time-frequency representation, namely the spectrogram. Spectrogram can be considered as decomposition of the signal into family of narrowband sub-signals with a specific frequency band ∆. The proposed segmentation scheme is applied for each sub-signal, then final decision is a result of kind of information fusion. There are two key issues in the procedures: how to detect presence of the signal in single sub-signal and how to integrate decision from all sub-signals. The first task is done based on statistical modelling of data. We use empirical quantiles estimated from sub-signal time series as a feature evaluating presence of its energy. Next, based on all sub-signals, we estimate probability that for given time instance the investigated statistical features change significantly. The final result of the proposed segmentation procedure is obtained on the basis of the vector of probabilities – we test the hypothesis if the probability corresponding to given time point exceeds experimentally chosen threshold (80 % here).
We believe that the proposed segmentation method is simple and based on its validation for such different signals we can conclude that it works properly. However, we have noticed a drawback of the method: in the case of events occurred nearly in the same time (but with different origin), the proposed technique was not able to distinguish multiple events. Currently we are working on this problem.
References
-
Xu X., Dou L., Lu C., Zhang Y. Frequency spectrum analysis on micro-seismic signal of rock bursts induced by dynamic disturbance. Mining Science and Technology, Vol. 20, Issue 5, 2010, p. 682-685.
-
Chen C. H. On a segmentation algorithm for seismic signal analysis. Geoexploration, Vol. 23, 1984, p. 35-40.
-
Gaby E. J., Anderson R. K. Hierarchical segmentation of seismic waveforms using affinity. Geoexploration, Vol. 23, 1984, p. 1-16.
-
Popescu T. D., Aiordachioaie D. Signal segmentation in time-frequency plane using Renyi entropy – application in seismic signal processing. IEEE Conference on Control and Fault-Tolerant Systems (SysTol), 2013, p. 312-317.
-
Popescu T. D. Signal segmentation using changing regression models with application in seismic engineering. Digital Signal Processing, Vol. 24, 2014, p. 14-26.
-
Lu C.-P., et al. Microseismic frequency-spectrum evolutionary rule of rockburst triggered by roof fall. International Journal of Rock Mechanics and Mining Science, Vol. 64, 2013, p. 6-16.
-
Leśniak A., Isakow Z. Space-time clustering of seismic events and hazard assessment in the Zabrze-Bielszowice coal mine, Poland. International Journal of Rock Mechanics and Mining Sciences, Vol. 46, Issue 5, 2009, p. 918-928.
-
Orozco-Alzate M., et al. The DTW-based representation space for seismic pattern classification. Computers and Geosciences, 2015.
-
Lovell B., Boashash B. Segmentation of non-stationary signals with applications. IEEE International Conference on Acoustics, Speech, and Signal Processing, New York, Vol. 5, 1988, p. 2685-2688.
-
Hassanpour H., Anisheh S. M. An improved adaptive signal segmentation method using fractal dimension. IEEE 10th International Conference on Information Sciences Signal Processing and their Applications (ISSPA), 2010, p. 720-723.
-
Musaruddin M., Zivanovic R. Signal segmentation of fault records based on empirical mode decomposition. TENCON, IEEE Region 10 Conference, 2011, p. 138-143.
-
Azami H., Sanei S. Automated signal segmentation based on singular spectrum analysis and imperialist competitive algorithm. IEEE 2nd International Conference on Computer and Knowledge Engineering (ICCKE), 2012, p. 50-55.
-
Azami H., et al. A hybrid evolutionary approach to segmentation of non-stationary signals. Digital Signal Processing, Vol. 23, Issue 4, 2013, p. 1103-1114.
-
Mahmoodi S., Sharif B. S. A nonlinear variational method for signal segmentation and reconstruction using level set algorithm. Signal Processing, Vol. 86, Issue 11, 2006, p. 3496-3504.
-
Toth B., Lillo F., Farmer J. D. Segmentation algorithm for non-stationary compound Poisson processes. The European Physical Journal B, Vol. 78, Issue 2, 2010, p. 235-243.
-
Palivonaite R., Lukoseviciute K., Ragulskis M. Algebraic segmentation of short nonstationary time series based on evolutionary prediction algorithms. Neurocomputing, Vol. 121, 2013, p. 354-364.
-
Obuchowski J., Wyłomańska A., Zimroz R. The local maxima method for enhancement of time-frequency map and its application to local damage detection in rotating machines. Mechanical Systems and Signal Processing, Vol. 46, 2014, p. 389-405.
-
Obuchowski J., Wylomanska A., Zimroz R. Selection of informative frequency band in local damage detection in rotating machinery. Mechanical Systems and Signal Processing, Vol. 48, 2014, p. 138-152.
-
Padovese L. R., Martin N., Millioz F. Time-frequency and Time-Scale analysis of Barkhausen noise signals. Proceedings of the Institution of Mechanical Engineers. Part G, Journal of Aerospace Engineering, Vol. 223, Issue 5, 2009, p. 577-588.
-
Crossman J. A., et al. Automotive signal fault diagnostics – part I: signal fault analysis, signal segmentation, feature extraction and quasi-optimal feature selection. IEEE Transactions on Vehicular Technology, Vol. 52, Issue 4, 2003, p. 1063-1075.
-
Wylomanska A., Zimroz R. Signal segmentation for operational regimes detection of heavy duty mining mobile machines – a statistical approach. Diagnostyka, Vol. 15, Issue 2, 2014, p. 33-42.
-
Gajda J., Sikora G., Wylomanska A. Regime variance testing – a quantile approach. Acta Physica Polonica B, Vol. 44, Issue 5, 2013, p. 1015-1035.
-
Bieńkowski P., Burnecki K., Janczura J., Weron R., Zubrzak B. A new method for automated noise cancellation in electromagnetic field measurement. Journal of Electromagnetic Waves and Applications, Vol. 26, 2012, p. 1226-1236.
-
Przylibski T., Wyłomanska A., Zimroz R., Fijałkowska-Lichwa L. Application of spectral decomposition of 222RN activity concentration signal series measured in Niedzwiedzia Cave to identification of mechanism responsible for different time-period variations. Applied Radiation and Isotopes, Vol. 104, 2015, p. 74-86.
-
Micó P., et al. Automatic segmentation of long-term ECG signals corrupted with broadband noise based on sample entropy. Computer Methods and Programs in Biomedicine, Vol. 98, Issue 2, 2010, p. 118-129.
-
Choi S., Jiang Z. Comparison of envelope extraction algorithms for cardiac sound signal segmentation. Expert Systems with Applications, Vol. 34, Issue 2, 2008, p. 1056-1069.
-
Khanagha V., et al. Phonetic segmentation of speech signal using local singularity analysis. Digital Signal Processing, Vol. 35, 2014, p. 86-94.
-
Makowski R., Hossa R. Automatic speech signal segmentation based on the innovation adaptive filter. Journal of Applied Mathematics and Computer Science, Vol. 24, Issue 2, 2014, p. 259-270.
-
Janczura J. Pricing electricity derivatives within a Markov regime-switching model: a risk premium approach. Mathematical Methods of Operations Research, Vol. 79, Issue 1, 2014, p. 1-30.
-
Love P. L., Simaan M. Segmentation of a seismic section using image processing and artificial intelligence techniques. Pattern Recognition, Vol. 18, Issue 6, 1985, p. 409-419.
-
Pikoulis E.-V., Psarakis E. Z. A new automatic method for seismic signals segmentation. IEEE International Conference on Acoustics, Speech and Signal Processing (ICASSP), 2012, p. 3973-3976.
-
Burdzik R. Implementation of multidimensional identification of signal characteristics in the analysis of vibration properties of an automotive vehicle’s floor panel. Eksploatacja i Niezawodność – Maintenance and Reliability, Vol. 16, Issue 3, 2014, p. 439-445.
-
Burdzik R., Konieczny Ł. Application of vibroacoustic methods for monitoring and control of comfort and safety of passenger cars. Solid State Phenomena, Vol. 210, 2014, p. 20-25.
-
Allen J. B. Short term spectral analysis, synthesis, and modification by discrete Fourier transform. IEEE Transactions on Acoustics, Speech and Signal Processing, Vol. 25, Issue 3, 1977, p. 235-238.
About this article
This work is partially supported by the Statutory Grant No. S50112 (G. Żak).
