Abstract
Traffic noise is a major environmental source of pollution both in developed and in developing countries. Pavement surface texture affects many vehicle and road characteristics; therefore, efforts are needed to develop more advanced techniques for evaluating pavement texture. The selection of an appropriate pavement as the best method to control the main cause of road noise, the sound absorption resulting from contact wheel vehicles and pavement is proposed. In this study skid resistance of porous asphalt and conventional asphalt were measured. The correlation R2 and P value of the linear regression was used for skid resistance and noise. Various pavement characteristics were measured and their effects on noise levels were evaluated using principal components regression, in addition to ordinary least-squares regression. This research confirmed that open graded pavements exhibit reduced tire noise compared to dense and gap graded mixes and quantified this reduction for typical mixes in Tehran. Correlation between Skid resistance of asphalt pavements and noise levels were determined using the statistical program.
1. Introduction
Pavement surface characteristics have an important role in clarifying the state of noises emission from the contact of tires and the pavement surface [1]. Previous studies in Minnesota, have shown that at speeds above 80 km/h, noise caused by contact of tires and the pavement, as the main parameter of the sounds of the vehicle in motion is considered [2]. Nilsson confirmed that the noises generated by the contact of tires and the pavement surface, in the cars is the dominant noise source [3]. Similar to discrete coarse aggregate, porous pavement can reduce noise generated by contact of tires and the pavement surface [4]. Porous asphalt tests carried out in England in 1980 led to this result that, when the coarse porous material was poured on surface, 4 to 5.5 dB noise reduction for dry conditions in comparison with conventional dense surfaces were observed [5]. In France, at the end of 1980, researchers showed that porous asphalt pavement has 1 to 6 dB more absorption ability than the compact surfaces [6]. Therefore identifying the characteristics of various types of pavement has an undeniable impact on the noise level and is very important to noise pollution control.
Sound produced by the vehicles on the road depends on many factors such as pavement type, porosity, size and type of aggregate, features of the vehicle, and vehicle speed. Among these parameters, two factors of the speed of the vehicle and the pavement type are the most affecting ones.
2. Noise measuring test
The Statistical Pass-By (SPB) method was used in the proposed project for measuring sound of vehicles in motion. In this test, sound is measured in motion. To measure sound, a vehicle crosses at 50 km/h at a constant RPM and sensors measure the sound automatically while it crosses throughout the relevant route. The test was conducted on porous asphalt on 25 July 2011 and Sari-Ghaemshahr highway was blocked for 10 minutes after making coordination with the police several times. It was performed by a Peugeot model GLX405 and the sound was measured by a B&K 2236 sound meter. Type I was measured at the distance of 7.5 meters from the car and at the height of 1.2 meters from maximum level of road surface. Due to the high traffic flow of the road and time limitation, the tests had to be conducted quickly without errors. The car under test should have entered the test area at 50 km/h and the accelerator should have pushed down to its maximum to cross the 300-meter route of the test. The test was carried out within two areas with porous asphalt and the results shown by Table 1 were obtained.
Table 1The maximum noise level on porous asphalt
Test number 1 (dB) | Test number 2 (dB) | ||
Device 1 | 70/9 | 9/73 | |
Device 2 | 71/9 | 9/71 | |
Average | 71 | 8/72 | 71/9 |
The test in conventional asphalt was conducted by a Peugeot model GLX405 and sound was measured by a sound level meter. The car under test should have entered the test area at 50 km/h. Table 2 shows the results.
Table 2The maximum noise level of conventional asphalt in Tehran
Number | Velocity of vehicle (km/h) | Location name | Noise level (dB) |
1 | 50 | Opposite the entrance to the town Valfajr Geophysical Institute | 71.5 |
2 | 50 | 200 meters ahead across Third Street | 70.3 |
3 | 50 | 200 meters away across the street 9/7 | 78.6 |
4 | 50 | 200 meters away across the street 9/3 | 73.2 |
5 | 50 | 200 meters away across the street 9/1 | 75.7 |
6 | 50 | North AmirAbad below the Hakim highway | 71.6 |
7 | 50 | 200 meters away in front of the Atomic Energy Organization | 72.5 |
8 | 50 | 200 meters away from the National Center for Cyber space | 77.9 |
9 | 50 | 200 meters away across the street 19 | 74.1 |
10 | 50 | 200 meters away across the street 16 | 73.8 |
11 | 50 | Dr fatemi street in front of the building and facilities engineering command | 75.8 |
12 | 50 | 200 meters ahead before Sindokht street | 76.1 |
13 | 50 | 200 meters away in front of the Iranian Fisheries Organization | 79.6 |
14 | 50 | 200 meters ahead before Etemad Zadeh street | 80.4 |
15 | 50 | 200 meters ahead against the camp of Imam Khomeini | 78.3 |
3. Skid resistance test
Specifications of a pavement surface, including macrotexture and microtexture, are effective in slip resistance. In fact, macrotexture under wet conditions and microtexture under dry conditions control skid resistance. A British pendulum test as per ASTM E303-74 standard was carried out under wet conditions on different points of porous asphalt to evaluate skid resistance of porous asphalt. This tester is used for examining microtexture of a pavement. It is made of a rubber pad connected to a pendulum, which oscillates on samples of a level under study. The test result is reported as British Pendulum Number (BPN).
The British pendulum tests were carried out on porous asphalt on 6 March 2011 and 7 March 2011 almost 3 months after execution. Table 3 shows the results.
A British pendulum test as per ASTM E303-74 standard was carried out under wet conditions on three different points of conventional asphalt in Tehran to evaluate skid resistance of normal asphalt. Five points with a distance of 200 meters between them were selected in each section and skid resistance was measured in each point. A British pendulum test was carried out on normal asphalt in Tehran on 8 November 2014. Table 4 shows the results.
Table 3British pendulum test results on porous asphalt
Location (km) | Lane number | British pendulum number |
Beginning of the road | 3 | 69 |
Beginning of the road | 2 | 64 |
Beginning of the road | 1 | 63 |
Middle of the road | 3 | 65 |
Middle of the road | 2 | 66 |
Middle of the road | 1 | 66 |
End of the road | 3 | 67 |
End of the road | 2 | 63 |
End of the road | 1 | 61 |
Table 4British pendulum test results on conventional asphalt in Tehran
Place of test | Street | Lane no. | BPN |
Valfajr Settlement – Opposite Institute of Geophysics | North Amir Abad Street – North of Hakim Highway | Lane 2 (Climbing Lane) | 76 |
200 Meters Ahead – Opposite Street 3 | 74 | ||
200 Meters Ahead – Opposite Alley 9.7 | 56 | ||
200 Meters Ahead – Opposite Alley 9.3 | 68 | ||
200 Meters Ahead – Opposite Alley 9.1 | 60 | ||
North Amir Abad Street – South of Hakim Highway | North Amir Abad Street – South of Hakim Highway | Lane 2 (Climbing Lane) | 59 |
200 meters ahead – Opposite Atomic Energy Organization | 55 | ||
200 Meters Ahead – Opposite the National Center of Cyberspace | 51 | ||
200 Meters Ahead – Opposite Street 19 | 60 | ||
200 Meters Ahead – Opposite Street 16 | 61 | ||
Fatemi Street – Opposite Buildings and Facilities Engineering Headquarter | Fatemi Street – Karegar Junction | Lane 2 (Climbing Lane) | 46 |
200 Meters Ahead – Before Simindokht Street | 50 | ||
200 Meters Ahead – Opposite Iran Fishery Organization | 51 | ||
200 Meters Ahead – Before Etemad Zadeh Street | 45 | ||
200 Meters Ahead – Opposite Imam Khomeini (RA) Garrison | 40 |
4. Linear correlation
In fact, correlation is a criterion for measuring the linear relationship between two random variables. The rate of correlation between two random variables in which one parameter is unknowns called correlation coefficient. It is shown by () symbol and it is between –1 and +1. It is clear that the closer a correlation coefficient is to +1 or –1, the relationship will be linear (respectively with positive or negative gradient or angle coefficient).In statistics, an unknown parameter is usually estimated using a random sample of a population (or statistical population). A correlation coefficient estimator is shown by . There are various methods (based on nature of two random variables) for calculating it. If both random variables are continuous and normal, correlation coefficient is calculated by a method called “Pearson correlation coefficient”. However, if one or both variables are non-continuous or non-normal, Pearson correlation coefficient will not be used. There are parametric and non-parametric methods in statistics to solve this problem. Famous parametric methods are polychoric and polyserial coefficients.
Calculation of correlation coefficient between two random variables using a test on significance of correlation coefficient is as follows:
5. Statistical analysis of experimental results
This section performs a statistical analysis for significance of the results of skid resistance test. Statistical software was used for examining and analyzing the relationship between BPN and noise. Simple linear regression was employed for building up relationship between data.
“Significance Level” (SIG) value of each parameter determines its significance, as its value for a parameter is lower than 0.05, that parameter will be significant at the confidence level of 95 percent. Values obtained from t-test were also reported for the parameters. In case this value for each parameter is smaller than its critical limit at that confidence level, the parameter will not be significant at that level. It should be noted that t-test is achieved by dividing the difference among mean of data into the standard deviation of their difference. Moreover, values of Beta column in the software output indicate effectiveness of a variable. The higher the value of a variable is, the higher its effectiveness is.
R2 (R Square) expresses rate of correlation between the variables used in a regression. The closeness of the value to 1 indicates a suitable correlation among variables. The tables show the results of statistical analysis as variance analysis (ANOVA) and coefficients of the regression equation. It should be noted that the noise value mentioned by the tables is as a dependent variable and BPN was considered as independent variables.
The results of statistical analysis presented by the above table show a significant relationship between BPN and noise. In other words, SIG value in this mode equals 0.001 for normal asphalt and 0.000 for porous asphalt (lower than the critical value). Therefore, noise reduction for BPN (whose regression line equation is shown by Fig. 1 is significant at the confidence level of 95 percent. Of course, it should be mentioned that it is not possible to accept or reject significance of a regression relation only based on a Sig value.
Fig. 1Graph for reduction of noise in percentage of skid resistance for porous asphalt and conventional asphalt
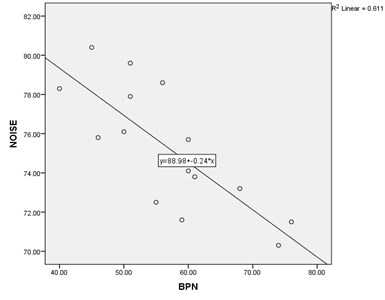
a) Conventional asphalt
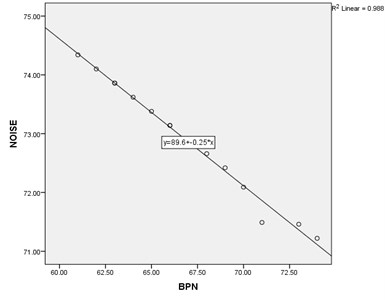
b) Porous asphalt
Research data show the effect of skid resistance on noise generation. A researcher would like to examine the question whether there is a significant relationship between noise generation and asphalt pavement. To answer the fundamental question of the research, a test is conducted first as H1: 0 vs .H0: 0 and then decision is made about it using the data. The following steps are taken for conducting the test of above assumption:
By drawing P-P diagrams in Figs. 2, 3 make sure that “noise” and “skid resistance” variables are normal.
H0: All non-constant coefficient of a regression model equal zero vs. H1: At least one of the non-constant coefficient of the model is not zero.
Fig. 2P-P plots for conventional asphalt
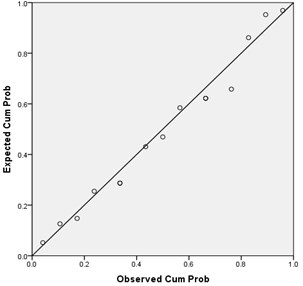
a) Normal P-P plot of BPN
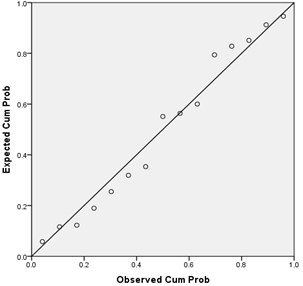
a) Normal P-P plot of noise
Fig. 3P-P plots for porous asphalt
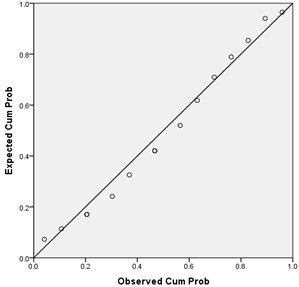
a) Normal P-P plot of BPN
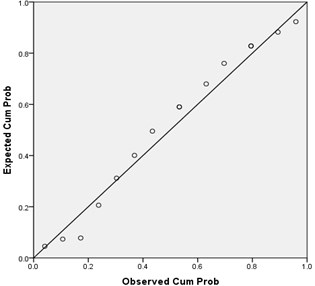
a) Normal P-P plot of noise
The above test is known as regression model suitability. Here, it is evident that we are interested in rejecting H0 assumption. Test of Regression Model Suitability is shown in Tables 5 and 6.
Tables 5 and 6 shows test of regression model suitability. The significance value of the test (SIG 0.001, 0/000) proves suitability of the regression model at the significance level of 0.05.
Table 5Test of regression model suitability ANOVAa (Conventional asphalt)
Model | Sum of squares | df | Mean square | F | SIG |
Regression | 86.359 | 1 | 86.359 | 20.445 | .001b |
Residual | 54.910 | 13 | 4.224 | ||
Total | 141.269 | 14 |
Table 6Test of regression model suitability ANOVAa (Porous asphalt)
Model | Sum of squares | df | Mean square | F | SIG |
Regression | 13.877 | 1 | 13.877 | 1062.242 | .000b |
Residual | .170 | 13 | .013 | ||
Total | 14.047 | 14 |
6. Conclusion
This article mainly aimed at examining the sound generated on pavements caused by crossing vehicles and studying the effects of different parameters on it. Selecting type of pavement is the major parameter in reducing the generated sound. Some of the pavements such as porous asphalt, double-layer porous asphalt, and stone matrix asphalt were introduced as the ones with noticeable effect on reducing sound levels. If they are selected and maintained correctly, it will be possible to reduce about 8 decibels (dB) of the sound generated by crossing vehicles. As the unit used for levels of the generated sound is a logarithm-based unit, the slightest change in it can be perceived and distinguished by human ear. According to the international standard, open-graded asphalt is commonly used as the most silent pavement. Skid resistance of surface level is of the major parameters on roads noise pollution topic. It means that whenever there is not sufficient friction coefficient between contact surface of car tire and pavement, there will be more noise. In particular, humidity of pavement surface increases skidding of vehicles and the generated noise. Therefore, by examining and measuring skid resistance of pavements, the areas with unfavorable skid resistance may be identified and special measures may be taken to remove it. This research studied frictional specifications of porous-graded and normal-graded asphalt mixtures and the results are as follows:
– A British pendulum tester can be used for examining and comparing skid resistance of asphalt surfaces.
– Skid resistance of porous-graded asphalt pavements is higher than the normal asphalt pavement. Here, PBN of porous-graded asphalt pavements is on average about 10 higher than the one of normal asphalt pavements.
References
-
Hamet J. F., Berengier M., Jacques M. Acoustic performances of pervious surfaces. Proceedings of the International Tire/Noise Conference, 1990.
-
Hibbs B. O., Larson R. M. Tire Pavement Noise and Safety Performance. FHWA, Final Report, FHWA-SA-96-068, 1996, p. 22-34.
-
Truck Noise-I, Peak A-weighted Sound Levels Due to Truck Tires. Report OSTONA 71-9, National Bureau of Standards, U.S. DOT, Washington, DC, 1970, p. 47-52.
-
Porous Asphalt Pavement: National Asphalt Pavement Association. National Asphalt Pavement Association, Lanham, Maryland, 2003, p. 25-77.
-
Colwill D. M., Bowskill G. J., Nicholls J. C., Daines M. E. Porous Asphalt Trials in the United Kingdom. Transportation Research Board, 2003, p. 75-87.
-
Berengier M., Hamet J. F., Bar P. Acoustical Properties of Porous Asphalts: Theoretical and Environmental Aspects. Transportation Research Board, 2011, p. 9-24.
