Abstract
The speech signal emitted by humans may be a source of useful diagnostic and prognostic information. The spectrum character of speech wave is connected with the fundamental frequency () of human vocal folds vibration. As it is considered, of the source during voicing contains an abundance of information on the larynx pathology, individual trait, the emotional state and ethnographic origin of speaker. The paper presents is the next, consecutive stage of author’s research, concerning simultaneous measurement of fundamental frequency of vocal fold vibration by the electroglottography (EGG) and with the acoustic methods for both pathological and normal speech signals. The analysis of the glottogram function exactitude, its parametrization and the usefulness of these methods were executed too. The study has been carried out in cooperation with Otolaryngology Clinic in 5th Military Hospital with Policlinic in Krakow and the Chair and Clinic of Otolaryngology Collegium Medicum of Jagiellonian University in Krakow.
1. Introduction
Besides of the individual characteristics of a speaker, the speech signal carries semantic and emotional state information, and other kinds, enabling to determine speaker’s ethnic origin, social status, education, and overall health. Thus speech can become, through selected parameters, an additional source of information on anatomic, physiological and pathological (deformation) conditions of human internal organs. A number of authors’ research proves that maximum information on phonetic action can be assembled by delimitation the parameters of speech sound generator such as the fundamental frequency , short and long term frequency perturbations, short and long term amplitude perturbations, noise related, tremor, voice break and subharmonic [1-4]. The changes in glottis area, which are the result of diseases, strongly affect the primary tone function of the acoustic speech signal [5-7]. This function can be estimated by internal measurements (e.g. optical methods) or external measurements (like acoustic or electrical methods). The optical methods include: stroboscopy, cinematography, videokymography (VKG), photoglottography (PGG), electrolaryngography (ELG) and two-point holographic interferometry. The acoustic methods include ultrasonography (USG), multi-dimension speech signal analysis and test evaluation of the voice acoustic pressure, while the electrical method is usually electroglottography (EGG). The literature demonstrates non numerous researches for polish speech have conducted simultaneous measurement of fundamental frequency by the EGG and with the acoustic methods, particularly with pathological speech signal. The present paper presents results of such research. The diagnostic evaluation of the glottis area has been based on parameters resulting from changes of the pitch period function. Additional in this paper had been carried out the analysis of the accuracy of algorithms (zero crossing measure – ZCM, cepstral analysis – CEPA, higher-order spectra analysis – HOSA) to determining F0 parameter [3, 8-12].
2. Speech signal production
The formation of a human voice is closely associated with breathing. The voice arises in the larynx during vibration of the vocal folds in the exhaust phase. However, the first phase is the inhale that allows accumulation in the appropriate amount of air into the lungs. As a result of respiratory muscle begins breathe out. The air exhaled from the lungs is the engine of voice folds vibration (Fig. 1).
Fig. 1a) View of the vocal tract, b) view of vocal folds in larynx
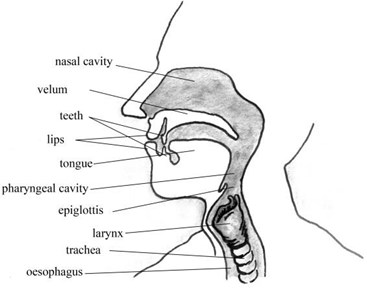
a)
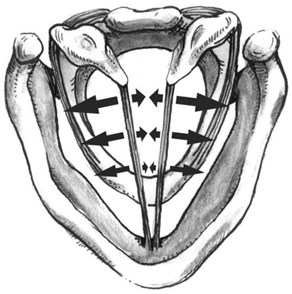
b)
Because the exhalation phase is closed glottis (voice folds adhere closely to each other), the air pressure rises around subglottic (below the vocal cords). After crossing the critical pressure the glottis are opening and by glottis air flows. This leads to a drop in subglottic pressure and the vocal folds back to its original position (their closure). This repeated many times per unit of time quasi-periodic alternating cycles of separation and closing of the vocal folds give rise to acoustic waves low. The sound produced by the glottis or laryngeal voice called fundamental frequency (fundamental tone) and is expressed by the Eq. (1):
where – mass of the vibrating vocal [kg], – stiffness constant of the chords [N/m].
The frequency of the voice pitch of spoken and sung, depending on gender are included in the ranges specified in Table 1.
Table 1Range of fundamental frequency (F0) of human vocal folds vibration
Gender | Voice type | Frequency range [Hz] |
Male | Bass | 80-320 |
Baritone | 100-400 | |
Tenor | 120-480 | |
Female | Alto | 160-640 |
Mezzo-soprano | 200-800 | |
Soprano | 240-960 |
The generated is amplified by the remaining vocal tract (ie. in throat, mouth, and nose), and the final emitted sound forms speech signal. In the time domain the emitted speech signal can be mathematically described using a convolution of time-dependent signal source and pulse-like answer of the voice channel [2]:
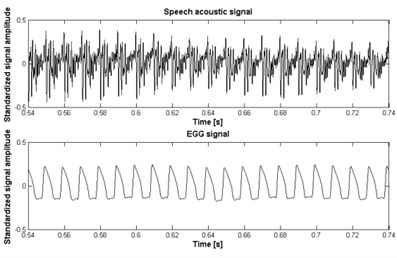
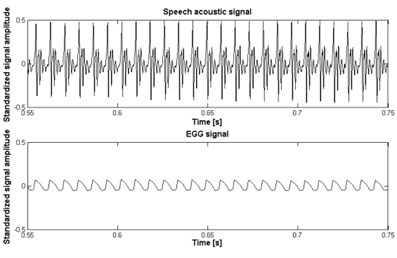
Interpretation of Eq. (1) indicates that in the time-dependent acoustic speech signal the properties of the source and the properties of the sound forming voice channel are closely related. This fact is shown at Fig. 2 both for normal and pathological speech signals.
It is assumed that that the shape of the contains biometric information, as well as it reflects clinical pathology of the vocal cords and/or of the vocal tract [1]. Therefore, it becomes attractive, to analyze the acoustic signal for the purposes of detecting these features. Acoustic detection of is even more attractive, because direct access to the signal , generated by glottis, makes direct measures of difficult.
Fig. 2a) Normal signal, b) larynx cancer signal, c) vocal cord nodule signal, d) vocal cord polyp signal
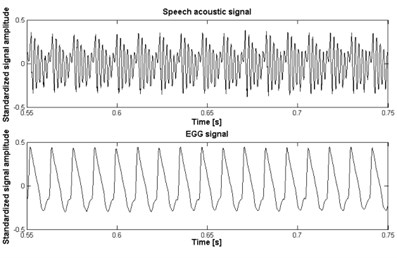
a)
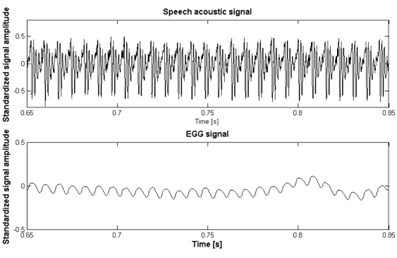
b)
c)
d)
The evaluation of vocal tract conditions especially in the glottis area can be based on parameters resulting from changes of the primary tone function. The fluctuation of the fundamental frequency and signal amplitude can be estimate by Jitter and Shimmer parameters. Jitter denotes the deviation of the larynx tone frequency in consecutive cycles from the average frequency of the larynx tone according formula:
where – number of instantaneous signal periods.
Shimmer denotes the deviation of the larynx tone amplitude in the consecutive cycles from the average amplitude of the larynx tone according formula:
where – amplitude of fundamental frequency in instantaneous signal periods.
3. Electroglottography (EGG)
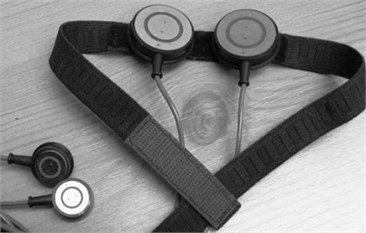
EGG is a noninvasive method for determination of the laryngeal tone by registering glottis electrical impedance. The impedance is measured between two bilaterally electrodes placed on the subject’s skin at level of the thyroid cartilage (see Fig. 3).
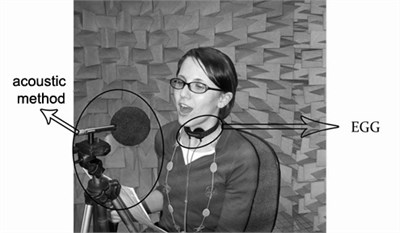
Fig. 3a) EGG electrodes for adults and for children, b) measuring the speech signal in an anechoic chamber in Department of Mechanics and Vibroacoustics AGH UST in Krakow
a)
b)
High frequency current (usually in the range from 300 kHz up to 5 MHz) is passed between these surface electrodes, and electrical impedance changes during the vocal folds movements are displayed and measured (Fig. 4). Impedance is smaller when the vocal cords are approximated and is larger when they are abducted or not approximated. The impedance change, with the vocal cord adducted, is equal to 1 %-2 % of the total neck impedance in the place of examination. The resultant EGG signal, after demodulation, can be recorded and processed, and stored in the computer memory as a time-depended function. The archived signal is the subject of preemphasis improvement and subsequent analysis. EGG does not determine the movements of each fold individually. However, it allows representing the phase of vocal folds closing and openings more accurately than other methods, giving an opportunity to measure directly the time dependence of the fundamental tone and to determine its value. The disadvantage of this method is the vertical laryngeal shift, and neck thickness or shape.
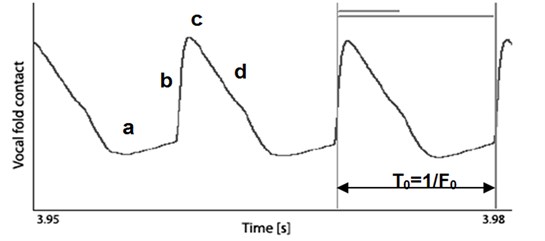
The glottogram, i.e. the function of the electroglottographic signal vs. time, for the vowel a with the prolonged phonation of the normal male voice is depicted in Fig. 4. In addition, the period of the EGG signal and four phases of the folds movements, i.e. a) the folds are at minimum contact (complete opened phase), b) the process of closing, c) the folds are at maximum contact (closed phase) and d) the process of opening, are marked.
Fig. 4Time dependence of the EGG signal (normal male speech) – glottogram
In pathological signals occur for various changes in the course of EEG; flattening, elongation, lack of regularity. Examples of various EEG signal changes depending on the type of vocal tract diseases are shown in Fig. 2.
The main parameters estimated from EGG waveform are: pitch period, open quotient, contact quotient. In the EGG signals the pitch period is usually defined as the duration between maximum positive peaks in the differentiated EGG waveform. These peaks are regarded as instants of glottal closure.
The open quotient () is the ratio of opened glottis to all pitch period according formula:
where – is the time of complete opened phase in instantaneous signal periods, – denotes the duration of the pitch period in instantaneous signal periods
The contact quotient () is the ratio of closed glottis to all pitch period according formula:
where – is the time of complete closed phase in instantaneous signal periods.
The detailed description of this parameters is given in [4].
4. Research material and methodology
The time-dependent acoustic speech signal and the EGG signal were recorded simultaneously in an anechoic chamber, at the Department of Mechanics and Vibroacoustic, AGH University of Science and Technology, Krakow, Poland. The diagram of the measurement setup is shown in Fig. 5. The applied professional registration system provided a transfer band from 20 Hz to 20 kHz at the dynamics amounted to not less than 80 dB.
Fig. 5The block diagram of the measuring setup, where: 40 AF – G.R.A.S microphone, 1201 – NORSONIC preamplifire, 12AA – G.R.A.S amplifire, 1314 – M-AUDIO IN/OUT chart, 6103 – KAYELEMETRICS Electroglottograph (EGG), PC – computer with Adobe Audition 3.0 software

The first goal of this research and analysis was to determine the difference between the , Jitter and Shimmer estimation from the acoustic signals and the EGG signals during phonation. The experiment was carried out on the group of 328 people, both men and women, age 19 to 80 years, so-called standards of Polish language, without any pathologies that could affect the voice quality. This data base had been used in part in earlier research [5-7, 10-13].
The second goal of research was to determine the difference in and parameter between normal and pathological speech. The study has been carried out in cooperation with Otolaryngology Clinic in 5th Military Hospital with Policlinic in Krakow and the Chair and Clinic of Otolaryngology Collegium Medicum of Jagiellonian University in Krakow. The group of 127 patients, both men and women, age 20 to 84 years was divided into 4 groups according to their diagnosis: A – acute states, B – chronic conditions, C – cancer, D – other diseases. In Group B were isolated four subgroup; B1 – hypertrophic chronic rhinitis/laryngitis, B2 – edema of the vocal fold(s), B3 – hard vocal fold nodule, B4 – soft vocal fold nodule (polypus).
The task of the group people being the subjects of examination was to read out the phonetic text slowly and without any intonation. They had to repeat three times: the vowels – a, e, i, u; the vowels with the prolonged phonation – a, e, i, u; the words – ala, as, ula, ela, igła (i.e. Polish names and Polish equivalent for “needle”) and the sentence – dziś jest ładna pogoda (i.e. the Polish equivalent of the sentence “It’s a nice weather today”).
5. Results
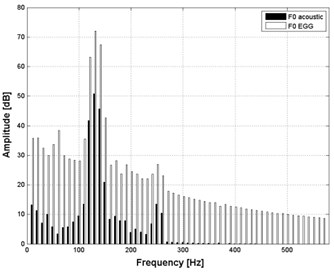
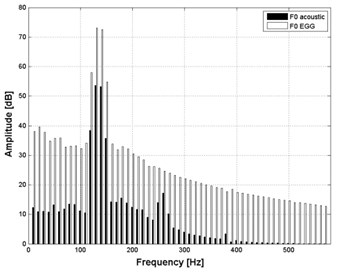
To depict and compare the , determined by the acoustic and the electroglotographic methods, the analysis in the frequency domain was made, using Short Term Fourier Transform (STFT). Before frequency analysis, the data were subjected to the process of preemphasis with the band-pass FIR filter, with 50 Hz and 400 Hz. The dynamical spectrum containing 56 lines with the 10 Hz width, made with the 0.1 s time quantum and the level quantum equal to 0.2 dB, was obtained. The subject of analysis was 4 vowels pronounced by each person (3936 records – 328 persons×4 vowels×3 expression). The goal of this analysis was to determine the difference between the spectra obtained from the acoustic and the EGG signals. These vowels have a fundamental significance in the examination of the voice channel condition (especially of the glottis) because of their stationary-like time dependence. The examples of the over-time-averaged spectra of the vowels with the prolonged phonation, obtained from the EGG and the acoustic signals, are presented in Fig. 6.
Fig. 6Averaged spectrum of the vowel
a) a with the prolonged phonation
b) i with the prolonged phonation
Analysis of the frequency spectra carried out for each investigated signal sample, showed only minor differences (in shape and envelope) between the fundamental tone spectra determined from the acoustic signal and from the EGG signals. The substantial differences, observed in the relative level (amplitude) of recorded signal, are related to the signal normalization process. For each group (acoustic signal sample, EGG signal sample), the averaged minimal value for all samples recorded in the given group was used as a reference level in the logarithmic scale. In the next part of this research, comparison between the averaged values of obtained by the acoustic methods and the value determined with the help of EGG was made. The algorithms carrying out the detection of based on the zero crossing measure (ZCM), higher-order spectra analysis (HOSA), cepstral analysis (CEPA). Were also implemented in the MATLAB environment. Estimation of relative error was done. Table 2 details a sample results for determined in acoustic methods for the a vowel and these are displayed vis a vis results for , determined by the EGG method and example of reference results for relative error , determined according to Eq. (7), for the evaluation of , for the entire group:
The data analysis showed that for all analyzed vowels (the prolonged phonation), the mean squared error for the determination of by using the acoustic methods does not exceed 2 Hz for the zero crossing measure (ZCM), 1.5 Hz for the cepstrum algorithm (CEPA), and only 1 Hz for the higher-order spectra analysis (HOSA) in reference to EGG method. This makes clear that the acoustic methods for derivation are effective and accurate, and can be treated as precise tools for the examination of non-pathologic derived from a healthy glottis.
The next step of this research concerned estimation of mean, standard deviation, minimum and maximum value of , and for normal and pathological speech. Table 3 shows results of this parameters value estimated from EGG normal signals for 4 vowels with prolonged phonation (3936 records – 328 persons×4 vowels×3 expression).
Table 2Example results for calculation of relative error of F0 function for the a vowel with prolonged phonation
ID of sample | [Hz] (EGG) | [Hz] (ZCM) | [Hz] (CEPA) | [Hz] (HOSA) | % (ZCM) | % (CEPA) | % (HOSA) |
1 | 119 | 119 | 119 | 119 | 0 | 0 | 0 |
2 | 109 | 109 | 109 | 109 | 0 | 1 | 0 |
3 | 101 | 101 | 107 | 100 | 0 | 6 | 1 |
4 | 98 | 99 | 104 | 98 | 1 | 6 | 0 |
5 | 126 | 128 | 122 | 126 | 1 | 3 | 0 |
6 | 123 | 122 | 121 | 123 | 0 | 2 | 0 |
7 | 108 | 108 | 108 | 108 | 0 | 0 | 0 |
8 | 123 | 123 | 121 | 123 | 0 | 2 | 0 |
9 | 94 | 94 | 101 | 94 | 0 | 8 | 0 |
10 | 120 | 120 | 118 | 119 | 0 | 1 | 0 |
Table 3Results of Jitt, Shim and CQEGG estimation for 4 vowel with prolonged phonation – normal speech
Parameter | Gender | |||
Male | Female | Jointly | ||
[%] | Mean | 0,6 | 1,1 | 0,9 |
Std | 0,3 | 0,6 | 0,5 | |
Min | 0,2 | 0,4 | 0,2 | |
Max | 1,9 | 3,9 | 3,9 | |
[%] | Mean | 1,9 | 2,1 | 2,0 |
Std | 1,0 | 1,1 | 1,0 | |
Min | 0,1 | 0,1 | 0,1 | |
Max | 4,8 | 4,7 | 4,8 | |
[%] | Mean | 45,0 | 43,6 | 44,3 |
Std | 3,6 | 3,5 | 3,6 | |
Min | 33,1 | 36,3 | 33,1 | |
Max | 52,4 | 56,8 | 56,8 | |
Table 4 shows results of parameters value estimated from EGG pathological signals for 3 exemplary diseases – polypus, vocal fold nodule, laryngeal cancer, 4 vowels with prolonged phonation (936 records – 78 persons×4 vowels×3 expression).
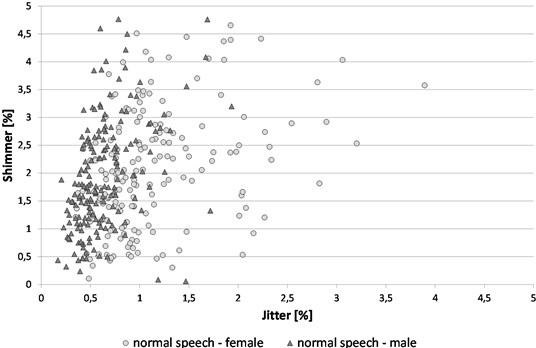
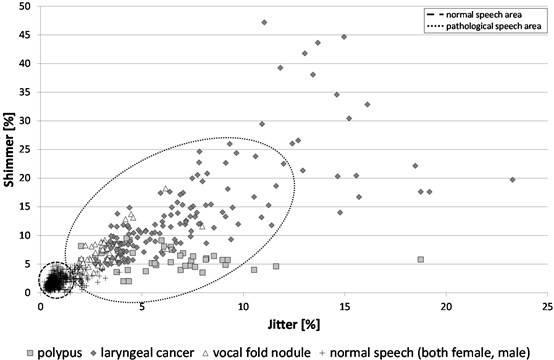
To check separability of the class of vocal tract condition visualization of the results obtained Jitter and Shimmer parameter in a 2 dimensional space was proposed. Fig. 7 provide visualisation of the EGG normal signals for 4 vowels with prolonged phonation only for 15 female and 15 male persons (because of good clarity of figure was used a reduced amount of presented data). Both Table 3 and Fig. 7 show that none of the normal speech parameter value (, ) exceeds the value of 5 %. Fig. 8 provide visualisation of the EGG pathological signals for 4 vowels with prolonged phonation for 9 female and 21 male persons.
Table 4Results of Jitt, Shim and CQEGG estimation for 4 vowel with prolonged phonation – pathological speech
Parameter | Disease | |||
Polypus | Vocal fold nodule | Laryngeal cancer | ||
[%] | Mean | 3,2 | 2,9 | 6,3 |
Std | 0,8 | 1,9 | 4,1 | |
Min | 2,0 | 1,6 | 2,0 | |
Max | 6,1 | 8,0 | 23,3 | |
[%] | Mean | 5,9 | 6,6 | 11,7 |
Std | 1,9 | 3,2 | 8,9 | |
Min | 2,0 | 2,9 | 2,0 | |
Max | 9,5 | 18,2 | 47,2 | |
[%] | Mean | 44,2 | 47,8 | 50,3 |
Std | 6,3 | 5,4 | 5,4 | |
Min | 32,1 | 39,3 | 37,4 | |
Max | 55,9 | 56,5 | 65,8 | |
In contrast, Fig. 9 shows a total arrangement on the plane normal and pathological conditions of glottis. We see a clear area of division between objects diagnosed as speech pattern from objects diagnosed as disease. In addition, the division of the area contains objects with a diagnosis; vocal fold nodules, further polypus and at the end - laryngeal cancer. Such an arrangement (in that order) has its justification in terms of the assessment of disease – cancer of the larynx, as the most burdensome and advanced disease, vocal fold nodules – as a more “delicate”. In Fig. 8 for each diagnosis of the disease trend lines were determined. These lines for laryngeal cancer and vocal fold nodule has been growing (value and increases linearly), and for polypus character is constants (for a constant parameter shimmer (approx. 5 %)). The average values of for the analyzed glottis diseas are not less than 2.9 % (vocal fold nodule – 2.9 %, polypus – 3.2 %, laryngeal cancer – 6.3 %) and the average values of are not less than 5.9 % (vocal fold nodule – 6.6 %, polypus – 5.9 %, laryngeal cancer – 11.7 %). This fact, with significantly lower values of these parameters for normal speech, confirm the usefulness of these parameters in the diagnosis of the glottis conditions.
Fig. 7Visualization of Jitter × Shimmer feature for normal speech (female, male)
Severability parameter values in the classes is the most noticeable between laryngeal cancer 50.3 ± 5.4 % and 44.3 normal speech ±3.6 %. Inside the classes it is also evident between the polypus 44.2 ± 6.3 % and laryngeal cancer 50.3 ± 5.4 %, and to a lesser extent, with vocal fold nodules 47.8 ± 5.4 %.
Fig. 8Visualization of Jitter × Shimmer feature for pathological speech (laryngeal cancer, polypus, vocal fold nodule)
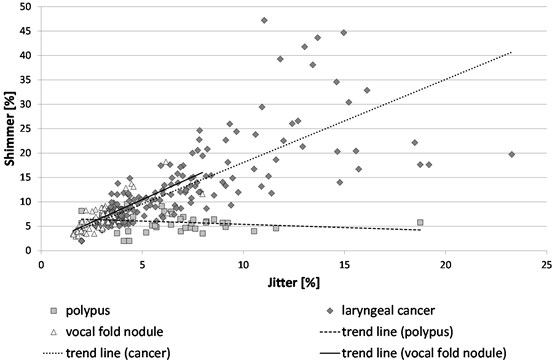
Fig. 9Visualization of Jitter × Shimmer feature for pathological speech (laryngeal cancer, polypus, vocal fold nodule) and normal speech (both female and male)
6. Conclusions
This paper presents a next, consecutive stage of author’s research, concerning simultaneous measurement of fundamental frequency of vocal fold vibration by the electroglottography (EGG) and with the acoustic methods for both pathological and normal speech signals. The analysis of the glottogram function exactitude, its parametrization and the usefulness of these methods were executed too. The presented results may be used as practical premises during construction of computer systems employing the speech signal for medical diagnosis and therapy. Such systems (implemented in mobile computers) may be used the therapeutic teams (laryngologists, phoniatrists, speech therapists). Further studies are directed towards the application of effective recognition processes to the medical imaging (e.g. artificial intelligence algorithms – artificial neural networks, multidimensional analysis – supportive vectors machine). Such systems are successfully used for monitoring the status of machines or technical objects [14-19].
References
-
Titze I. R. Principles of Voice Production. Prentice-Hall Inc., Englewood Cliffs, New Jersey, 1994.
-
Tadeusiewicz R. Speech Signals, WKiŁ, Warszawa, 1988, (in Polish).
-
Hess W. Pitch Determination of Speech Signals. Springer-Verlag Berlin, Heidelberg, New York, Tokyo, 1983.
-
Marasek K. Electroglottography Description of Voice Quality. Phonetic AIMS. Univesitat Stuttgard, 1997.
-
Engel Z., Kłaczyński M., Wszołek W. A vibroacoustic model of selected human larynx diseases. International Journal of Occupational Safety and Ergonomics, Vol. 13, Issue 4, 2007, p. 367-379.
-
Wszołek W., Kłaczyński M., Engel Z. The acoustic and electroglottographic methods of determination the vocal folds vibration fundamental frequency. Archives of Acoustics, Vol. 32, Issue 4, 2007, p. 143-150.
-
Wszołek W., Kłaczyński M. Analysis of Polish pathological speech by higher order spectrum. Acta Physica Polonica A, Vol. 118, Issue 1, 2010, p. 190-192.
-
Swami A., Mendel J. M., Nikias C. L. Higher-Order Spectral Analysis Toolbox for use with Matlab. Natick, The MathWorks Inc., 1995.
-
Xudong J. Fundamental frequency estimation by higher order spectrum. IEEE International Conference on Acoustics, Speech and Signal Processing, Vol. 1, Issues 5-9, 2000, p. 253-256.
-
Wszołek W., Kłaczyński M. Estimation of the vocal folds vibration fundamental frequency by higher order spectrum. Archives of Acoustics, Vol. 33, Issue 4, 2008, p. 183-188.
-
Wszołek W., Kłaczyński M. Comparative study of the selected methods of laryngeal tone determination. Archives of Acoustics, Vol. 31, Issue 4, 2006, p. 219-226.
-
Wszołek W., Kłaczyński M. Outcome of F0 determination using acoustic and electroglottographic algorithms. Speech and Language Technology, Polish Phonetic Association, Poznan Division, Issues 12/13, 2009/2010, p. 39-49.
-
Kłaczyński M., Wszołek W. Electroacoustic methods of determining the parameters of speech sound generator. Vibroengineering Procedia, Vol. 3, 2014, p. 278-283.
-
Burdzik R., Konieczny Ł., Figlus T. Concept of on-board comfort vibration monitoring system for vehicles. Activities of Transport Telematics, Vol. 395, 2013, p. 418-425.
-
Burdzik R., Konieczny Ł. Application of Vibroacoustic Methods for Monitoring and Control of Comfort and Safety of Passenger Cars. Mechatronic Systems, Mechanics and Materials II. Book Series: Solid State Phenomena, Vol. 210, 2014, p. 20-25.
-
Dabrowski D., Cioch W. Neural classifiers of vibroacoustic signals in implementation on programmable devices (FPGA) – comparison. Acta Physica Polonica A, Vol. 119, Issue 6A, 2011, p. 946-949.
-
Kłaczyński M., Wszołek T. Artificial intelligence and learning systems methods in supporting long-term acoustic climate monitoring. Acta Physica Polonica A, Vol. 123, Issue 6, 2013, p. 1024-1028.
-
Kłaczyński M., Wszołek T. Detection and classification of selected noise sources in long-term acoustic climate monitoring. Acta Physica Polonica A, Vol. 121 Issue 1A, 2012, p. 179-182.
-
Wszołek T., Kłaczyński M. Automatic detection on long-term audible noise indices from corona phenomena on UHV AC power lines. Acta Physica Polonica A, Vol. 125, Issue 4A, 2014, p. 93-98.
About this article
The research project referred to in this paper was implemented within the framework of project No. 11.11.130.955
