Abstract
The paper concerns the modelling and simulation of dynamic systems: PRT vehicle – track. A nominal model of the system has been presented and parameter values have been identified. The equations of motions were generated using MBS software (Multibody Systems): Mattlab-Simulink-Simmechanics. Simulation studies focused on the analysis of the impact of suspension on selected dynamic properties. Such an analysis is in fact a form of parametric sensitivity analysis with simulation methods.
1. Introduction
At present, there is a huge increase in interest in ATN systems ATN (Automated Transit Network) [1], that is, systems of automated means of transport. There are conferences on this subject held regularly, e.g.: Automated People Movers [2-4] and Advanced Transportation symposium and Podcar City [5-6].
The term PRT (Personal Rapid Transit) [7-8] refers to the transport system consisting of automatically moving vehicles (driverless) on light terrestrial infrastructure, realizing “door-to-door” transport. PRT system belongs to the category of ATN systems with one specific direction of movement (category A in the ROW classification ROW – Right of Way). It is a public transport system that has many characteristics of individual transport and is included in the category of rail transport. The vehicles may be substituted to the initial stop on-call and wait there for the arrival of the passenger. The transfer takes place from the initial to the final stop without stopping at intermediate stops. This function enables collision-free stops with special topologies.
Fig. 1Experimental track for studies of vehicle dynamics and motion control system operation (Warsaw University of Technology – ECO Mobility)
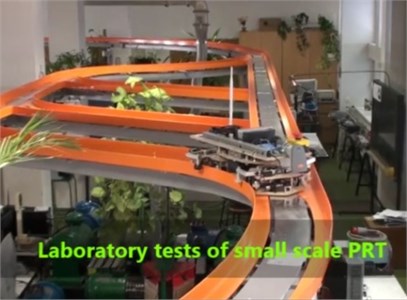
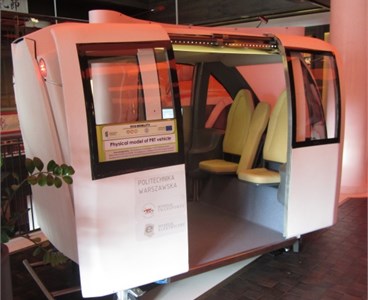
Fig. 2PRT cabin model (Warsaw University of Technology – ECO Mobility)
Currently there are two operating PRT systems in the world (but with very simple, one-way track systems): “British Ultra” [9] (l Heathrow airport in London – terminal V) and Swedish-British-Korean “Vectus” [10] (a line in a national park in Korea). There are advanced new construction PRT projects, e.g. the city of Masdar – joint project of European Union and United Arab Emirates [11] and the city of San Jose [12] – joint project of more than 20 US institutions (participation of Polish institution). Experience gained so far puts up a PRT system as satellite transport system for Monorail-type railways and metro.
PRT systems proposed today use dedicated track systems which are not designed to be shared by other vehicles. It should be noted, however, that there is a new trend of “Quick Way” [13], “Quick Traffic”, of being able to share the infrastructure with autonomous vehicles (“driverless car”, “autonomous car”).
Design work on the possibility of the implementation of PRT in Polish conditions was carried out at the Faculty of Transport of the Warsaw University of Technology as part of the first ECO-Mobility project [14]. In ECO-Mobility there was particular emphasis on enabling the individual use of the means of transport by people with reduced mobility, moving in a wheelchair [15]. The designed PRT also offers such opportunity. In the course of the work carried out under ECO-Mobility project, a laboratory physical track model was made in 1:1 scale, as shown on Fig. 2 [16-18]. The effects of the work include an increased interest in PRT system in the country. There is a real chance for the implementation of first pilot lines e.g. in the city of Rzeszów.
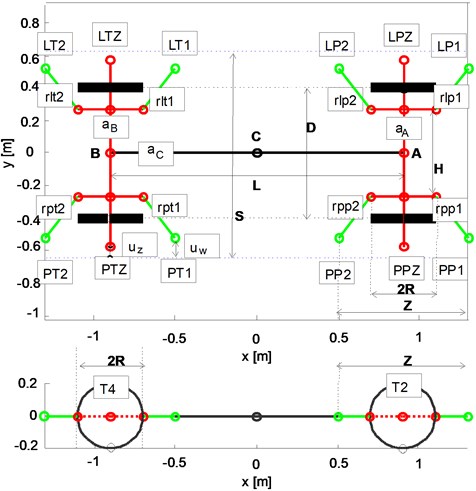
Fig. 3PRT model structure
The track system, used in the solution developed at the Department of Transport of the Warsaw University of Technology, is characterized by horizontal and flat surfaces limited on the outside by vertical guide surfaces. The vehicle has two steering axles with independently rotating wheels. Wheel have cylindrical roll surfaces with polyurethane wrap without the profile characteristic of railway wheel [19-20]. Driving the vehicle on the track is provided by a system of lateral rolls mounted on the vehicle, which cooperate with the vertical side surfaces of the track. The vehicle is powered by an electric linear induction motor (LIM) [21]. Laboratory/experimental tests of the dynamic properties of PRT vehicle of the aforementioned structure of running gear were performed on a reduced scale model [22]. These studies confirmed that the running gear is characterized by very good radial positioning of the axis of vehicle when cornering, with the absence of the so-called centring mechanism. The results of tests in the reduced scale model, however, must be scaled in accordance with the adopted scaling methodology [23]. In the current phase of the project we are developing a pre-prototype of virtual vehicle in actual scale. In the following article we will present the results of simulation studies on parametric sensitivity of the model. At this point, it is necessary to present a few limitations of these studies:
1) There was no validation of the analysed model in actual size because currently there is no possibility of making a test section of track in actual size;
2) The simulation model was made in MBS environment using TNO Delft Tyre library for tyres;
3) The analysis of parametric sensitivity concerns the parameters of elastic-dumping elements of suspension and arms of side rolls because their values significantly influence the dynamics of the model;
4) The parametric sensitivity analysis used a method for evaluating the characteristics of the movement informing of the future exploitation wear of wheels and rolls.
The use of MBS software has many advantages [24]: it enables automatic generation of motion equations and realization of the computer simulation process. Professional environments are equipped with a whole range of libraries for the description of special elements: contact, collisions, electrical systems (including motors and converters), control and automatic regulation systems, pneumatic or hydraulic. It is widely used for solving the virtual pre-prototyping tasks. Using the TNO Delft Tyre model [25] (TNO is Netherlands Organisation for Applied Scientific Research) provides professional description of the tyre dynamics. However, its use has important implications in the construction of the entire simulation model, because this model only works correctly in inertial frames of reference. For this reason, in the description of the vehicle’s dynamics there is no application for non-inertial frames of coordinates associated with the centre of the track or the centre of virtual vehicle set in the radial curvature of the arc, the so-called referential vehicle. In the description of the forces, there are no inertial forces associated with the change of position of non-inertial reference frames. In order to maintain movement it is necessary to use actual active “traction” force balancing the model’s energy loss. Controlling this force cannot be the cause of any vibration of vehicle structure elements.
The studies of parametric sensitivity used a method of analysis of characteristics’ functions. Characteristics are understood as convenient measures to quantify vibration during journeys. This practice shows that the best measures for this are various energetic indicators: the energy loss of tyres, total energy consumption, the effective value of the component alternate of deviation of the centre of the vehicle from the reference point. This practice also shows that as with rail vehicles, it is impossible to choose suspension parameters which would be best for both straight and curved sections. The presented solution should be considered a compromise.
The most important yet unsolved problem is the lack of validation of the model. It will be performed in the future as long as a test track will be available. It should be noted, however, that when it comes to studies of movement properties of the scaled vehicle model, a sufficient consistency between simulation and physical model has been achieved.
2. Nominal model
The structure of PRT vehicle model is shown on Fig. 3. The model consists of the following blocks: body, a set of front wheels, a set of rear wheels, tyres, roll arms and contact rolls. In Fig. 3 the blocks and connection points are marked as follows: C – body, A – a set of axle front, B – a set of axle rear, T1, T2, T3, T4 – tyres, LP1, LP2 – rolls front left , LT1, LT2 – rolls back left , PP1, PP2 – rolls front right, PT1, PT2 – rolls back right, rpp1, rpp2 – arms of first and second roll front right, rpt1, rpt2 – arms of first and second roll back right, rlp1, rlp2 – arms of first and second roll front left, rlt1, rlt2 – arms of first and second roll back left. Axes of symmetry surface of the blocks were marked as follows: aC, oC – longitudinal and perpendicular axis of the body, aA, oA – longitudinal and perpendicular axis of the set of front wheels, aB, oB – longitudinal and perpendicular axis of the set of back wheels. It was assumed that the origin of the coordinate system determines the rectangular projection of centerpoint of block C on the road surface. Basic geometric dimensions of the vehicles are shown in Table 1, and the coordinates of the geometry of the front right quadrant in Table 2.
Table 1Basic geometric dimensions of the vehicle
Symbol and indication | Value [m] |
L – axle base | 1,8 |
D – wheelbase | 0,8 |
Z – roll base | 0,8 |
R – radius of the circle | 0,2 |
H – spacing of arm brackets | 0,533 |
S – track width | 1,08 |
uz – outer roll clearance | 0,03 |
uw – inner roll clearance | 0,02 |
Table 2Coordinates of the points of geometry of front left quadrant
Symbol and indication | Value [m] |
LP1 – inner first | 1,3 0,52 0 |
LP2 – inner second | 0,5 0,52 0 |
LPZ – outer | 0,9 0,57 0 |
T1 – centre of the circle | 0,9 0,4 0 |
A – centre of the set axis | 0,9 0,4 0 |
rlp1 – first arm | 1.1 0.2667 0 |
rlp2 – second arm | 0.7 0.2667 0 |
Table 3Masses of vehicle blocks
Mass of | kg |
mbody – body net | 800 |
mpass – 3 passengers | 240 |
mdiss – disabled people in active wheelchairs | 160 |
mbrut – total mass of body | 1200 |
maxle – wheel set | 25 |
marm – arm | 5 |
mroll – roll | 0,5 |
Table 4Moments of inertia of vehicle blocks
Moment of inertia | kg m2 |
IBody_XX – body about axes x IBody_YY – body about axes y IBody_ZZ – body about axes z | 280 700 750 |
IAxle_XX – wheel set about axes xIAxle_YY – wheel set about axes yIAxle_ZZ – wheel set about axes z | 2 0,5 2 |
IArm_XX– arm d about axes x IAxle_YY – arm d about axes y IAxle_ZZ – arm d about axes y | 0,050 4 10-5 4 10-5 |
Table 5Tyre model parameters
Symbol and indication | Value |
RTyre – free tyre radius | 0,2 m |
dtyre – width of the tyre | 0,08 m |
RCarr – rim radius | 0,19 m |
htyre – height of the tyre | 0,01 m |
mcarr – mass of wheel | 8 kg |
mTyre – mass of tyre | 1 kg |
ICarr_XX – carrier diametral moment of inertia ICarr_YY – carrier polar moment of inertia | 0,11 kg m2 0,2 kg m2 |
ITyre_XX – tyre diametral moment of inertia ITyre_YY – tyre polar moment of inertia | 0,03 kg m2 0,05 kg m2 |
ctyre – tyre vertical stiffness | 1,85 107 N m-1 |
dtyre – tyre vertical damping | 5 104 N m-1 s |
FTN – nominal wheel load | 4 kN |
3. Nominal parameters of the model
Symbols and values of the masses of vehicle model block were summarized in Table 3. Table 4 shows the labels and values of moments of inertia. Table 5 shows the parameters of the tyre model and Table 6 – spring-damping connections (Joint Spring & Damper).
It was assumed that roll arms may only rotate about vertical axis aZ. The range of motion is limited in practice to angle φ0= 0.0873 rad (5 deg). For deviations in the range of angle ± φ0 elasticity is described by a linear function with rotational spring rate of value c0= 4.6346 103 Nm rad-1. For deviations exceeding the limit angle elasticity is described by non-linear function c0+c4(φ-φ0)4 with rate c4 at 5.9385 103 Nm rad-4. Rotating damping of the arm is described in the whole range of motion by a linear function with damping rate of 82,5 Nm rad-1 s.
Table 6Parameters of Joint Spring and Damper
Symbol and indication | Value |
Cbody_prism – suspension front vertical translational stiffness | 588600 N m-1 |
Dbody_prism – suspension front vertical translational damping | 29430 N m-1 s |
Cbody_roll – suspension front roll torsional stiffness | 1.1863 103 Nm rad-1 |
Dbody_roll – suspension front roll torsional damping | 59 Nm rad-1 s |
Cbody_yaw – suspension front yaw torsional stiffness | 150 Nm rad-1 |
Dbody_yaw – suspension front yaw torsional damping | 7,5 Nm rad-1 s |
4. Basic coordinate systems
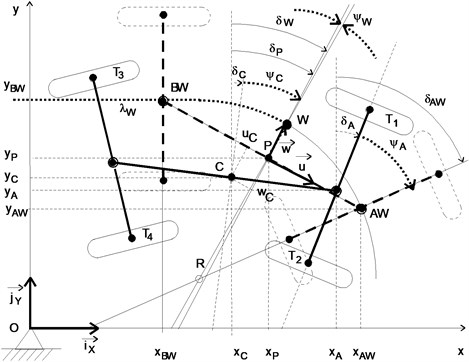
It was assumed that in a given moment t0 the geometric centre of the vehicle is in point C. Location of the vehicle and coordinate systems on the surface of the road are shown on Fig. 4. Three frames of reference have been identified: inertial O(iX,jY), non-inertial W{λW,δW} and non-inertial P{λW,δP}. Reference system O(iX,jY) is stationary and has its origin in point O, which is the geometric centre of the vehicle in the initial point of movement. Reference system W{λW,δW} is movable. The origin point W is on the axis of the centre of the track at a distance λW from the point O calculated along the line of the axis of the track. The direction of the transverse axis of this frame of reference coincide with the normal and the longitudinal axis with the tangent to the track curvature of point W. Angle δW is the angle of inclination of the normal relative to axis Ox of the inertial system. Reference system W{λW,δW} is called the centre of the track system. Reference system P{λW,δP} is movable. It describes the so-called radial position of the vehicle, that is, such a position where vehicle’s front point AW and back point BW lie on the axis of the centre of the track. The origin point of system P is placed in the geometric centre of vehicle set in such position. Reference axes define the axes of surfaces of vehicle symmetry – longitudinal and transverse. Angle δP is the angle of inclination of the axis of the transverse surface of the vehicle relative to the axis Ox of inertial system. The reference system P{λW,δP} is called the referential system.
In inertial coordinate system O(iX,jY) the position of points A, B, C of the model can be expressed as: C(xC,yC,δC), A(xA,yA,δA), B(xB,yB,δB). Between coordinates there are relations:
In the same coordinate system O(iX,jY) relations between coordinates of points AW, BW, P of the model can be expressed as:
where in due to the isolation of a specific reference system W(λW,δW) we further receive:
where the longitudinal variations were marked: αW=xW-xP; βW=yW-yP.
In contrast, between the coordinates of points of actual position of the vehicle and coordinates of the points of referential position there are relations:
where the longitudinal variations were marked: αP=xP-xC; βP=yP-yC.
Due to the rotation of reference system P{λW,δP} in relation to system O(iX,jY) at an angle δP, the relations between deviations will take the following form:
where: uP, wP – coordinates of the centre of vehicle C in reference system P{λW,δP}.
Fig. 4Coordinate system centred in the axis of the track and radial reference position of the vehicle. Marked: W – centre point of the coordinate system, λW – length of centre track axis line to the point W, δW – inclination of the radius of curvature of track centre in point W, P – enter of referential vehicle, δP – inclination of transverse axis of referential vehicle, ΨW – deviation angle of perpendicular axis of referential vehicle to the radius of curvature of track centre in point W, AW – point of reference vehicle front, δAW – inclination of the axis of front wheels of the referential vehicle, ΨW – angle of the deviation of vehicle axis from referential vehicle axis
Presented relations show how it can be possible to describe the position of model’s elements:
1) In the inertial frame of reference O(iX,jY) by (1, 2) the coordinates of position will be: (xC, yC, δC, δ12, δ34), that is 3 variables describing the position of block C and two steering angles to describe the position of blocks A and B;
2) In the auxiliary reference system W{λW,δW} by (6, 7, 8) the variables describing the actual positions are: (αP, βP, ΨC, ΨA, ΨB), that is 2 variables describing deviation between points P and along directions (iX, jY) and 3 angular deviations from the radial position of blocks A, B and C. The basic movement is described by variables: (xP, yP, δP, δAW, δBW).
3) In non-inertial frame of reference P{λW,δP} the vehicle coordinates may be expressed with a set of variables: (uP, wP, ΨC, ΨA, ΨB). The basic movement of frame of reference is described by variables: (xP, yP, δP, δAW, δBW).
5. Equations of motion of plane model in inertial frame of reference
Using MBS software has many advantages: it enables the automatic generation of motion equations and implementation of computer simulation process. MBS simulation model describes the dynamics of the system in 3D space. However, it is also worth it to form motion equations of plane model because they enable the analysis of the dynamic interactions between model elements. Based on Eq. (1)-(10) assuming mA=mB we will obtain:
where: ΣFX , ΣFY – sum of forces influencing the vehicle in the directions of axes OX and OY brought to the centre point of the vehicle, ΣTC, ΣTA, ΣTB – sum of torques influencing blocks A, B and C according to constraints.
6. External forces
Eternal forces include forces of wheel contact, forces of guide rolls and driving power. In the presented simulation model made in Matlab – Simulink – SimMechanics environment, in order to describe the dynamic of the wheels we used block TNO Delft Tyre. The parameters of the model were determined based on own research and described in file TNO Tyre express. The values of the parameters were defined in the chapter “Nominal parameters”. The method of determining forces and torques of TNO Tyre model is standard [25] and was used in the studies of car dynamics, including the ECO-Mobility project [26-27].
The roll model structure is shown in Fig. 5. Contact forces are treated as spring-damping forces of collision on the edge of force. For the mathematical description of the forces, non-linear functions were used:
where: [Frn, Frs] – normal force and tangential of roll contact, [Vrn, Vrs] – normal and tangential velocity, hrn – distance between roll and point of contact with the edge of the rail (in the direction normal to the curvature of the track), crn – coefficient of non-linear elasticity, [krn, krs] – damping coefficients, [kwr, kws] – dimensionless coefficients expressing the relative maximum value of the damping forces (relative to the spring force, e.g. 2 % spring force).
The parameter values were adopted as follows: crn= 104 (N/m) ¼ (force 1 kN at the trough 1 mm), krn= 500 N m-1 s (force 0,1 kN for speed Vrn= 0,2 m/s), krs= 100 N m-1 s (force 0,1 kN for speed Vsn= 1 m/s).
At the time of the contact (when hrn< 0) the spring force increases very rapidly with the increasing insertion into the edge of the rail. It is accompanied by a damping force, the value of which does not exceed 2 % of the force in the normal direction.
In order to maintain speed of the model in an inertial coordinate system, we need a force acting on the vehicle. It is assumed that the force acting along the direction of movement keeps constant kinetic energy of the vehicle. Force can be expressed with the equation:
where: ΔPQ – force of model’s motion, FS – force compensating for energy losses acting on the centre of the vehicle in the direction tangential to the resultant speed of the system, VC – velocity of the centre of mass, ds – increase in distance travelled by the centre of vehicle C, dQD – increase of energy losses.
Fig. 5Roll model
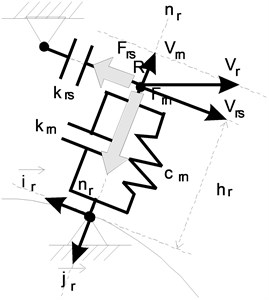
Fig. 6Control system simulation model
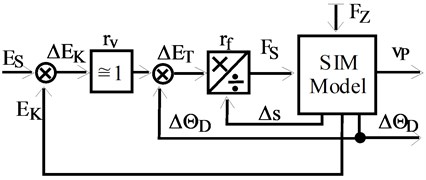
The system of model’s speed control is shown in Fig. 6. In the model there are various disturbing forces FZ associated with energy dissipation. The demonstrated control system consists of power controller and a serial speed controller. The task of speed controller is to adjust the current speed to assigned energy value. If an object controlled with a force controller has some dynamics (usually inertia), it is necessary to correction component rv (usually an integral component). This correction is not needed in the case of steering the speed of an ideal object. This is the case with the non-inertial theoretical model. Then we can assume rv= 1. In addition, with the condition of maintaining a constant kinetic energy, the set and actual kinetic energy are equal: ES=EK. The energy offset is zero ΔET= 0. In this case, control refers to the implementation of Eq. (18). The presented method of maintaining velocity is different from using a PID controller. Its advantage is that it does not result in the presence of additional vibrations of model elements associated with the execution of the task of maintaining speed. It is necessary, however, to precisely determine the current energy loss in the model which is feasible only in the theoretical calculations.
Energy losses consist of energy losses in rolls, wheels and steering pivots (connection points). Using Eqs. (16), (17) the sum of energy loss of the roll-edge system can be expressed as:
where: ΔPr – the sum of energy loss on the roll system (for normal and tangential curvatures of the track), Frnt – roll contact damping force to the normal direction (the second component of the Eq. (17)).
In contrast, the amount of energy loss of the motion of wheel composed of a tyre and a wheel body (carrier) can be expressed using the coordinates (state variables) of TNO Wheel+Tyre model. We receive:
where: ΔPW – sum of wheel’s energy losses, FTLO – longitudinal tyre force, VTσx – longitudinal tyre slip velocity, FTLA – lateral tyre force, VTσy – lateral tyre slip velocity, FTz – vertical tyre force, VTz – tyre compression velocity, TWz – self aligning moment, ωWz – tyre yaw velocity, TWy – rolling resistance tyre moment, ωWy – wheel angle velocity, TCy – rolling resistance carrier moment.
7. Simulation results
In order to investigate the properties of the model movement, we performed simulation tests on the track, which is represented in Fig. 7. This is the part of the track which will often appear in station systems or urban networks in areas of intense development. The simulations were performed assuming that the initial speed is 2 m/s and with the additional condition of maintaining a constant kinetic energy of the model during movement.
Fig. 8 shows the distance between points ABC of the vehicle (front, back and middle) and the points of reference position. Distance charts were marked as follows: red – vehicle centre point C, green – vehicle front point A, blue – vehicle back point B. If the vehicle path coincided with the reference position, all distance should be zeros.
Fig. 9 shows the deviation angles of the axes of the vehicle model’s wheel sets from normal to the curvature of the track. Charts of deviation angles of wheel sets are marked as follows: green – front axle wheel set, blue – back axle wheel set. If the vehicle was setting radially to the curvature of the track, all deviation angles should be zeros.
Fig. 7Assigned centreline of the track
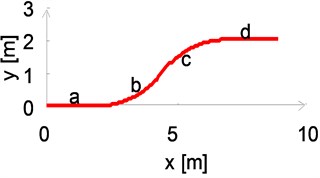
Fig. 8Distance between points A, B, C of the vehicle from reference position points
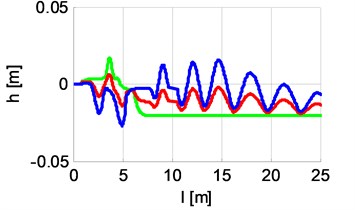
Fig. 9Angles of deviation of the axles from normal
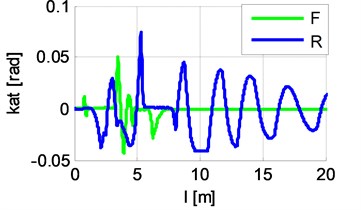
Fig. 10Distance between back left quadrant rolls and the edge of the rail
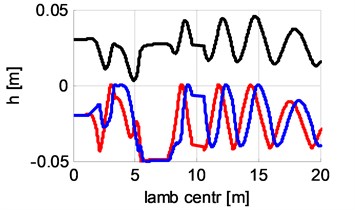
Fig. 10 shows the distances between back left quadrant rolls and the edge of the rail. The chart colours denote the distances for rolls as follows: black – LTZ, red – LT1, blue – LT2. In the moments when the distance from the inner roll LT1 or LT2 reaches positive value, contact forces are generated. Rolls’ contact forces are shown in Fig. 11.
Fig. 12 shows waveforms of vertical tyre force back. It is evident that during cornering, the inertia forces giving additional load to the wheels on the outside of the motion curvature. Fig. 13 shows waveforms of lateral tyre force back. There are visible effects of lateral drift during cornering. Fig. 14 shows the diagrams for longitudinal tyre force back, and Fig. 15 – tyre side slip angle back.
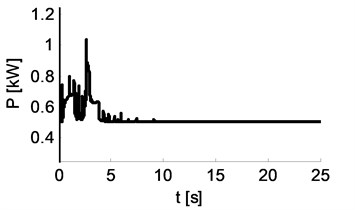
Fig. 15 shows the course of movement loss power (calculated on the basis of Eqs. (14)-(16) – the model does not account for the aerodynamic resistance of movement). Fig. 16 shows the components of energy balance: M – kinetic of linear motion (translational), I – kinetic of rotational motion (torsional), W – loss in wheels, R – loss in rolls. Fig. 16 shows that the sum of M and I (total kinetic energy) is constant. The greatest energy losses occur in the wheels of the vehicle. Fig. 16 shows the course of power correction provided by the tractive force in order to maintain constant kinetic energy of the vehicle.
Fig. 11Roll contact force
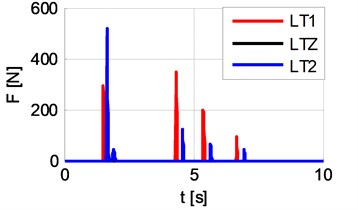
Fig. 12Vertical tyre force back
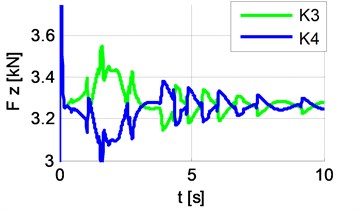
Fig. 13Lateral tyre force back
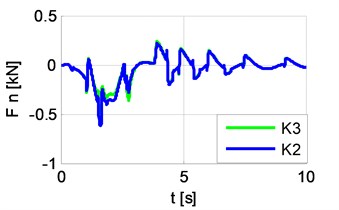
Fig. 14Longitudinal tyre force back
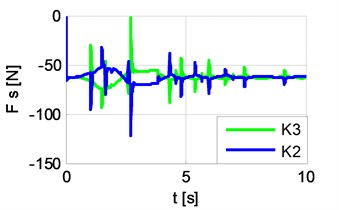
Fig. 15Energy balance components
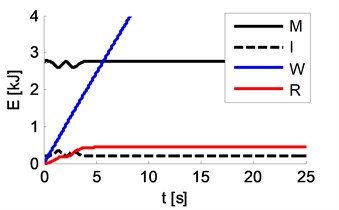
Fig. 16Power supplied to maintain constant motion energy
The presented simulation results quite accurately describe the properties of PRT vehicle movement. Both during cornering and going in a straight line there are type yaw rotary vibrations on the axis of the vehicle. Fig. 8 and 10 show that at the time of passing from the turn to straight line, the vehicle moves in a particular way. The front axle is perpendicular to the axis (which is normal) and adhered (transferred) to the right edge of the track (which is not normal). The back axle carries the oscillations in the central part of the track. What is particularly disturbing are the quite large amplitudes and times of occurrence of these vibrations while leaving the turn. The problem of studying the causes of these vibrations may be the subject of a separate analysis.
8. Parametric sensitivity analysis of the characteristics of journeys
The aim of the study is to clarify the influence of parameters chosen (spring Cbody_yaw and damping Dbody_yaw of the suspension) on the type yaw rotating tilt of the vehicle’s wheel sets seen in the results of the simulation.
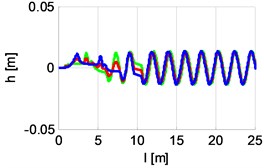
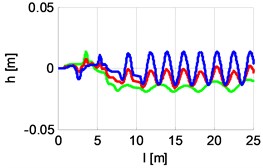
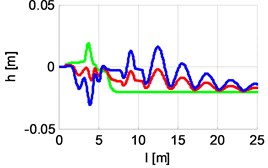
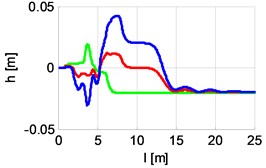
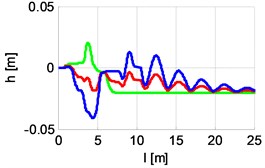
The studies have been performed by the method of simulation. The variables (so-called control variables) are spring and damping of the suspension. In the first phase of the study it is assumed that damping is directly proportional to spring. Table 7 shows with the values Cbody_yaw=0, 60, 180 Nm rad-1 the waveforms of distances between points A, B, C of the vehicle and the reference position, and waveforms of energy supplied to maintain constant motion energy change. Table 8 shows the same for values Cbody_yaw= 200, 220, 280 Nm rad-1. The results show that with small stiffness of yaw spring of the suspension, the vehicle has better drivability in turn than in straight line (the deviations of ABC points and energy is lower for curve phase than the straight line phase). With higher stiffness the situation is reversed – the vehicle moves better on a straight line than in curve. The conclusion is that, just as for rail vehicles, it will not be possible to choose the parameters of suspension spring so that the vehicle sets up perfectly for both straight lines and curves.
Table 7Waveforms for distance and power for Cbody_yaw= 0, 60, 120 Nm rad-1
 |  |  |
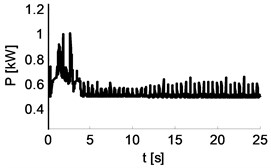 | 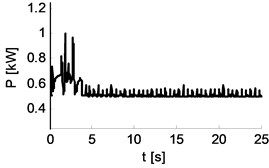 | 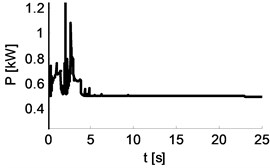 |
Cbody_yaw= 0 Nm rad-1Dbody_yaw=0 Nm rad-1 s | Cbody_yaw=60 Nm rad-1Dbody_yaw=3 Nm rad-1 s | Cbody_yaw=180 Nm rad-1Dbody_yaw=9 Nm rad-1 s |
Table 8Waveforms for distance and power for Cbody_yaw= 200, 220, 280 Nm rad-1
 |  | 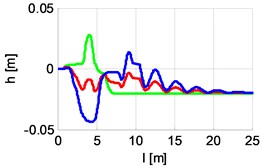 |
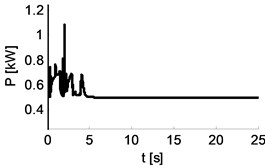 | 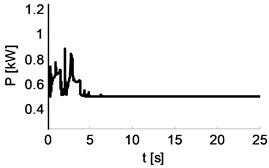 | 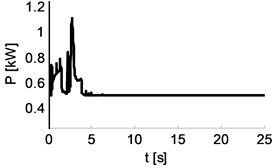 |
Cbody_yaw= 200 Nm rad-1Dbody_yaw=10 Nm rad-1 s | Cbody_yaw=220 Nm rad-1Dbody_yaw=11 Nm rad-1 s | Cbody_yaw=280 Nm rad-1Dbody_yaw=14 Nm rad-1 s |
Graphs of functions shown in Tables 7 and 8 show that the convenient metrics to evaluate the properties of vehicle’s movement can be various kinds of energy indicators, e.g. energy supplied to the system (as the integral of instantaneous energy waveform) or the sum of values of effective distances of vehicle points from required reference positions. The second phase of the study was done with the assumption that the changes of spring and damping values are independent.
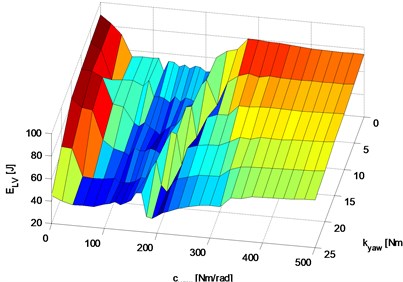
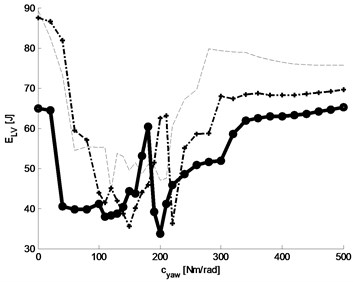
Fig. 17Energy losses of tyres: a) graph of tyre energy loss function, b) graphs of three selected baselines (with constant damping parameter kYAW= 0, 10, 20 Nm rad-1 s) of the function of tyre energy loss
a)
b)
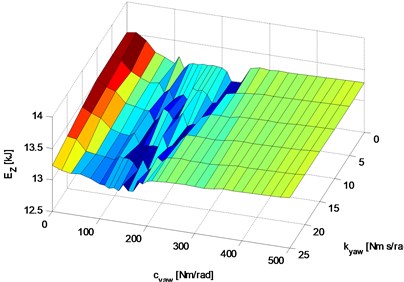
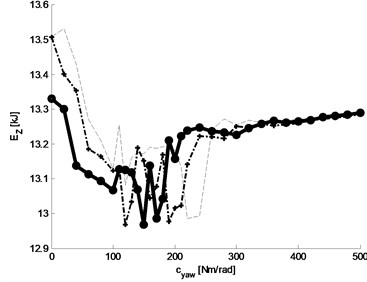
Fig. 18Total power consumption: a) graph of total power consumption, b) graph of three selected baselines (with constant damping parameter kYAW= 0, 10, 20 Nm rad-1 s) of the function of total energy loss
a)
b)
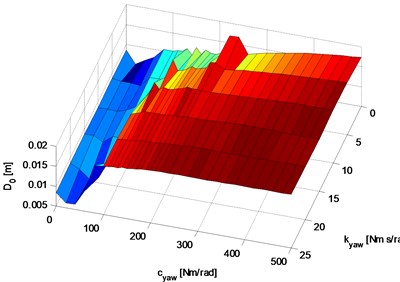
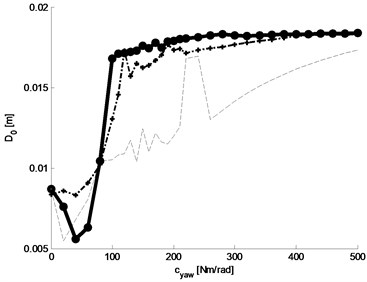
Fig. 19Effective value of the alternating component of the deviation of the centre of vehicle from reference position: a) graph of the function, b) graphs of selected three baselines (with constant damping parameter kYAW= 0, 10, 20 Nm rad-1 s)
a)
b)
Fig. 17 shows the results of the study of simulation sensitivity of the function of tyre energy loss (where power is described by Eq. (20), wherein the simulation graph of energy losses in wheels with constant parameters cYAW=150 Nm rad-1 and kYAW=7,5 Nm rad-1 s, is shown earlier in Fig. 15 – line W) to the changes of suspension parameters: spring and damping. Fig. 17(a) shows the graph of tyre energy loss function and Fig. 17(b) – graphs of three selected baselines (with constant damping parameter kYAW=0, 10, 20 Nm rad-1 s).
Analysing the graphs shown in Fig. 17 we can see that the lowest energy loss values are related to value ranges: for spring cYAW (40-170) Nm/rad, for damping: kYAW=20-25 Nm s/rad.
Fig. 18 shows the results of study of simulation sensitivity of total energy consumption function (the waveform for instantaneous power of total energy consumption set for constant parameters cYAW=150 Nm rad-1 and kYAW=7,5 Nm rad-1 s, shown earlier in Fig. 16). Fig. 18(a) shows the graph of total tyre wear function and Fig. 18(b) graphs of three selected baselines (with constant damping parameter kYAW=0, 10, 20 Nm rad-1 s). Analysing the graphs shown in Fig. 18 we can see that the lowest value of total energy loss are related to value ranges: for spring cYAW (40-150) Nm/rad, for damping: kYAW=20 Nm s/rad.
Fig. 19 shows the results of study of simulation sensitivity of the function of effective value of waveform of alternating component of deviation of vehicle centre from reference position (graph of simulation waveform of deviation of the vehicle centre from reference position set for constant parameters cYAW=150 Nm rad-1 and kYAW=7,5 Nm rad-1 s is shown on the red graph in Fig. 8). Fig. 19(a) shows the function graph and Fig. 19(b) – graphs of three selected baselines (with constant damping parameter kYAW=0, 10, 20 Nm rad-1 s). Analysing the function graphs shown in Fig. 19 it was assumed that the lowest effective values of distance waveforms concern the value ranges: for spring cYAW (20-80) Nm/rad, for damping: kYAW=20 Nm s/rad.
Comparing the three ranges of variation of required values of YAW torsional spring and YAW torsional damping (for three criterial conditions: tyre energy loss, total energy supply and the effective value of alternating component of deviation of the vehicle centre from the reference position) we can see that they have a common part around the value: cYAW=80 Nm rad-1 and kYAW=20 Nm rad-1 s. With these values the vehicle should have the minimum YAW-type rotary vibrations of the front and back wheel sets. These values were assumed as constant parameters for later studies aimed at the determination of the best values for torsional spring and damping of roll arms.
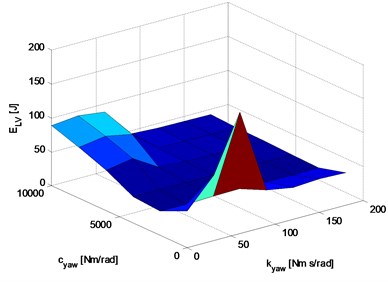
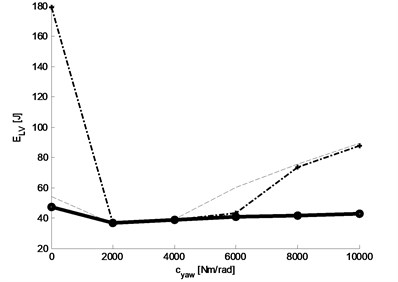
Fig. 20 shows the results of study of simulation sensitivity of the function of tyre energy loss to the changes of values of the spring and damping parameters for rotational connection of roll arms. Fig. 20(a) shows the graph of the function of tyre energy loss and Fig. 20(b) – graphs of three selected baselines.
Fig. 20Tyre energy loss in function of spring and damping of roll arm rotational connection: a) graph of tyre energy loss function, b) graph of three selected baselines
a)
b)
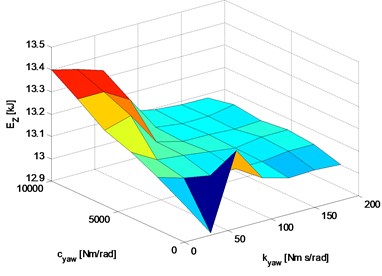
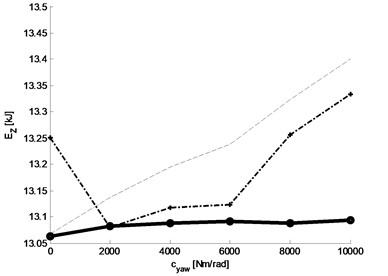
Fig. 21 shows the results of study of simulation sensitivity of the function of total energy consumption to the changes of values of spring and damping parameters for rotational connection of roll arms. Fig. 21(a) shows the graph of the function of tyre energy loss and Fig. 21(b) – graphs of three selected baselines.
Fig. 21Total power energy in the function of spring and damping of the roll arm rotational connection: a) graph of the tyre energy loss function, b) graph of three selected baselines
a)
b)
Analysing the presented graphs of characteristics of simulated motion waveforms we can see that the impact of these vibrations decreases with the stiffness and damping of rotational connection. It can be concluded that (from the point of view of the analysed yaw-type rotational vibrations of torsional wheel sets for the conditions of going from curve to a straight line) the rotational connection of roll arms to the body can be replaced with a rigid connection.
The presented results of study of sensitivity of the phenomenon of Yaw-type rotational vibrations of wheel sets can be summarized as follows:
The tests were performed on a model in inertial reference system.
The simulations of motion waveforms were performed for the conditions of going from curve to straight line and maintaining a constant value of kinetic energy.
The analysis of vibrations phenomenon was made by changing the parameters of spring and damping for body suspension and for rotational connection of arm rolls.
As criterial functions of the vibration effect we studied waveform characteristics such as: tyre energy loss, increase of total energy supply, effective value of alternating component of deviation of vehicle centre from reference position.
The best characteristics are obtained for suspension parameters cYAW= 80 Nm rad-1 and kYAW= 20 Nm rad-1 s. Rigid connection of arm rolls to wheel set brackets.
It should be noted that the results relate to the conditions of going from curve to a straight line. The scope of research should be systematically extended to other motion conditions – e.g. passing through a switch or passing a station.
9. Conclusions
The article presents the results of simulation studies for PRT vehicle moving on lane change track. The model is not validated due to lack of test track for PRT driving. However, the results of full model simulation correspond with the results of studies with a validated scaled model. It is therefore possible to draw some general conclusions regarding the dynamics of the vehicle. The problems resulting from lack of a centring mechanism are confirmed – after turning the vehicle moves glued to one of the edges of the track. At the same time, as with rail vehicles, we have observed opposite trends in choosing the best parameters of elastic torsion of axle of wheel sets for two basic track lines: straight line and a curve. It is therefore proposed that the parameters should be selected in compromise, based on energetic indicators characterizing the passage across the line of the track.
References
-
San Jose Automated Transit Network (ATN). http://www.sanjoseca.gov/index.aspx?NID=3706.
-
Pemberton M. The track to Suncheon: making APMs intelligent. Automated People Movers and Transit Systems, 2013, p. 263-275.
-
MacDonald R. The future of high capacity PRT. Proceedings of the Thirteenth International Conference on Automated People Movers and Transit Systems, American Society of Civil Engineers, 2011.
-
Gustafsson J., Kang J., Englund J., Grimtell P. Design considerations for capacity in PRT networks. Proceedings of the Thirteenth International Conference on Automated People Movers and Transit Systems, 2011, p. 385-394.
-
Swenson R. Solar skyways: mobility in a world beyond oil. Podcar City Conference, Stockholm, 2011, p. 250-262.
-
Furman B., Fabian L., Ellis S., Muller P., Swenson R. Automated Transit Networks (ATN): a Review of the State of the Industry and Prospects for the Future. Mineta Transportation Institute, San José, 2014.
-
Personal Rapid Transit. http://en.wikipedia.org/wiki/Personal_rapid_transit.
-
Anderson J. E. A review of the state of the art of personal rapid transit. Journal of Advanced Transportation, Vol. 34, Issue 1, 2000, p. 3-29.
-
Ultra Global PRT: Home. http://www.ultraglobalprt.com/.
-
Korea’s First Personal Rapid Transit (PRT). http://globalblog.posco.com/koreas-first-personal-rapid-transit-prt-skycube/#sthash.49GwzqOw.dpuf.
-
Masdar Development. http://www.fosterandpartners.com/projects/masdar-development/.
-
City of San Jose. Automated Transit Network Feasibility Study. http://www.sanjoseca.gov/ DocumentCenter/View/14332.
-
Sparowitz L., Freytag B., Viet T. N. Quickway – smart traffic for smart cities. 38th Conference on Our World in Concrete & Structures. Singapore, 2013, p. 1-12.
-
Eco-Mobility. http://www.eco-mobilnosc.pw.edu.pl/.
-
Choromański W., Kamiński G., Kamiński B., Kowara J. System personal rapid transit – research. Technology and Development Forecast for the XXI Century. Polsko-Chińskiego Conference on Eco-Mobility – Innovative Technologies, Motor Transport Institute, Warszawa, 2012.
-
Choromański W., Kowara J. PRT – modeling and dynamics simulation of track and vehicle. Proceedings of the 13th International Conference on Automated People Movers and Automated Transit System, 2013, p. 294-306.
-
Choromański W., Daszczuk W., Grabski W., Dyduch J., Maciejewski M., Brach P. Computer network simulation and analysis of flow capacity. Proceedings of the 14th International Conference on Automated People Movers and Automated Transit Systems, 2013, p. 296-312.
-
Choromański W., Grabarek I., Kowara J., Kamiński B. Personal rapid transit – computer simulation results and general design principles. Proceedings of the 14th International Conference on Automated People Movers and Automated Transit Systems, 2013, p. 276-295.
-
Choromański W., Kowara J. Modelling and simulation of PRT vehicle with polyurethane wheels. Proceedings of IAVSD 2011 – 22nd International Symposium on Dynamics of Vehicles on Roads and Tracks, Vol. 1, 2011, p. 1-6.
-
Choromański W., Kowara J. Personal rapid transit vehicle with polyurethanse wheels – modelling and simulation issues. Archives of Transport, Vols. 27-28, Issues 3-4, 2013, p. 71-79.
-
Kamiński B., Nikoniuk M., Drązikowski Ł. A concept of propulsion and power supply systems for PRT vehicles. Archives of Transport, Vols. 27-28, Issues 3-4, 2013, p. 81-94.
-
Kozłowski M., Choromański W. PRT simulation research. Archives of Transport, Vols. 27-28, Issues 3-4, 2013, p. 95-102.
-
Choromański W., Kozłowski M., Kowara J. Analysis of Dynamic Properties of the PRT Vehicle-Track System. Bulletin of the Polish Academy of Sciences, Technical Sciences.
-
Blundell M., Harty D. The Multibody Systems Approach to Vehicle Dynamics. Elsevier Butterworth-Heinemann, 2004.
-
Tyremodels MF-TYRE & MF-SWIFT. 6.1 User Manual. TNO Automotive the Netherlands, 2008, http://www.delft-tyre.nl/.
-
Kozłowski M., Choromański W. Dynamics simulation studies on the electric city car with an electromechanical differential and the rear wheels drive. Bulletin of the Polish Academy of Sciences, Technical Sciences, Vol. 61, Issue 3, 2013, p. 661-673.
-
Choromański W., Grabarek I., Kozłowski M., Ufnalski B., Barwicki M. A new concept of ECO-car with electric drive. 13th The World Conference on Transport Research (WCTR), Rio de Janeiro, Brazil, 2013.
About this article
This article was financed from ECO-Mobility project WND-POIG.01.03.01-14-154/09. Project co-financed from European Regional Development Fund within the framework of Operational Programme Innovative Economy.
