Abstract
The paper researches sound absorption characteristics of a periodically porous structure by combing transfer matrix method and a standing wave tube experiment. It is shown in results that the sound absorption effect of the periodical structure is better than that of a single-layer porous structure with the same thickness in the range of the low-frequency band. In addition, for the periodical structure with the same thickness, the sound absorption effect will not continuously increase along with the period number increase, and there is an optimal period number. In order to verify the actual sound absorption effect of the periodically porous structure, the paper tries to apply the structure in an automobile. Modal experiment is conducted to the automobile body, and the experimental results are compared with the simulated results. The relative errors are controlled within 5 % which is the critical value in engineering, and it indicates that the finite element model is reliable and can be used in the subsequent acoustic calculation. It is found in panel contribution analysis that noise in automobile is seriously influenced by the roof. Therefore, the periodically porous structure and a single-layer porous structure with the same thickness are applied to the roof panel. It is shown that the periodically porous structure has a more prominent sound absorption effect when it is compared with that of the other structures. This research also lays a foundation for broadening this application in the other structures.
1. Introduction
The porous materials are widely used to absorb sound. There are a lot of researches for sound absorption characteristics of the porous material. An approximate method which is used to calculate surface impedance of the porous material is proposed based on an empirical formula model [1, 2] and equivalent fluid model [3-6]. Because of the wide absorption frequency, the periodical porous structure is widely applied in noise control. The sound field problem of the multi-layer structure is simplified into a single-layer sound field problem by means of Transfer Matrix Method (TMM). Sagartzazu [7] researches surface impedance of double-layer porous material by TMM.
Sound absorption characteristics of the periodical porous structure are greatly influenced by its arrangement and size. The paper researches sound absorption characteristics of the periodical porous structure which is made of two porous materials. Its sound absorption effect is obviously better than that of a single material with the same thickness. Then, the paper discusses the period number of the porous material.
At present, the sound absorption material in an automobile is always constituted of a single-layer porous material, but its sound absorption effect is not ideal. As a result, the paper tries to apply this periodically porous structure into an automobile in order to verify its actual effect.
2. Background theories
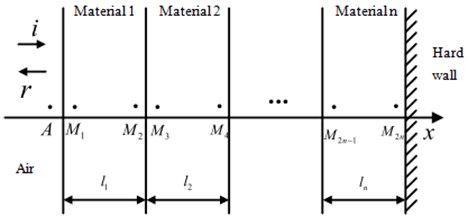
A multi-layer structure which is made of n-layer porous material is shown in Fig. 1. Point A on the structure surface is close to air. Points M2i-1 and M2i stand for points on both top and bottom surfaces of the ith layer, where in i=1,2,...,n. In a porous material layer, the sound field can be indicated by particle speed and stress. For example, front and rear faces of the first layer porous material are expressed by state vectors as follows:
where ˙us and σs(˙uf and σf) stand for particle speed and stress, respectively. The potential energies of frame and fluid for the porous material are indicated as follows, respectively:
Fig. 1Structure of n-layer porous material
Particle speed and stress can be expressed into the following type:
In the mentioned formulas, P, Q and R are elastic coefficients of the porous material and can be estimated by test [8]. According to Eq. (1) to Eq. (8), transfer matrix T which connects the state vectors V(M1) and V(M2) can be obtained:
Characteristics of the porous material are shown by transfer matrix which is unrelated to coordinate system. Discontinuity of state vectors is caused by inconsistent porosities of adjacent porous material layers. At this moment, a coupled matrix is needed to connect the two porous material layers. The continuous boundary conditions of the adjacent interfaces are as follows:
where ϕi indicates porosity of the ith layer. The coupled matrix is thus obtained as follows:
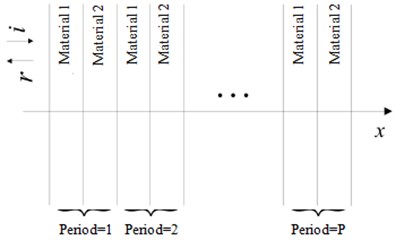
A periodical structure which is made of two porous materials is shown in Fig. 2. It is assumed that the periodical number is P. The overall transfer matrix can be expressed as follows:
Fig. 2Periodical structure which is made of two porous materials
It is considered that the last layer is leaned against hard wall face. Next, the particle speed is 0, and the state vector of rear end face for the porous structure can be expressed as follows:
According to the continuous boundary conditions of particle speed and stress at the front end face of the porous structure, the following formulas can be obtained:
where νA, pA and ZA indicate sound speed, sound pressure and sound impedance of point A, respectively. According to Eqs. (15) and (16), Eq. (17) to Eq. (19) can be expressed as follows:
The coefficient matrix in the mentioned formula is as follows:
where Tgij indicates the element of row i and line j in the overall matrix Tg. A nonzero solution exists only when the value of matrix M is 0:
Next, the surface impedance ZA of the multi-layer structure can be obtained.
In general, acoustic characteristics of a material are expressed by reflection coefficient and sound absorption coefficient. Both the coefficients can be directly calculated by the surface sound impedance. The reflection coefficient Rs and the absorption coefficient αs can be expressed into the following formula when plane waves are incident on a material layer:
where Zc is the characteristics impedance. Zs is the surface impedance of this material layer in normal direction. According to Eq. (22) to Eq. (24), the sound absorption coefficients of the multi-layer periodical structure can be calculated.
3. Calculation and analysis of sound absorption coefficient for the periodically porous structure
3.1. Calculation model
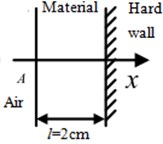
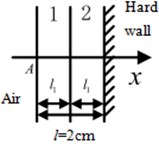
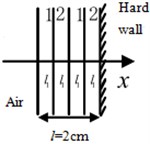
The porous materials calculated in this paper are high flow resistance materials [7]. Vibration of high flow resistance materials is obvious, which has a great effect on surface impedance. The overall sound absorption effect can be promoted by resonance effect of this kind of materials. Two porous materials are selected to stand for high flow resistance materials in this paper. Material 1 is called as Acousticell [7] which is a kind of expansive polyurethane foam. Material 2 is a kind of glass wool [3]. Diagrams of single-layer porous material and periodical porous material are shown in Fig. 3.
Fig. 3Diagrams of several structures
a)
b)
c)
The normalized surface impedance Zs/Z0 of the single-layer porous material in Fig. 3(a) can be calculated through transfer matrix method. All that is needed is to set the layer number of Eq. (15) to be 1. Z0=ρ0c0 indicates characteristics impedance of air. Principles and experience of multi-layer structure design are as follows. The material with small flow resistance is set on outer layer to make sound wave entry it. The material with high flow resistance is set on inner layer to increase loss of sound wave. Double-layer structure is shown in Fig. 3(b), Material 1 with small flow resistance is placed on outer layer, and material 2 is placed on inner layer. A multi-layer structure with period number of 2 is shown in Fig. 3(c).
3.2. Experimental equipment
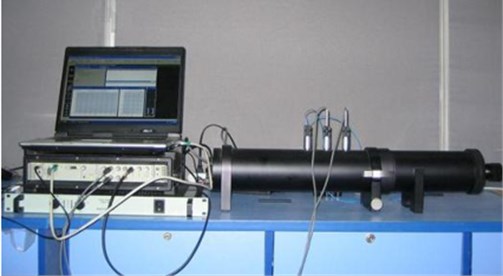
In this paper, the impedance tube method was used to test sound absorption coefficient of multi-layer porous materials. 3560C PULSE system of B&K Company is taken as the experimental equipment. Two microphones are used in impedance tube to measure incidence and reflection sound pressures. Next, sound pressures are substituted into the mentioned formulas to obtain sound absorption coefficient and reflection coefficient of the test piece. Microphones and amplifiers are specially designed and they can satisfy the requirement of phase matching. In addition, the last two channels of input module for 3560C data collection system were used to collect data. The test platform is shown in Fig. 4.
Fig. 4Experiment of sound absorption coefficient for the periodically porous structure
3.3. Experimental results and analysis
The mentioned equipment is used to test sound absorption coefficients of single-layer porous structure and periodically porous structure with the same thickness, respectively. Comparison results are shown in Fig. 5.
Fig. 5Comparison of sound absorption coefficients for single-layer porous structure and periodically porous structure
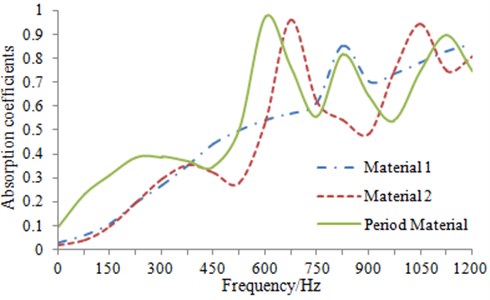
In Fig. 5, the period number of the period porous structure is 1. As shown in Fig. 3(b), the total thickness is 2 cm. Thickness of material 1 and material 2 is 1cm. According to Fig. 3(b), the multi-layer structure with thickness of 2 cm can be deemed as a structure which is made of two kinds of porous materials with thickness of 1 cm. It is shown in Fig. 5 that sound absorption effect of the periodical structure is better than that of a single layer with the same thickness, which is mainly reflected in low frequency bands. Advantages of sound absorption in low frequency bands are enlarged, and it is because that the resonance peak moves forward.
In order to deeply learn about sound absorption characteristics of the periodically porous structure, sound absorption coefficients of structures with different period numbers and the same thickness are tested, as shown in Fig. 6.
Fig. 6Comparison of sound absorption coefficients for the periodically porous structures with different period number
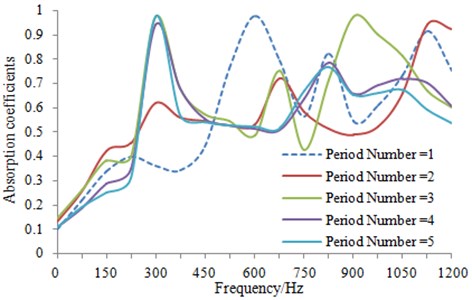
As shown in Fig. 6, under the same thickness, the overall sound absorption effect is not obviously improved with the period number increase. Change is mainly shown in that the resonance peak moves forward. When the period number change from p= 1 to p= 2, the resonance peak moves forwards obviously, and the sound absorption effect in low frequency bands is greatly improved. When the period number continuously increases, the resonance peak is nearly unchanged, and the advantage of sound absorption effect in low frequency bands gradually disappears. Therefore, a rational period number shall be selected when the periodically porous structure is used. The bigger period number is not always better.
In order to verify the actual effect of the periodically porous structure, it is applied in an automobile to reduce noise. Before applying this structure for an automobile, the position shall be determined. The detailed analysis is conducted as follows.
4. Determination of position for the periodically porous structure
4.1. Verification of the finite element model
Automobile body is a complicated structure component. Before analysis, an experimental modal shall be conducted to verify the reliability of the finite element model. Next, the subsequent relevant researches can be started.
During testing the experimental modal, the automobile body is hung by a rubber rope with large elasticity, so that its free state can be simulated. The hanging points are selected according to the principle that influences brought by the hanging system should be minimized. Therefore, joints between the suspension and the automobile body are taken as the hanging points, as shown in Fig. 7.
Fig. 7Diagram of testing the experimental modal
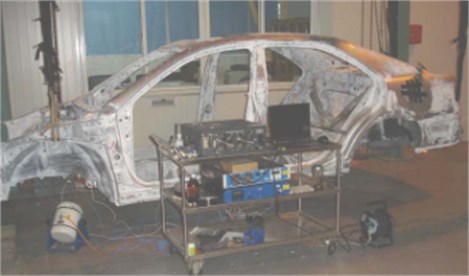
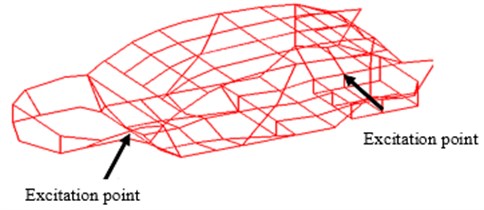
Positions of excitation points should be selected according to the following principles. 1) Excitation is not applied to hanging points or mode nodes, so that reliability of testing results can be ensured. 2) Excitation is applied to positions with large rigidity. In this test, excitation points are located around the left front suspension, and the excitation direction is vertically. Outline of the automobile should be reflected as much as possible by the arranged test points. More test points can be arranged in the key areas. Excitation positions and test points are shown in Fig. 8.
Fig. 8Arrangement diagram of excitation points and test points
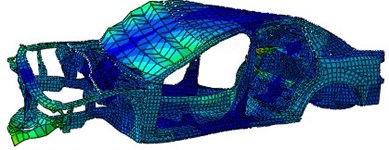
After that the mentioned conditions are completed, a frequency-response function of the structure was measured to obtain the modal of the top 6 orders. Next, the experimental modal is compared with that of the finite element model in Fig. 9, as shown in Table 1. According to Table 1, the relative errors between test values and simulation values are controlled within 5. It indicates that the finite element model is reliable and can be used in the subsequent analysis. Modes of the automobile body at the top 6 orders are shown in Fig. 10.
Fig. 9Finite element model of the automobile body
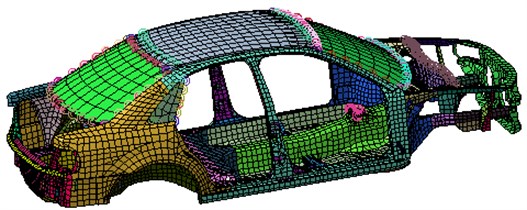
Table 1Modal comparison between experiment and simulation for the top 6 orders
Order | Experiment value / Hz | Simulation value / Hz | Relative error / % |
1 | 28.93 | 29.41 | 1.66 |
2 | 36.09 | 37.30 | 3.35 |
3 | 47.53 | 49.45 | 4.01 |
4 | 54.91 | 56.34 | 2.6 |
5 | 62.14 | 63.58 | 2.32 |
6 | 66.34 | 68.42 | 3.14 |
4.2. The panel contribution analysis of the interior sound field
The driver’s position is the nearest position from the engine, and the ride comfort of the driver can affect the security of all the people in the passenger room directly. It is necessary to analyze the response of field point sound pressure in the driver’s ear in order to do further optimization studies.
Thickness of the automobile body panels is relatively small, and it will exist a certain coupling effect with the relatively larger interior. This factor needs to be considered when the numerical calculation is conducted.
In addition, the seats in automobile are wrapped with a thick sound absorption material on the frame, which also has a large impact on the interior sound field. As a result, this factor also needs to be taken into consideration when the model is built. The interior sound field model in automobile is shown in Fig. 11.
Fig. 10Modes of the automobile body at the top 6 orders
a) 29.41 Hz
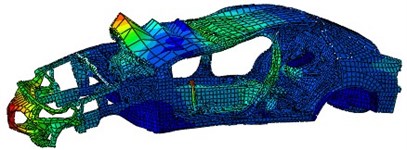
b) 37.30 Hz

c) 49.45 Hz
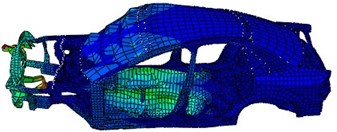
d) 56.34 Hz
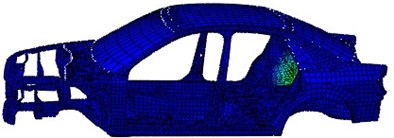
e) 63.58 Hz
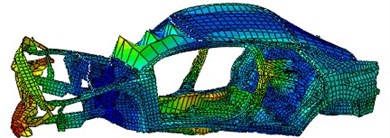
f) 68.42 Hz
Fig. 11Model of the interior sound field
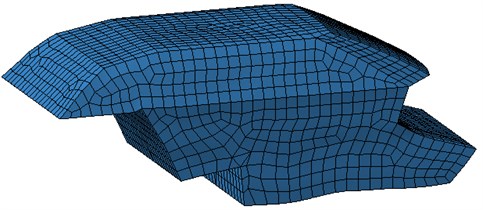
In Virtual.lab software, the finite element mesh in Fig. 9 is coupled with the boundary element mesh in Fig. 11, as shown in Fig. 12. During computation, the finite element mesh is mapped to the boundary element mesh by setting some parameters of the software. As a result, the boundary element mesh can obtain the characteristics of the finite element mesh. Then, sine excitation is applied in the suspension point of engines, as shown in Fig. 13. The excitation force which is obtained by experiment is not applied in the suspension, because there are some simplifications in the finite element mesh, such as wheels, suspensions and doors being ignored. In this paper, only body in white is taken as the research objective. In the published papers, the numerical computation of the sound field in the automobile is also conducted like that. As a result, applying excitation force obtained by experiment is not very significant.
By analyzing panel contribution of the interior sound field in automobile, the panel of which the vibration causes sound pressure around the driver’s ear can be accurately positioned. Furthermore, the position at which the periodically porous structure is applied can be determined. Sound cavity which is used to simulate the driver’s cab is divided into 19 panels as shown in Fig. 14. And every panel has been described as Table 2.
Fig. 12Coupling model of sound field in the automobile
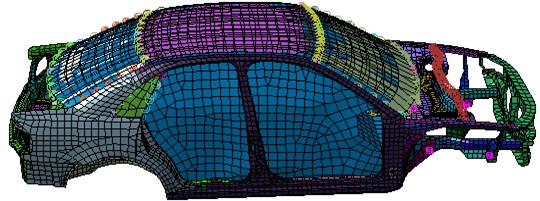
Fig. 13Position of excitation force
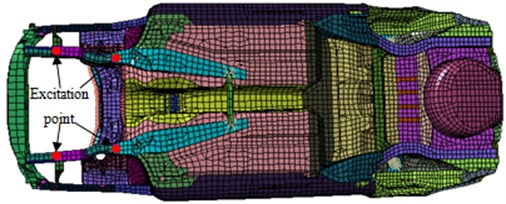
Fig. 14The division diagram of sound cavity in automobile
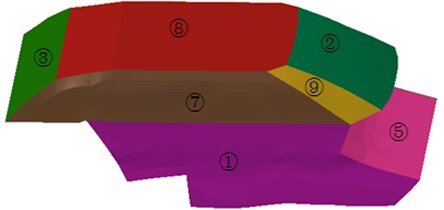
Table 2Positions of each panel number
Panel | Panel name | Panel | Panel name |
1 | Lower part of right side wall | 10 | Junction plate between luggage carrier top and back wall |
2 | Front windshield panel | 11 | Lower part of left side wall |
3 | Back windshield panel | 12 | Middle part of back wall |
4 | Upper part of front wall | 13 | Junction plate between front wall and windshield |
5 | Middle part of front wall | 14 | Luggage carrier top |
6 | Lower part of front wall | 15 | Upper part of left side wall |
7 | Upper part of right side wall | 16 | Upper part of back wall |
8 | Roof | 17 | Junction plate between upper part of left side wall and front windshield |
9 | Junction plate between upper part of right side wall and front windshield | 18 | Lower part of back wall |
19 | Passenger compartment floor | ||
Panels refer to a set of elements in an acoustic boundary element model. Sound pressure contribution of panel P at one point of the sound field refers to the sum of contribution of all elements contained in the panel as follows [9-11]:
where Pc is contribution of panel P. Np refers to the total number of elements of panel P. Pe,i(ω) refers to sound pressure contribution of element i:
Therefore, in order to analyze panel contribution, definitions of ATVi(ω), νe,i(ω) (element vibration speed of the acoustic boundary element model) and panel shall be understood. On a physical level, ATV can be deemed as a sound pressure value caused by an element or a node, and can be calculated directly by simulation. Element vibration speed of the acoustic boundary element model can be directly obtained in calculation.
The contribution coefficient (rc)A of panel vibration is defined as the contribution of panel at point A (represented by Pc) divided by the total sound pressure at point A. Point A is deemed as the position of the left ear of drivers. The panel which makes the most contribution to sound pressure at this point can then be determined. It must be clear that a positive contribution coefficient indicates that the total sound pressure is positively correlated to vibration speed of the panel, while a negative contribution coefficient indicates that the total sound pressure is negatively correlated to vibration speed of the panel. As a result, this aspect shall be taken into full account during optimization. Contribution coefficients of each panel are finally obtained, as shown in Fig. 15. Contour of sound pressure less than 130 Hz is further extracted, as shown in Fig. 16.
Fig. 15Diagram of panel contribution coefficients
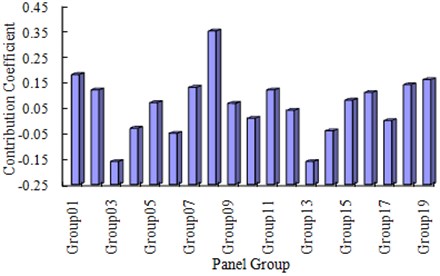
Fig. 16Contour of sound pressure level less than 130 Hz
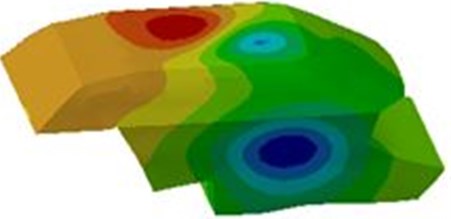
According to Fig. 15, the greatest contribution is made by panel 8 to the driver’s ear. Results obtained in Fig. 15 are further verified in Fig. 16. Panel 8 is the automobile roof. Radiation noise of panels is positively correlated to the normal vibration speeds and radiation areas. According to positions of 19 panels of the automobile body, panel 8 is located above the driver, and has a big radiation area so that it has a big contribution coefficient.
5. Numerical optimization of sound field in automobile
According to the mentioned analysis, sound absorption material shall be applied to the roof in automobile in order to effectively reduce noise. In order to verify the actual sound absorption effect of the periodically porous structure proposed in this paper, material 1, material 2 and the period structure with the same thickness as shown in Fig. 5 are applied to the roof, respectively. Test results of sound pressure levels are compared between three kinds of structures as shown in Fig. 17.
Fig. 17Comparison of sound absorption effects between three kinds of structures
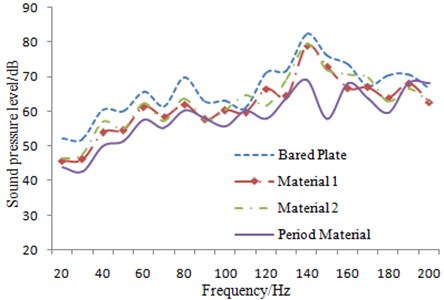
Usually the sound field is obtained in octave (or 1/3 octave frequency bands). However, in this paper, only the frequency within 200 Hz is researched, because the period material is only effective for improving sound field in the low frequency. However, the final results are presented in frequency spectrum, and we can observe the peak sound pressure obviously. As a result, whether the peak sound pressure is caused by resonance between the structure and the interior sound field can be obtained. In addition, the modal within 200 Hz is very little. As we all know, the peak sound pressure is often caused by resonance. As a result, sound pressure level is a smooth curve. If the researched frequency is middle and high frequency bands, the result will be a fluctuation curve, and there are a lot of peaks. In the high frequency, there are a lot of modals which can cause resonance between the automobile structure and the interior sound field. According to Fig. 17, after applying the periodically porous structure, sound field in automobile is obviously improved within low frequency bands when it is compared with the single-layer structure with the same thickness. In addition, according to Fig. 5 and Fig. 6, resonance frequencies of sound absorption structures are all higher than 200 Hz. Therefore, within this analytical frequency band, no resonance will take place between the roof and the sound absorption structure. As a result, sound field in automobile will not be worsened.
It is further shown by applying the periodically porous structure in an automobile that it has a better sound absorption. This result also lays a certain foundation for the application in the other engineering components.
6. Conclusions
1) Sound absorption effect of a periodically porous structure is better than that of a single-layer porous structure with the same thickness.
2) As for a periodically porous structure with the same thickness, the sound absorption effect will not continuously increase with the period number increase. There is an optimal period number.
3) According to modal comparisons between experiment and simulation, the relative errors are controlled within 5 %. It indicates that the finite element model is reliable and can be used in the subsequent analysis.
4) It is found in panel contribution analysis that noise in automobile is most influenced by the roof. Therefore, the periodically porous structure and the single-layer porous structure with the same thickness are applied to the roof, respectively. It is shown in results that the periodically porous structure shows more prominent sound absorption effect than that of other sound absorption structures. Such result also lays a foundation for generalizing this structure into other engineering components.
References
-
Delany M. E., Bazley E. N. Acoustic properties of fibrous absorbent materials. Applied Acoustic, Vol. 3, 1970, p. 105-116.
-
Beranek L. L., Ver I. L. Noise and Vibration Control Engineering: Principles and Applications. New York, Chapter 8, 1992, p. 215-278.
-
Allard J. F., Atalla N. Propagation of Sound in Porous Media: Modelling Sound Absorbing Materials. Chichester, Chapter 2, 2009, p. 22-23.
-
Allard J. F., Champoux Y. New empirical equations for sound propagation in rigid frame fibrous materials. Journal of Acoustics Society America, Vol. 91, 1992, p. 3346-3353.
-
Johnson D. L., Koplik J., Dashen R. Theory of dynamic permeability and tortuosity in fluid-saturated porous media. Journal of Fluid Mechanism, Vol. 176, 1987, p. 379-402.
-
Lafarge D., lemarinier P., Allard J. F. Dynamic compressibility of air in porous structures at audible frequencies. Journal of Acoustics Society America, Vol. 102, 1997, p. 1995-2006.
-
Sagartzazu. X., hervella N. L. Impedance prediction for several porous layers on a moving plate; Application to a plate coupled to an air cavity. Journal of Computational Acoustics, Vol. 19, 2011, p. 379-394.
-
Biot M. A., Willis D. G. The elastic coefficients of the theory of consolidation. Journal of Application Mechanism, Vol. 24, 1957, p. 594-601.
-
Wang E. B., Zhou H., Xu G. Acoustic-vibration optimization based on panel acoustic contribution analysis of vehicle body. Journal of Jiangsu University (Natural Science Edition), Vol. 33. 2012, p. 345-351.
-
Liu X. D., Si Z. Y., Shan Y. C. Low-frequency in-car noise analysis and control based on acoustic transfer vector approach. Automotive Engineering, Vol. 31, 2009, p. 213-218.
-
Jin X. X., Bai S. Y., Ding Y. L. Computer simulation on acoustic contribution of vibrating body panels. Automotive Engineering, Vol. 22, 2000, p. 236-241.
About this article
Project is supported by National Natural Science Foundation of China (51305068), Doctoral Fund of Ministry of Education of China (20130185120034), and the Fundamental Research Funds for the Central Universities (ZYGX2012J104).
