Abstract
In case of an explosion happening inside the subway tunnel, blast waves interacts with the structure in an enclosed space. Both the overpressure and duration of blast increase. On the basis of experimental research, we establish a calculation model of blast effects in a tunnel. Its applicability has been verified by comparing the numerical results and the experimental findings. Then the blast effects in subway tunnel have been analyzed. It has been found out such factors as the tunnel shape, charge position, and distance to the explosion center all have a great influence on blast effects. The overpressure of blast in the subway tunnel is summarized and the formula is proposed. Compared to data of explosion tests at home and abroad, the formula has been proven to have some applicability. It may be provide some reference to the design of antiknock loads of subways and evaluation of casualties.
1. Introduction
Tunnel has been widely used in military and civil engineering. In this trend, in regard to military, with the development of accurate guidance technology, explosives have an increasing probability of exploding in underground tunnel. In civil scopes, with the rapid boom of large-scale underground structures like subways, subway tunnels face a growing probability of terrorist attacks and accidental explosions. When explosives happen inside a tunnel, the blast will reflect on the wall due to the limitation of the tunnel. The blast pressure will slow down and the duration time will increase. Further, the blast effects are different from in free atmosphere. It may be more damaged. Hence, the study of blast effects in tunnel has important significance [1-4].
In terms of researching t blast effects in tunnels, in essence, it is to study how to determine the blast wave parameters. When explosives go off in an enclosed space, blast waves will produce complicated interactions with the structures. In theory, it would be quite difficult to calculate parameters of blast. The current methods are estimates of empirical equations, which are based on many tests. However, due to limitations of experimental conditions, there are large gaps among the results calculated by different empirical equations.
With the development of computer, the FEM has been increasingly applied for numerical simulation of explosive blast waves. This paper establishes a numerical model of blast waves in tunnels. Comparing to explosion test data in underground tunnels, it verifies the applicability of the model. Then we propose a formula to calculate the peak overpressure ofblast waves in tunnels.
2. Verification of the calculation model
2.1. Introduction to the test
We employ an internal explosion test, which was carried out in a field circular shaped tunnel by cooperating organization. The underground tunnel is 3.5 m in diameter and around 200 m in length. A total of six explosives went off in the test, with amounts of 6 kg, 12 kg, 18 kg, 36 kg, 48 kg and 220 kg military TNT, respectively. The pressure sensor was utilized to measure the blast pressure inside the tunnel. The pressure history curves of blast at different measuring points were acquired. Due to confidentiality restrictions, only the experimental results (which the explosive amount was 36 kg) are used as the contrast test data in this paper. The tunnel cross-section is shown in Fig. 1. The arrangement of measuring points is shown in Fig. 2. The pressure sensors are arranged on the structure surface.
Fig. 1Tunnel cross-section (cm)
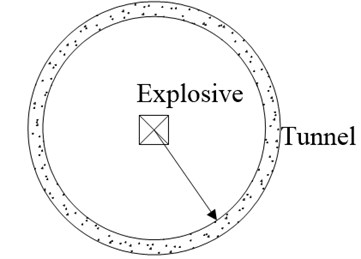
Fig. 2Arrangement of measuring points in tunnel (cm)

2.2. Finite element model
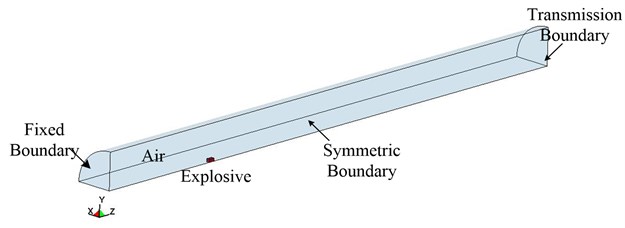
The numerical model of explosion in tunnels consists of two parts, explosive and air. The deformation of concrete structures has little effect on blast wave transmission, sotheconcrete structure is simplified to be rigid. That is, the air boundary is assumed as a fixed boundary condition. Some obstructions are set at the tunnel exit. Ignoring the impact of the deformation of obstructions on blast wave transmission, the tunnel exit boundary was fixed as a fixed boundary. The explosive went off at a distance 6 m to the tunnel exit. And the charge was TNT military square charge. The total length of the tunnel model is 26 m, at which the non-reflecting boundary is set. Taking into account the symmetry of the structure, in order to reduce the computing time, modeling is conducted according to 1/8 of the structure. The finite element model is shown in Fig. 3 and Fig. 4.
Fig. 3Finite element model of the tunnel section
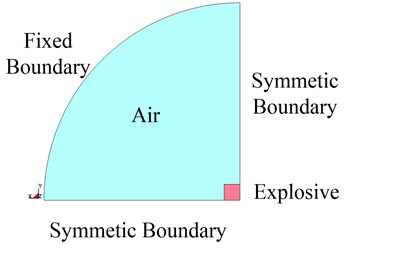
Fig. 4Finite element model of underground tunnel
2.3. Calculation software and constitutive model
This paper chooses the dynamic analysis program LS-DYNA [5] as the calculation software. LS-DYNA is an explicit nonlinear dynamic finite element program. It can simulate nonlinear dynamic impact problems of nonlinear structures such as high velocity impact, explosives and metal forming, while at the same time solving heat transfer, fluid and fluid-structure interaction. The selection of materials’ constitutive relation is a key issue of numerical computation. In this model, the explosive is described by using high explosive materials and JWL state equation. The air material is described by using the empty material and linear polynomial state equations; the detailed input data of material parameters in LS-DYNA are shown in Table 1.
Table 1Material parameters
Material | Dyna material type, material property and state equation input data (unit: m, kg, s) | ||||||||
Explosive | *MAT_HIGH_EXPLOSIVE_BURN | ||||||||
RO | D | PCJ | |||||||
1600 | 7000 | 2.55E10 | |||||||
*EOS_JWL | |||||||||
A | B | R1 | R2 | OMEG | E0 | VO | |||
5.40E11 | 9.37E9 | 4.50 | 1.10 | 0.25 | 8.0E9 | 1.00 | |||
Air | *MAT_NULL | ||||||||
RO | PC | MU | |||||||
1.29 | 0.00 | 0.00 | |||||||
*EOS_LINEAR_POLYNOMIAL | |||||||||
C0 | C1 | C2 | C3 | C4 | C5 | C6 | E0 | V0 | |
–1000 | 0.00 | 0.00 | 0.00 | 0.40 | 0.40 | 0.00 | 2500 | 1.00 | |
2.4. Comparison of calculation results and experimental findings
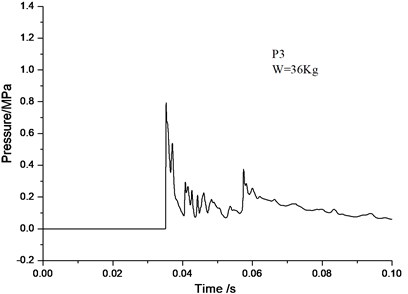
Figs. 5-10 demonstrates a comparison of the blast wave curve of measuring points by numerical calculation and the curve observed in experiments. As can be seen from the comparative results, test signal at the measuring point P1 is disturbed. A double peak occurs in the vicinity of 0.02 s. In the latter stage of the test signal, due to greater interference, the pressure does not return to zero, but a drift occurs. In contrast, the numerical calculation gives a more reasonable calculation result: only a single peak occurs at around 0.02 s, and with the increase in computation time, the pressure gradually returns to zero, which is more in line with the actual situation. Test signal at the measuring point P2 is less disturbed. The numerical simulation curve conforms to the experimental curve. Test signal at the measuring point P3 is also disturbed, and a large peak appears at about 0.045 s of the pressure curve. There is no reference to the peak value. The numerical simulation results are more realistic, and the wave form conforms better to the measured waveform.
It can be seen from the simulation results that the numerical models and calculation methods used in this paper can not only well predict the peak overpressure parameters of blast, but also give the corresponding spectrum characteristics. It also intuitively describes such complex physical phenomena as transmission and reflection of blast waves inside tunnels. The computational models and methods utilized in this paper can fully meet the research of the flow field distribution law of blast waves in subway structures.
Fig. 5Test curve of P1-point
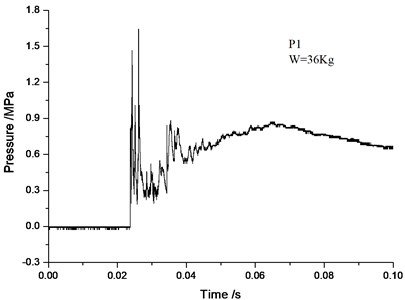
Fig. 6Numerical simulation curve of P1-point
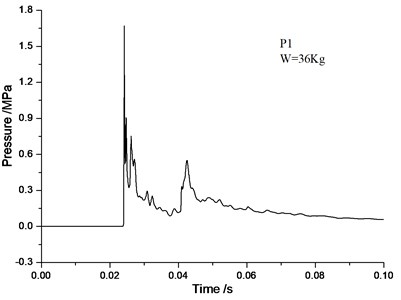
Fig. 7Test curve of P2-point
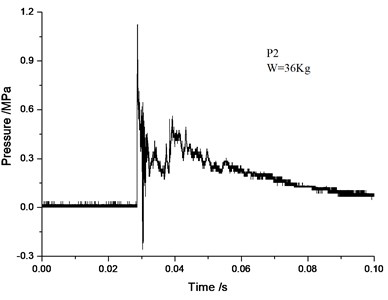
Fig. 8Numerical simulation curve of P2-point
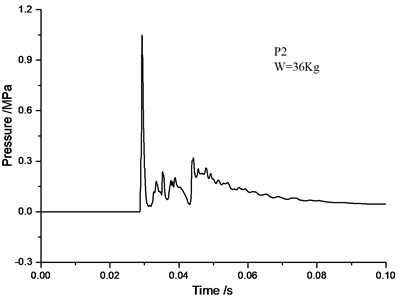
Fig. 9Test curve of P3-point
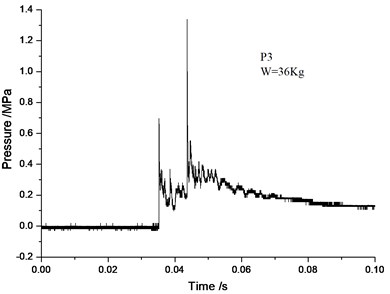
Fig. 10Numerical simulation curve of P3-point
3. Transmission law of explosive blast waves in subway tunnels
3.1. Finite element model of tunnels
The numerical models and methods valid are employed to investigate the flow field distribution of explosion in actual subway tunnels. The subway tunnel is a shield tunnel. The lining structure is adopted with circular cross-section, with an inner diameter of 5.4 m, an outer diameter of 6 m, and thickness of 0.3 m. The simplified graph of the structure is shown in Fig. 11 and Fig. 12.
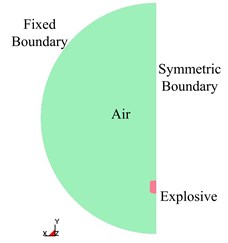
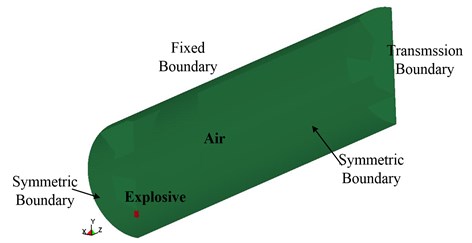
The model neglected the explosion energy absorbed by the deformation of tunnel, and only considered two media, namely explosive and the air. The boundary of the air and lining was rigid. The tunnel opening interface is simulated with non-reflected boundary. Based on the symmetry of the problem, 1/4 model is taken and symmetric boundary are employed on the symmetry plane. According to the subway structure design, typically the distance from the bottom to the track of the train is 1.1 m [6]. Assume that the distance between the explosion point and the lining bottom is 1.1 m. Also assume the explosive are group charged, with the charge amounts of 5 kg, 10 kg, 20 kg and 40 kg, respectively. After simplification, the structure finite element model and boundary conditions are shown in Fig. 13. Taking into account the sensitivity of the blast waves to mesh size, the mesh generation on the tunnel section is controlled to be less than 3 cm in size. The length of finite element tunnel calculation from the explosion point is 20 m, and the total number of elements is 5,137,020.
Fig. 11Simplified model of tunnel structures
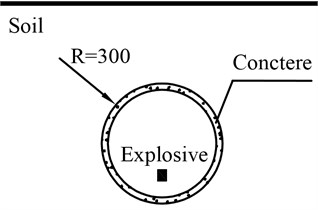
Fig. 12Location of explosives (cm)
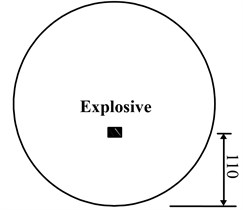
Fig. 13The finite element model of typical tunnels
3.2. Blast wave transmission description in tunnels
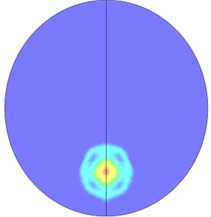
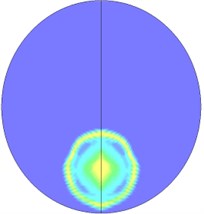
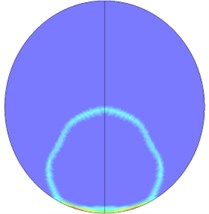
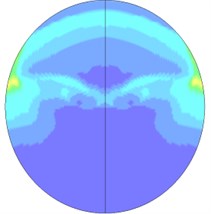
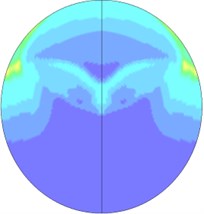
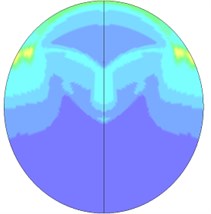
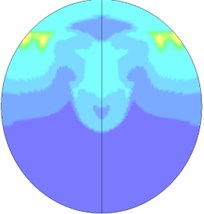
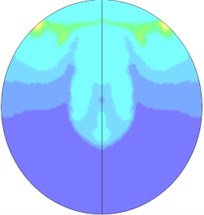
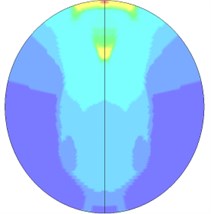
When explosive goes off in tunnels, the blast wave will have complex interactions with the tunnel structure, resulting in the reflected wave. The overlays of the reflected wave and the incident wave will also lead to the Mach reflection, so the flow field distribution of blast waves in tunnels is relatively complicated. Fig. 14 is the flow field distribution of the explosion center’s cross-section. It can be seen that when the explosive starts to go off, under the influence of the shape of the explosive, explosive blast waves extends outward in a cubic shape, and gradually forms a spherical wave shape. Since the explosive is the nearest to the bottom of the tunnel, the blast first reaches the bottom of the tunnel and then reflects. The reflected wave begins to catch up with the shock waves that are generated by the explosion and disseminated to the tunnel wall. Meanwhile, the incident wave and reflected wave also propagate along the tunnel’s radial direction. After the blast disseminated to the superior tunnel wall reflects due to collision, the reflected wave coming from the inferior tunnel wall superposes on it, and thus the new shock wave generated by superposition begins to disseminate to the inferior tunnel wall and again reflects after colliding the inferior tunnel wall. In this case, multiple reflected wave effects occur. The intensity of the reflected wave is gradually attenuated from the explosive center to both sides. As the distance increases, when the incident wave and the tunnel wall reach a certain angle, and the speed of the reflected wave is larger than that of the incident wave, the reflected wave will integrate with the incident wave and form the Mach shock wave and spread forward. Due to multiple reflection effects of the wall, blast waves slowly attenuate inside the tunnel, and the flow field near the powder charge is complex. A blast wave focusing phenomenon appears locally in the tunnel. Finally, with the increasing transmission distance, a stable plane wave is formed and spreads forward. Fig. 15 shows the cloud picture that the blast waves spread along the tunnel.
Fig. 14Nephogram of blast waves’ transmission at tunnel center section
a)t= 0.2 ms
b)t= 0.3 ms
c)t= 0.6 ms
d)t= 3.2 ms
e)t= 3.6 ms
f)t= 4.0 ms
g)t= 4.6 ms
h)t= 5.2 ms
i)t= 6.8 ms
3.3. Distribution characteristics of blast wave overpressure at tunnel structure
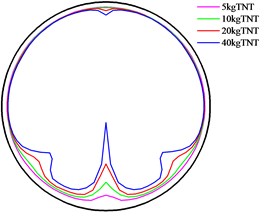
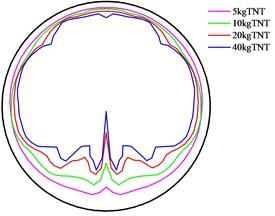
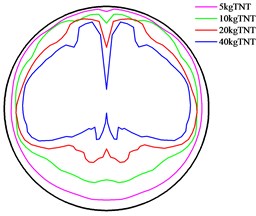
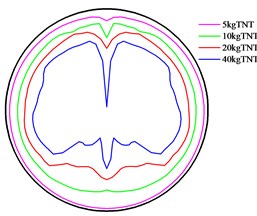
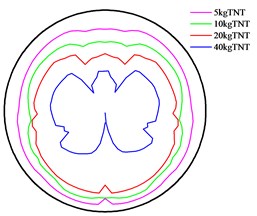
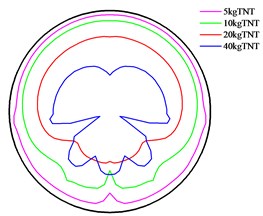
In general, the peak overpressure of the reflected wave is (some may be several times) greater than that of the incident wave. Influenced by the explosive charge shape, charge position and structure reflection, at the cross-section same to the explosion center distance, the maximum peak overpressure of blast waves occurs at the surface of the tunnel. Therefore, this paper explores the distribution features of waves on the tunnel lining surface, so as to provide reference for the load anti-explosion design of the tunnel structure. Fig. 16 shows the distribution in which the tunnel surface reflects the relative size of overpressure under different TNT amounts, and at different distances from the explosive. It can be seen that near the explosive, under the impacts of the tunnel shape, charge amount, charge shape and charge position, the maximum overpressure peak on the same cross-section of tunnel occurs at the bottom of the tunnel. As distances from the explosive increase, the reflected pressure influenced by the distance and the blast incident angle, the maximum overpressure peak does not appear at the bottom of the tunnel. With the increase at distance, the overpressure peaks of surface gradually become the same. Generally, it is considered that when distance reaches up to 6 times of the diameter of the tunnel, the blast wave will transmit in a stabilized plane wave.
Fig. 15Cloud picture of explosive blast waves’ transmission in the tunnel

a)t= 0.3 ms

b)t= 1.7 ms

c)t= 3.7 ms

d)t= 6.8 ms

e)t= 8.7 ms

f)t= 11.7 ms

g)t= 17.0 ms
Since the tunnel diameter in this paper is relatively large (6 m), computational grid is relatively small and there are many units, the tunnel diameter distance by six times is not calculated given the problem of computing power and computing time. Nevertheless, it can be found from the distribution of overpressure peaks that as the distance increases, the overpressure peak gradually approaches, which is in line with the average transmission law of blast waves. However, under larger doses, particularly at 40 kg, as the distance increases, the approach of the overpressure peak is not obvious, indicating that when the charge amount increases, the overpressure distribution on the surface is more uniform, while at the same time stable wave distance increases, thus generating a stable wave distance limit after the explosion in the tunnel. It should be related to the explosive charge amount, charge shape and charge position. More research should be carried out in this regard.
Fig. 16Peak of overpressure at different distances from the explosion center
a) Distance is 0.15 m
b) Distance is 1 m
c) Distance is 2 m
d) Distance is 4 m
e) Distance is 10 m
f) Distance is 18 m
Fig. 17Peak of overpressure attenuation at different distances from the explosive
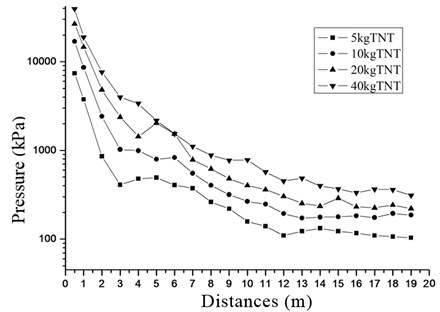
Fig. 17 presents the maximum attenuation of peak in section at different distances from the explosion center. It shows that as the distance increases, the peak overpressure is showing a decreasing trend. However, at a certain distance from the explosion center, some far peak overpressures may also be greater than the preceding overpressures. This is mainly because when the blast wave is at a distance from the explosive, the distance is not a major factor influencing the peak overpressure of blast waves. Other factors, including the incident angle and the tunnel shape, exert greater influences on the peak of overpressure of the blast wave.
3.4. Attenuation formulas of peak overpressure of tunnel
In order to study the attenuation rule of peak overpressure of blast waves along the tunnel, we must first determine the main influential factors that impact overpressure peak. Then to determine the constant parameters related to tunnel peak overpressure in accordance with the dimensional analysis theory. By changing the parameters, the functional relationship between tunnel peak overpressure and parameters are explored. As for explosions in tunnels, the principal factors affecting blast wave peak overpressure ΔP in tunnels are the energy of explosives Q, the intensity of pressure of ambient atmosphere P0 equivalent diameter D, the distance from the measured point to them explosion center L, and the effective volume of explosion measuring points in tunnels to the explosion center V=SL.
We select six parameters, encompassing the initial air pressure P0, the energy of explosives Q, the effective volume V=SL, distance to the explosion center L, and equivalent diameter D. The LMT unit system is employed and π theorem is used. Units for various parameters are: [Q]=L2MT-2,[P0]=L-1MT-2,[ρ0]=L-3M,[V]=L3,[L]=L,[D]=L. A matrix composed by parameter variables:
where the order is 3, and the number of basic solutions is 3. The basic solutions are y1=[-1,1,0,0,3,0]T, y2=[0,0,0,1,-3,0]T, y3=[0,0,0,0,-1,1]T. Three non-dimensional numbers are obtained: π1=P0L3/Q, π2=V/L3, π3=D/L. In order to eliminate the impact of the initial air pressure P0, make π'2=P0V/Q, π'3=P0L2D/Q. Therefore, ΔP/P0=f(V/Q,L2D/Q). When explosives go off in the air, take P0=1, and the above formula can be written as ΔP=f(LS/Q,L2D/Q). For the same kind of TNT explosive, explosive energy is proportional to the charge quality, namely explosive energy Q=mQv, where Qv is explosion heat, so Q in the function expression can be replaced by charge quality. Figs. 18-21 shows the relation curve between blast wave peak overpressure and the distance at different amounts of explosives.
Fig. 18Equivalent amount of 5 kg TNT
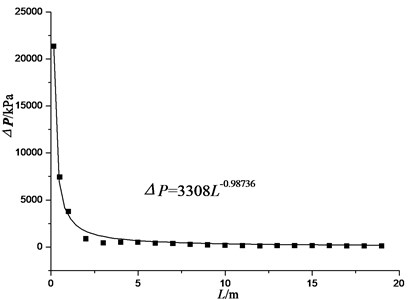
Fig. 19Equivalent amount of 10 kg TNT
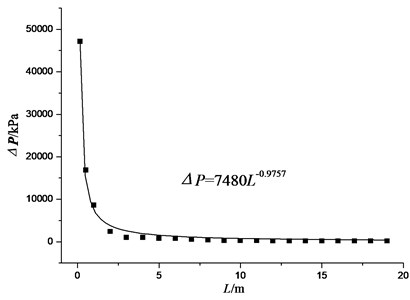
As can be seen from the figure, for different equivalent amounts of explosives, peak overpressure and the distance have an exponential relationship. Hence, in this paper, assumes that the overpressure loading of tunnel has an exponential relationship with two variables, which is to assume that:
where a, b and c are constants and determined by the numerical experiment. In numerical calculation, a, b, c values corresponding to each kind of explosive amount and the average value are shown in Table 2. Finally, this paper presents the formula of overpressure peak load attenuation when the subway explodes, as shown below:
where ΔP is peak overpressure, in unit kPa; L is explosion distance, in unit m; S is the tunnel area, in unit m2; D is the equivalent diameter of tunnels, in unit m. Formulas in this paper are proposed based on numerical experiments. Further, as per the characteristics that subways may actually be attacked by terrorists, the position of explosive charge in numerical calculations is not in the center of the tunnel section, but beneath the cross-section at the bottom of the tunnel. Different charge locations also have some impacts on the overpressure distribution of the subway tunnel.
Fig. 20Equivalent amount of 5 kg TNT
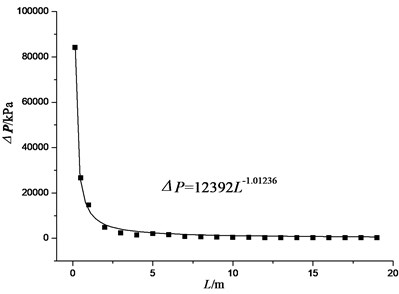
Fig. 21Equivalent amount of 10 kg TNT
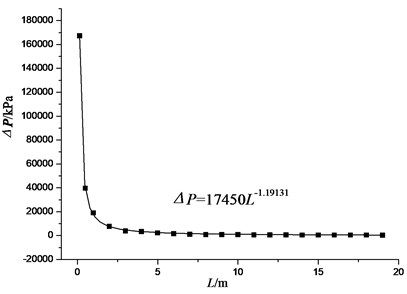
Table 2Constant fitted values under different explosives
5 kg TNT | 10 kg TNT | 20 kg TNT | 40 kg TNT | Average | |
a | 3372 | 3992 | 4175 | 4063 | 3900 |
b | –0.297 | –0.309 | –0.272 | –0.093 | –0.243 |
c | –0.345 | –0.334 | –0.370 | –0.549 | –0.399 |
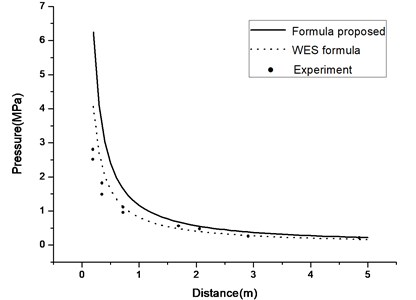
Explosion test data in the U.S. WES were used and compared with the formula proposed in this paper, which signify the applicability of formula herein.
The American Waterway Experiment Station (WES) conducted experiments of tunnel test explosions on a pipe model with an inside diameter of 24.3 cm. The charge amount was 0.0199 kg and the test data are for reference. The formula herein and the WES formula are employed for prediction. Fig. 22 is a comparison of results. As can be seen, in the area near the explosion source, formula in this paper is larger than the experimental values and the WES predictive value. With increasing in the distance, formula in this paper and WES predictive value slowly approach the experimental values. Because charging in the WES test is at the center of the steel pipe, while formula proposed herein charges somewhat below the structure, the calculated pressure values in the vicinity of explosives will be higher than the WES experimental values.
Fig. 22Comparisons of formula predictive value and WES test
4. Conclusions
The following conclusions can be obtained from the study findings:
1) A numerical analysis is carried out of internal explosion tests in tunnels. By comparing the blast wave history curve and the numerical calculation curve, the finite element model and applicability of the parameters adopted in this paper are verified. The calculation methods can be used in studying flow field distribution of blast waves within the subway structures.
2) When explosives go off in tunnels, the air shock wave will be influenced by many factors including the tunnel shape, powder charge shape, powder charge position, and distance to the explosion center. Near the explosion zone, the shock wave reflects and overlays; the flow field distribution is complex. Peak overpressures at different points of the same cross-section from the explosion center have quite different arrival time. With the gradual increase of the explosion center, the shock wave peak overpressure and arrival time slowly decrease, indicating that after a certain distance, the explosion wave gradually transmits in a stabilized fluctuation form.
3) When subway tunnels explode, near the explosion zone, peak overpressure of the shock wave is large and loads are relatively concentrated; by charge position, shape charge, tunnel form, the incident angle of impact, the bottom of the circular tunnel, the top and both sides suffered shock load is relatively large, prone to damage. Moreover, powder charge position, powder charge shape, tunnel pattern, incident angle, the bottom, the top and two sides of a circular shaped tunnel are subjected to relatively large shock wave load and prone to destroy.
4) The dimensional analysis principle is used. By numerical tests, the lining overpressure of explosion occurring in the subway tunnel is summarized and the lining overpressure attenuation formula is proposed. Compared to data of explosion tests at home and abroad, the formula has been proven to have some applicability and can provide some reference to the design of antiknock loads of subways and evaluation of casualties.
References
-
Yang Kezhi, Yang Xiu-min Shock wave propagation inside tunnels. Explosion and Shock Waves, Vol. 21, Issue 1, 2003, p. 37-40.
-
Pang Weibin, Hexiang Li The formula for air blast time of arrival in tunnel. Explosion and Shock Waves, Vol. 23, Issue 6, 2003, p. 573-576.
-
Welch C. R. In-tunnel air blast engineering model for internal and external detonations. Proceeding of the 8th International Symposiun on Interaction of the Effects of Munitions with Structures, New York, 1997.
-
Livemore Software Technology Corporation, LS-DYNA Keyword User’s Manual (Version 970). California, 2003.
-
Choi S., Wang J., Munfakh G., Dwyre E. 3D nonlinear blast model analysis for underground structures. Geotechnical Engineering in the Information Technology Age, Vol. 37, Issue 5, 2006, p. 206-221.
About this article
The authors would like to acknowledge the financial support from National Natural Science Foundation of China under Grant number 51308019, Project supported by Beijing Postdoctoral Research Foundation and Beijing Municipal Natural Science Foundation (8144039) for carrying out this research.
