Abstract
Temperature field has serious effects on the accuracy of rubbing acoustic emission (AE) source localization in a thin-walled cylinder structure, but it is difficult to explore the functioning mechanism through experiments. This paper aims to propose a thermos-elastic coupling simulation procedure to reveal the effect of the uniform temperature and non-uniform temperature field on the propagation characteristics of AE waves. To obtain the behaviors of guiding wave in the thin-walled cylinder, an efficient numerical simulation tool for AE wave propagation modeling is explored. The numerical results of AE propagation in a plate are compared with the experimental data. Then the semi-analytical finite element method is introduced to calculate the characteristics of multi-modal and dispersion. To remove the unwanted reflections from boundaries generated by the numerical simulation, a methodology combined with the infinite element and Rayleigh damping is presented. Consequently, several AE wave propagation simulations are carried out respectively, including the model with the uniform temperature in a range of 20-700 °C, and the non-uniform temperature field with the temperature of the central region, 649 °C. On the basis of the modeling and evaluation results, both the peak-to-peak amplitude and arrival time versus temperatures are summarized and analyzed. The validation results demonstrate that the proposed approach could be used efficiently to research rubbing AE source localization applications with a high degree of accuracy.
1. Introduction
With the development of modern industry the demand of efficiency of machinery such as turbines, aircraft engines and other rotating machinery is increasing. To improve the efficiency of machinery, one effective measure is to reduce the gap between the rotor and stator. However, the probability of failure for the contact between those two parts, known as ‘rubbing fault’, is getting larger and larger. The rotor-stator rubbing is a hazard and it may cause dramatic damage or failure [1], which should be determined and solved in the early time. Since Newkirt et al. [2] explored the thermal effect induced by rub fault of turbo machinery in 1921, the rubbing fault diagnosis methods have been widely appreciated and investigated [3-6]. Lots of significant results are obtained from these researches, which can provide some satisfactory means of rubbing fault diagnosis. Since the increasing requirements of the reliability for large rotating machinery in the practical engineering applications, it is not only necessary to be able to detect the rubbing events, but also should determine the accurate position and severity of rubbing.
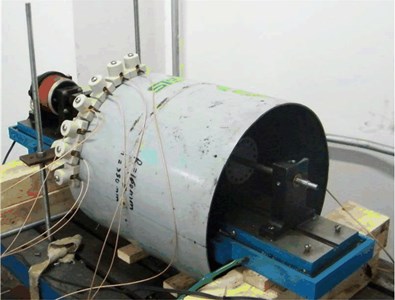
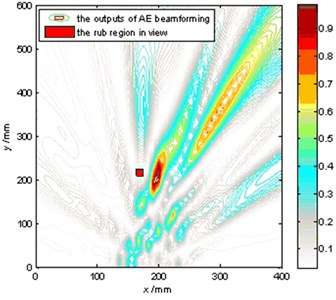
The rubbing is a dynamic process so that the stress distribution among the impacting and friction area is changing, which will produce the instantaneous stress wave [7], also known as the acoustic emission (AE). Compared with the rubbing localization method based on vibration, the AE is verified as a more effective medium used for rubbing diagnose of rotating machinery. For example, Hall and Mba et al. [8] extracted friction characteristics of the sealing effect for a steam turbine based on AE technology (AET). He et al. [9] introduced the near-field acoustic emission (AE) beamforming method to estimate the AE source locations in a thin-walled cylinder. The rotor-stator rubbing results demonstrate that the proposed method can effectively determine the region where rubbing occurs. To improve the AE source localization accuracy, He et al. [10] also analyzed some possible factors that influence identification of the rubbing position as shown in Fig. 1. The result showed that the velocity of the AE wave propagating in an isotropic structure seriously affected the source localization accuracy. Additionally, Nakatani et al. [11] investigated the AE source localization in an anisotropic cylindrical plate, which indicated that the velocity in different directions played an extremely important role in AE source localization. Except the influences of the material properties the environment factors also have effect on the AE wave propagation, such as the temperature field, which has been shown to be the most influential environmental factor affecting structural health monitoring (SHM) methods [12]. In the operating condition, the aero-engine is surrounded in a non-uniform temperature field, and the temperature difference of different positions in the aero-engine is extremely large, which is evenly changed up to several hundred degrees. The temperature difference has seriously effect on the propagation velocity of AE wave. The issue of non-uniform temperature field cannot be ignored when the rubbing AE source location is conducted on the casing.
Fig. 1Rubbing fault localization experiment: a) experiment setup, b) localization result
a)
b)
Lots of different mechanisms can induce changes into guided wave signals due to temperature variations, as discussed in [13]. The temperature changes cause two primary structural properties to change; the material modulus and the geometry [14, 15]. The change in elastic modulus affects all signal features, while the change in geometry contributes to the change in the wave velocity and in the time of arrival. All signal features which are traditionally used to detect damage in wave-guided structures change with temperature variations. The basic relations between the temperature variation and change in dynamic response of a structure are well enough understood by the community to develop temperature compensation methods. For example, many experimental studies in structural health monitoring have been performed to analyze the temperature effect on Lamb wave propagation and/or transducer features in the past decades. Blaise and Chang [16] analyzed a pitch-catch arrangement for various excitation frequencies between 50 and 150 kHz frequencies in sandwich panels exposed to low temperatures. Lanza and Salamone [17] numerically and experimentally studied the fundamental S0 and A0 modes of Lamb waves in an aluminum plate exposed to temperatures from 40 °C to 60 °C. The change of Lamb wave features, transducer and bonding performance has been analyzed in these investigations. Kijanka et al. [18] used a local interaction approach implemented with a parallel computing architecture and graphics cards to simulate the Lamb wave propagation modeling in aluminum plates exposed to temperature changes. Dodson et al. [12] presented the dispersion and thermal sensitivity curves for an isotropic plate with thermal stress and thermally varying elastic modulus. The thermal sensitivity indicated how temperature affected Lamb wave speeds in different frequency ranges. Although these research works studied the influence of temperature on the propagation of elastic wave in solid structures, they mainly focused on uniform temperature field while the non-uniform temperature field was rarely considered. The AE signal velocity couldn’t be a constant due to the sparse sensor arrangement which is distributed through the large temperature gradient. The velocity fluctuation definitely affects the localization method relying on the arrival time of AE wave. Therefore, it is of great significance to investigate the influence of non-uniform temperature field on aero-engine rubbing fault location accuracy.
In authors’ previous research work [9, 10] the rubbing fault localization method based on AE source is explored, and also some factors that affect the localization accuracy are analyzed. However, the non-uniform temperature field is not taken into consideration. In this paper, the authors aim to propose a simulation method that can consider this factor for the AE wave propagating in the casing. To begin with, the simulation method of AE propagation based on FEM is presented. Then to reduce the influence of reflections on the analysis result, especially the velocities of fundamental modes, peak-to-peak amplitude and arrival time, a methodology that can effectively control the level of reflections from the boundaries of the thin-walled cylinder structures is developed. Meanwhile, a pencil lead broken (PLB) test on a steel plate is carried out to verify the accuracy of the FE model. The thermo-elastic coupling simulation method is presented to reveal the affecting mechanism of the uniform temperature field and non-uniform temperature field on the propagation characteristics of AE waves. Its correctness is verified by experiments. Finally, simulations of AE wave propagation in casing under temperature field are carried out. Some important results are obtained, which can give significant suggestions for improving the accuracy of AE source localization.
2. Simulation method of AE propagation based on FEM
2.1. Establishment of simulation method
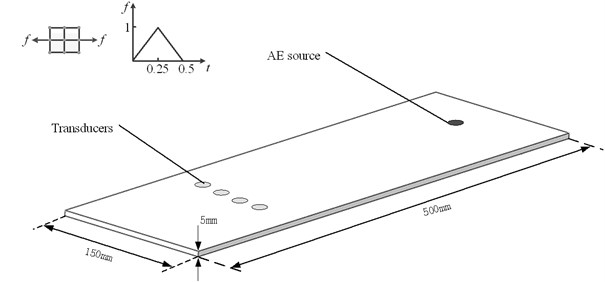
Modeling of AE wave generation and propagation in plate is discussed in the following sections. AE is defined as the class of phenomena whereby transient elastic waves are generated by the rapid release of energy from a localized source or sources of damage [19]. In laboratory environment this corresponds to a Hsu-Nielsen AE source that could be generated by a pencil lead broken on the surface of the structure. The acoustic waves in plates are generated passively using a mechanical pencil lead break input, and actively using a surface bonded piezoelectric actuator [20]. To model impact, delamination, or crack propagation, a transient excitation such as a delta or step function is needed. In order to excite an AE signal, a triangular forcing function f(t) is applied (Fig. 2). In the present configuration, the total distance of the two points acting as buried dipole source is 1 mm with 1 N force magnitude [21, 22].
Fig. 2Numerical simulation model of AE wave propagation
The finite element method has a variety of applications and is still evolving. This work uses the commercial software Abaqus/Explicit. Here the theoretical background of the FEM is presented briefly, whereas the details of the used FE models are described. For further reference the author recommends [23] and [24]. The Abaqus/Explicit algorithm is computationally efficient for the analysis of large models with relatively short dynamic response times, which makes it optimal for high frequency simulations. Explicit schemes, as used in Abaqus/Explicit, obtain values for dynamic quantities at t+Δt based entirely on available values at time t. In this section two fundamental finite element criteria are described, which influence the accuracy and costs of a simulation.
2.1.1. Integration time step
The explicit procedure integrates through time by using many small time increments. The central difference operator is only conditionally stable, the stability limit being approximately equal to the time for an elastic wave to cross the smallest element dimension in the model. The default setting of Abaqus/Explicit is to calculate this time step on its own:
where lemin is the smallest element dimension in the mesh and cL is the wave speed of longitudinal waves defined.
A good rule [25] for the relation of the time increment Δt and the maximal frequency of interest fmax is given by:
2.1.2. Element size
The size of the elements must be chosen so that the propagating waves are accurately captured. In [26] it is recommended that more than 10 nodes per wavelength are used, while [25] and [27] use a higher number. This can be expressed by:
with:
where le is the element length, λmin is the shortest wavelength and kmax is the maximum wavenumber of interest. The shortest wavelength can be approximated by the transverse wave speed cT and the maximum frequency that should be simulated. This leads to the overall relation:
2.2. Reflections elimination of the AE wave propagation
For wave propagation analysis, the usual finite boundary of the finite element model will cause the elastic waves to be reflected and superimpose with the progressing waves. Unwanted reflections from the boundaries of the system have been a limiting factor for FE modeling of waves, and also the reflections make the measured AE signals more complicated. Some basic but essential parameters, such as the velocities of fundamental modes, peak-to-peak amplitude and arrival time are distorted as well. But these indicators are the best choice to reveal how the temperature affects the AE wave propagation. Hence, removal of unwanted reflections is a requirement in order to correctly represent wave propagation in the system. This section attempts to present a new modeling method of plate waves by investigating the removal of unwanted reflections from the boundaries of the thin-walled cylinder structures.
Instead of simply applying a damping at the boundary as suggested by Lysmer and Kuhlemeyer, it is proposed here to modify the infinite element method by considering a damping effect in the model [28]. One important point to note is that the introduction of damping decreases the value of the stable time increment when solving the model with the central difference explicit scheme [28].
Stiffness or mass proportional damping can be introduced in time or frequency domain models in most FE packages and is generally termed Rayleigh damping. We define:
where, CM and CK are the mass and stiffness proportional damping coefficients.
One important point to note is that the introduction of damping decreases the value of the stable time increment when solving the model with the central difference explicit scheme [28]. A high value of CM causes a relatively small decrease in the stable increment whereas one of CK usually has very strong effect on computational efficiency (e.g. time increment divided by a thousand or more). The value of CK is usually an order of magnitude less than that of the time step. Therefore, it is preferable to avoid using CK to define damping effect with an explicit scheme. For this work, we only used CM for FEM studies.
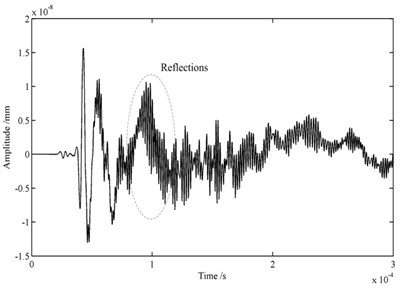
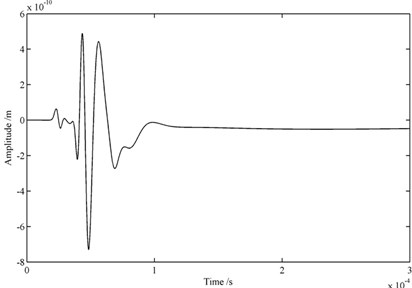
To test the reflection elimination ability of the proposed method, the AE wave propagation simulation result with the method is compared to the result of the case with infinite element only. Fig. 3(a) shows the waveform in time domain for the case of FE models without reflections elimination. It displays that the reflections from the boundaries of the plate are extremely obvious when only infinite elements are adopted. But when the infinite elements and Rayleigh damping are applied together, it can be found that there is no obvious reflection in the area of interesting as shown in Fig. 3(b). This example confirms that the proposed method can effectively remove the reflections and also attenuate the coupling between the AE signals and reflections.
Fig. 3Wave packets received by one transducer: a) FE models with infinite elements, b) FE models with infinite elements and Rayleigh damping
a)
b)
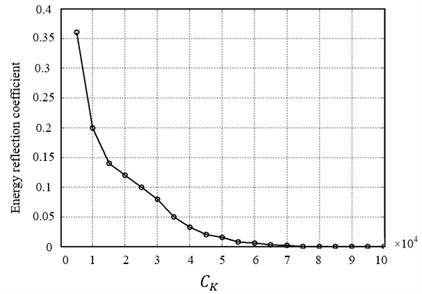
Several simulations are conducted to determine the optimum value of damping coefficient. The results are presented in Fig. 4 for the energy reflection coefficients via various CM. It can be clearly seen that when the CM is increased the energy reflection coefficient decreased sharply. When the value of CM reaches 5×10⁴, the energy reflection coefficient is 0.16. Moreover, the energy reflection coefficient is attenuated to 0.001 when CM is 8×10⁴. However, the CM cannot be too large since the AE signal may be distorted. Therefore, the optimal CM is determined as 8×10⁴ in this AE simulation.
Fig. 4Influence of Rayleigh damping on the energy reflection coefficients
2.3. Verification of the proposed method
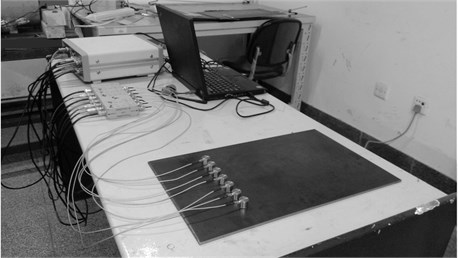
In order to verify the accuracy of this FE model, the PLB test on a steel plate is carried out, as shown in Fig. 5. Signals are recorded by a full-waveform acoustic emission apparatus. The steel plate specimen has the dimensions of 500 mm length, 150 mm width and 5 mm height. To visualize the modal composition of the AE signals the Choi-Williams transformation is calculated using the software package AGU-Vallen Wavelet [29]. The results are compared to analytical solutions of dispersion curves calculated for the respective propagation medium and distance. The resulting energy diagram with additionally calculated dispersion curves of is shown in Fig. 6. The signals obtained through FE simulation are transformed and the result is shown in Fig. 6(a), while the signal of the PLB test is shown in Fig. 6(b). From these two figures it can be found that at low frequencies the dominance of the asymmetric mode on the surface of the plate is stronger compared to the symmetric mode. It also can be found from Fig. 6(b) that there are lots of waves with different frequencies except the A0. These should be the reflections generated when the waves are contacting the boundaries.
Fig. 5Pencil-lead broken experiment setup
3. Thermo-elastic coupling simulation and testing verification
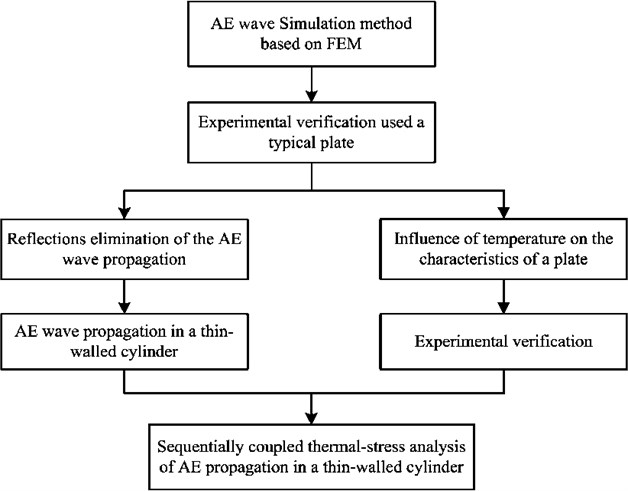
In this section the thermo-elastic coupling simulation method is presented. Sequentially coupled thermal-stress analysis is one kind of methodology to solve coupled thermal-stress problems [30]. If the stress/displacement solution is dependent on a temperature field but there is no inverse dependency, a sequentially coupled thermal-stress analysis can be conducted. Sequentially coupled thermal-stress analysis is performed by solving the pure heat transfer problem, then reading the temperature solution into a stress analysis as a predefined field. In the stress analysis the temperature can vary with time and position but is not changed by the stress analysis solution. Based on the sequentially coupled thermal-stress analysis this paper proposes a methodology which is suitable for AE wave propagation. Fig. 7 shows the flow chart of the coupled thermal-stress analysis. The result of the temperature field analysis is taken as the loading condition for the AE propagation simulation.
Fig. 6WT results for an isotropic plate
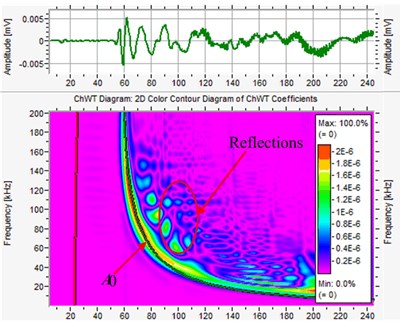
a) FE simulation
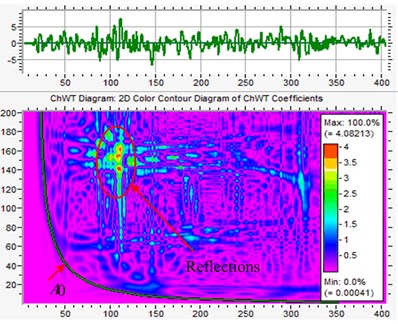
b) Pencil lead broken test
Fig. 7Flowchart of coupled thermal-stress analysis based on FEM
To verify the correctness of the method, a simulation is conducted, where the model is established according to Marzani [13] research work. The result also is compared with the experiment data. In Marzani experiment the plate is placed in a constant temperature environment. The external excitation energy is so weak that the deformation of the aluminum plate has little effect on temperature. A coupled temperature-displacement procedure is used to solve simultaneously for the stress/displacement and the temperature fields. A coupled analysis is used when the thermal and mechanical solutions affect each other strongly.
In the study a 1020-Aluminum plate with dimensions 400 mm×350 mm×1.58 mm was used. The measurements were taken in an environmental chamber between –40 °C and 60 °C at 10 °C intervals. Thermo couples were attached to the plates to verify that thermal equilibrium was achieved at each temperature step. The system responses computed at the two extreme temperatures (–40 °C and +60 °C) for the actuating pulse with central frequency of 200 KHz, are represented in Fig. 2. Such responses were obtained by considering a sampling frequency of 5 MHz. To visualize the modal composition of the AE signals the Choi-Williams transformation is calculated using the software package AGU-Vallen Wavelet. The results are compared to analytical solutions of dispersion curves calculated for the respective propagation medium and distance. The result of Choi-Williams transformation diagram with additionally calculated dispersion curves is shown in Fig. 8(b). From these two figures it can be found that the dominance of the symmetric mode is stronger than the asymmetric mode.
Fig. 8Signals obtained from the FE simulation
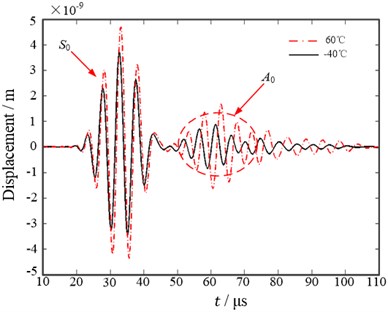
a) Time-waveforms at –40 °C and 60 °C
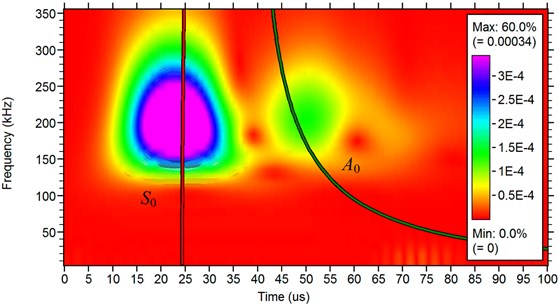
b) Choi-Williams transformation result
It can be observed from Fig. 8(a) that at the temperature of 60 °C the guided modes present a larger time of flight (slower speed of propagation) if compared to those at the temperature of –40 °C. And the average amplitude of the signal at 60 °C is bigger than that at –40 °C. By comparing the numerical responses of Fig. 8(a) with the experimental one represented at reference [15] it can be seen that the predicted signals amplitude at the two investigated temperatures closely resembles the experimental ones. Therefore, the proposed numerical scheme is able to capture the system response behavior at both frequencies as well as at both temperatures.
4. Simulation of AE wave propagation in casing under temperature field
4.1. AE wave propagation in a thin-walled structure without the unwanted reflections
Fig. 9 shows the wave propagation scenes at two distinct times. It can be clearly seen that the two fundamental mode waves are separated when the AE waves are propagating in the casing. Besides, there are no obvious reflections when the AE waves reach the cylinder boundary. The resulting displacements from one transducer are plotted in Fig. 10(a). It can be clearly seen from the waveform in time domain that there is little reflections from the boundary. It confirms that infinite elements are able to remove most of the unwanted reflections, and with the help of Rayleigh damping they are suitable for high accuracy removal of unwanted reflection of bulk waves. Therefore, the AE signals with high signal-noise ratio can be obtained, which are suitable for the continuous AE source location. In addition, the AE wave propagation direction is mainly along the axial direction while there is almost no mode wave in the circumferential direction. This phenomenon is generated due to the directivity of the force dipole used in the AE source simulation. Hence, if the AE sensor array is distributed along the vertical direction of the wave-front, that is the circumference of a circle, the AE signal with strong energy and high quality can be tested. Otherwise, if the AE sensor array is set in the direction parallel to wave front, that is the axial of a circle, the energy of the AE signals would be weak that it is easy to be overwhelmed with background noise. Some important information contained in the original AE signals, such as the arrival time will be confused, which affects the AE source location accuracy.
Fig. 10(b) displays AE waveform in time domain and the corresponding time-frequency analysis result. It can be found that the frequencies of AE signal mainly concentrated about 100 KHz, which agrees with result of the previous dispersion characteristics calculation. There are two main modes of AE signals in this frequency domain. It is similar to the AE wave propagating characteristics in the plate structure with the same thickness.
Fig. 9Propagation of AE wave at two distinct times
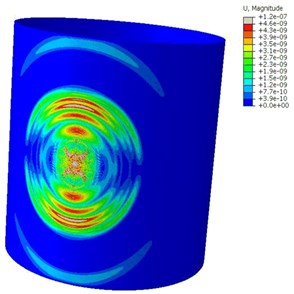
a)t= 30 μs
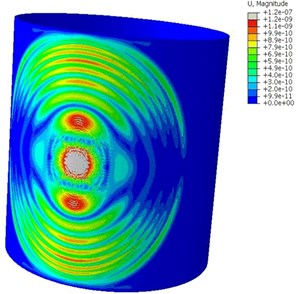
b)t= 60 μs
4.2. Influence of temperature on the AE wave propagation
Based on numerical simulation method of the thermo-elastic coupled issue, the influence of temperature on the AE wave propagation is analyzed in this section. Both the uniform and non-uniform temperature fields are taken into consideration.
4.2.1. Case of uniform temperature field
Since the temperature of the aero-engine is very high and the temperature difference of different position is large, the temperature range of the simulation is assigned between 20 °C and 700 °C. During the analysis, several parameters of properties material must be linked with temperature.
The effect of the sample thermal expansion on the mass density for the Young’s modulus calculation also has to be taken into account. Thus, in the case of a free volume submitted to a thermal variation, the corresponding mass density ρ(T) is given by:
where ρ(T) the mass density at room temperature T0, α is the coefficient of linear thermal expansion. The values of the elastic modulus E (GPa) and Possion’s ratio ν used for the theoretical calculations in this paper are given by reference [43], as shown in Table 1.
Fig. 10Measurement of time of arrival of two modes at room temperature
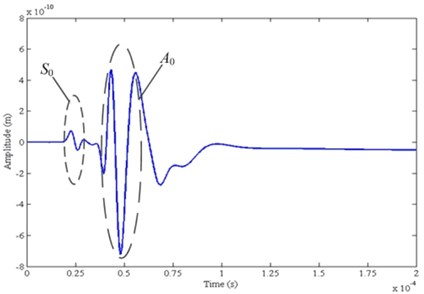
a) Receiving sensor response
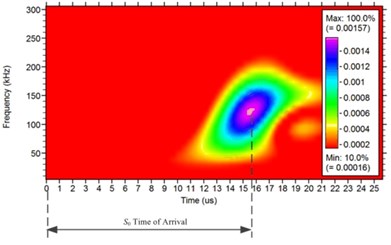
b)S0 time of arrival
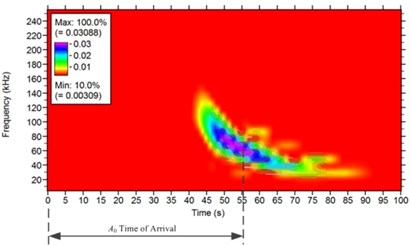
c)A0 time of arrival
Table 1Elastic versus temperatures
T (°C) | 21 | 93 | 149 | 204 | 260 | 316 | 371 | 427 | 482 | 538 | 593 | 649 |
E(GPa) | 203.4 | 198.6 | 195.1 | 191 | 188.2 | 184.1 | 175.8 | 166.9 | 154.4 | 140.7 | 124.1 | 107.6 |
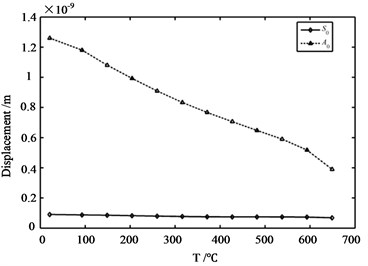
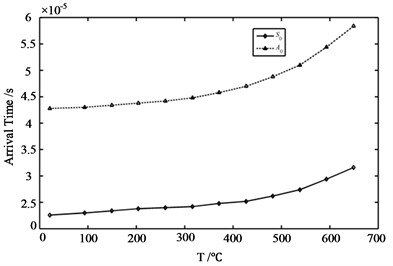
It can be observed from Fig. 11 that at 700 °C the guided modes present a larger time of flight (slower speed of propagation) if compared to those at 20 °C, but while at 20 °C the signal has in average bigger amplitude with respect to that at 700 °C. The peak-to-peak amplitude is further analyzed for all temperature values investigated. Fig. 12(a) shows the peak-to-peak amplitude versus temperature for the first Lamb wave packet for the S0 mode wave (solid waveform) and the A0 mode wave (dashed waveform). The analyzed amplitude generally decreases with the increased temperature. Clearly, the trend is not linearly related to temperature. Fig. 12(b) shows the arrival time of the first and the second Lamb wave packets for various damage severities involved all temperature values investigated. The results show that for both S0 mode wave and A0 mode wave with increasing temperature values, arrival times also increase. Also, the trend is not linearly related to temperature.
In summary, for plane time-harmonic waves the coupling function between the thermal and mechanical fields affects the essentially mechanical waves in that these waves become dispersed and attenuated.
Fig. 11Waveforms in time domain of the AE signals tested under 20 °C and 700 °C
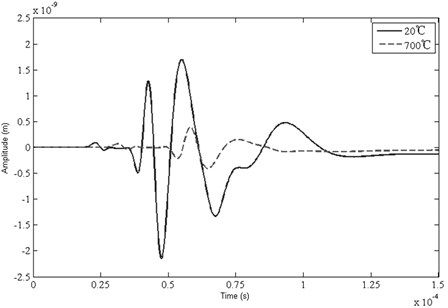
Fig. 12a) Peak-to-peak amplitude versus temperatures; b) solid waveforms represent data of S0 mode wave whereas dashed waveforms correspond to A0
a)
b)
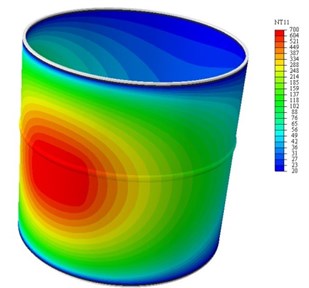
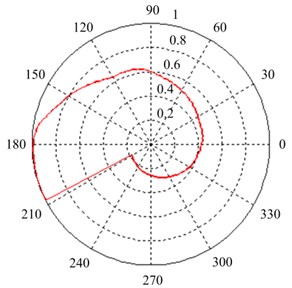
Fig. 13Non-uniform temperature field
4.2.2. Case of non-uniform temperature field
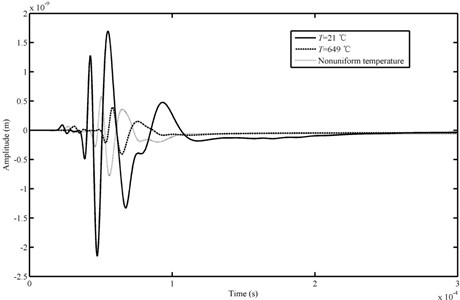
To create the non-uniform temperature field condition, the heat source is concentrated in a small region of the casing. The temperature of central area is 649 °C. Fig. 13 shows the non-uniform temperature field, which is assigned as an input condition of the thermo-elastic coupled analysis. It also displays the temperature distribution along a whole cycle path. Since the non-uniform temperature field distribution is obtained, the thermo-elastic coupling analysis can be carried out according to the previously proposed method. Fig. 14 shows the waveforms of the AE signals tested from simulation with different temperature conditions. It indicates that the non-uniform temperature field also has effects on the amplitude and arrival time of the AE wave. Besides, although the temperature of the central area is the same as the uniform temperature field, the influence is not the same. Thus, it is necessary to consider the factor of non-uniform temperature field acting on the AE source localization for the real aero-engine.
Fig. 14Comparison of AE waveforms in time domain obtained from different temperature
5. Conclusions
When the AE wave propagates in the casing, the waveform is affected by the propagation path and environmental factors, where the temperature has serious effect. In this paper, the authors aim to propose a simulation method that can consider the factor of the temperature for the AE wave propagating in the casing. The thermo-elastic coupling simulation method is proposed to reveal the affecting mechanism of the uniform temperature field and non-uniform temperature field on the propagation characteristics of AE waves. Some conclusions are summarized as following.
1) By analyzing the AE waveforms obtained from simulations with different temperatures, it concludes that the peak-to-peak amplitude and arrival time are prone to be influenced. For both S0 mode wave and A0 mode wave with increasing temperature values, arrival times are delayed while the amplitudes are decreased. Besides, the non-uniform temperature field also has effects on the amplitude and arrival time of the AE wave. Although the temperature in the central area of the non-uniform is the same as the uniform temperature field, the influence of the former on the peak-to-peak amplitude and arrival time is less weak than the latter. However, the rubbing source localization is conducted based on the difference of arriving (DOA) time among the AE sensors rather than the DOA of one sensor. When a thin-walled cylinder structure is surrounded in non-uniform temperature field, the temperature difference of different positions is extremely large. Effects of non-uniform temperature field on the acoustic emission wave propagation can be regarded as linear superposition of numerous different uniform temperature fields. The DOA of different AE sensors is not the same so that the influence of non-uniform temperature field on the rubbing source localization is much more complicated than the uniform temperature field. Therefore, for the issue of non-uniform temperature field it is impossible to eliminate AE source localization errors through changing the velocity.
2) When the AE wave propagation direction is mainly along the axial direction, there is almost no mode wave in the circumferential direction. This is caused due to the directivity of the force dipole used in the AE source simulation. Hence, if the AE sensor array is distributed along the vertical direction of the wave-front, that is the circumference of a circle, the AE signal with strong energy and high quality can be tested. Otherwise, if the AE sensor array is set in the direction parallel to wave front, that is the axial of a circle, the energy of the AE signals would be weak that it is easy to be overwhelmed with background noise. This will generate large error to some important information contained in the original AE signals, such as the arrival time, which affects the AE source location accuracy. Therefore, the research on the mechanism of rubbing AE wave such as predisposing factors and the directivity of energy propagation is beneficial to localize the rubbing sources. It is absolutely essential for the authors to investigate that in future work.
3) Since the temperature influences the arrival time of the AE signals, the accuracy of AE source localization for those methods depended on the arrival time will be reduced. In addition, for the uniform temperature field, the AE signal amplitude decreases with the increase of temperature, so that the amplitude of S0 mode wave is severely weakened. Then the energy of the S0 mode wave is so poor that it is easy to be fallen into oblivion among the background noise. Therefore, the A0 mode wave can be selected as medium for rubbing source localization. Besides, the dispersion property should be referred so that the signal with relatively weak dispersion can be chosen. It also can develop some source localization methods which don't need accurate wave velocity.
References
-
Yang Y., Cheng J., Zhang K. An ensemble local means decomposition method and its application to local rub-impact fault diagnosis of the rotor systems. Measurement, Vol. 45, 2012, p. 561-570.
-
Newkirt B. L. Shaft rubbing relative freedom of rotor shafts form sensitiveness to rubbing contact when running above their critical speeds. Journal of Mechanical Engineering, Vol. 48, 1926, p. 830-832.
-
Muszyska A. Partial lateral rotor to stator rub. 3th International Conference on Vibration in Rotating Machinery, 1984, p. 327-335.
-
Fan C., Syu J., Pan M., Tsao W. Study of start-up vibration response for oil whirl, oil whip and dry whip. Mechanical Systems and Signal Processing, Vol. 25, 2011, p. 3102-3115.
-
Cong F., Chen J., Dong G., Huang K. Experimental validation of impact energy model for the rub-impact assessment in a rotor system. Mechanical Systems and Signal Processing, Vol. 25, 2011, p. 2549-2558.
-
Chu F., Lu W. Determination of the rubbing location in a multi-disk rotor system by means of dynamic stiffness identification. Journal of Sound and Vibration, Vol. 248, 2001, p. 235-246.
-
Hall L. D., Mba D. Diagnosis of continuous rotor-stator rubbing in large scale turbine units using acoustic emissions. Ultrasonics, Issue 41, 2004, p. 765-773.
-
Hall L. D., Mba D. Acoustic emissions diagnosis of rotor-stator rubs using the KS statistic. Mechanical Systems and Signal Processing, Vol. 18, 2004, p. 849-868.
-
He T., Pan Q., Liu X., et al. Near-field beamforming analysis for AE source localization. Ultrasonics, Vol. 52, 2012, p. 587-592.
-
He T., Xiao D., Pan Q., et al. Analysis on accuracy improvement of rotor-stator rubbing localization based on acoustic emission beamforming method. Ultrasonics, 2014, p. 318-329.
-
Nakatani H., Hajzargarbashi T., Ito K., et al. Impact localization on a cylindrical plate by near-field beamforming analysis, sensors and smart structures technologies for civil, mechanical, and aerospace systems. Annual International Symposium on Smart Structures and Nondestructive Evaluation, San Diego, California, 8345, 2012.
-
Dodson J. C., Inman D. J. Thermal sensitivity of Lamb waves for structural health monitoring applications. Ultrasonics, Vol. 53, 2012, p. 677-685.
-
Marzani A., Salomone S. Numerical prediction and experimental verification of temperature effect on plate waves generated and received by piezoceramic sensors. Mechanical Systems and Signal Processing, Vol. 30, 2011, p. 204-217.
-
Konstantinidis G., Wilcox P. D., Drinkwater B. W. An investigation into the temperature stability of a guided wave structural health monitoring system using permanently attached sensors. Sensors, Vol. 7, 2007, p. 905-912.
-
Musgrave M. J. P. Temperature compensation and travel times of waves. Wave Motion, Vol. 2, 1980, p. 17-22.
-
Blaise E., Chang F. Built-in diagnostics for debonding in sandwich structures under extreme temperatures. Proceedings of 3rd International Workshop on Structural Health Monitoring, Stanford University, CA, 2010, p. 154-163.
-
Lanza F., Salamone S. Temperature effects in ultrasonic Lamb wave structural health monitoring systems. Journal of the Acoustical Society of America, Vol. 124, 2008, p. 161-174.
-
Kijanka P., Radecki R., Packo P., et al. GPU-based local interaction simulation approach for simplified temperature effect modelling in Lamb wave propagation used for damage detection. Smart Materials and Structures, Vol. 22, Issue 3, 2013, p. 035014.
-
Wells R., Hamstad M. A., Mukherjee A. K. On the origin of the first peak of acoustic emission in 7075 aluminum alloy. Journal of Materials Science, Vol. 18, 1983, p. 1015-1020.
-
Berenger J. P. Simulation of asymmetric Lamb waves for sensing and actuation in plates. Shock and Vibration, Vol. 12, 2005, p. 243-271.
-
Sause M. G. R. Simulation of acoustic emission in planar carbon fiber reinforced plastic specimens. Journal of Nondestructive Evaluation, Vol. 29, 2010, p. 123-142.
-
Hamstad M. A., Gallagher A. O’, Gary J. A wavelet transform applied to acoustic emission signals: part 1: source identification. Journal of Acoustic Emission, Vol. 20, 2002, p. 39-61.
-
Juergen K. Computational Characterization of Adhesive Bond Properties Using Guided Waves in Bonded Plates. Ph.D. Thesis, Georgia Institute of Technology, 2006.
-
Zienkiewicz O. C., Taylor R. L. The Finite Element Method. Butterworth-Heinemann, Oxford, 2000.
-
Moser F., Jacobs L. J., Qu J. Modeling elastic wave propagation in waveguides with the finite element method. NDT&E International, Vol. 32, 1999, p. 225-234.
-
Alleyne D., Cawley P. A two-dimensional Fourier transform method for measurement of propagating multimode signals. Journal of the Acoustical Society of America, Vol. 89, 1991, p. 1159-1168.
-
Seifried R., Jacobs L. J., Qu J. Propagation of guided waves in adhesive bonded component. NDT&E International, Vol. 35, 2002, p. 317-328.
-
Mickael B. D. Efficient Finite Element Modeling of Ultrasound Waves in Elastic Media. Ph.D. Thesis, Imperial College London, 2004.
-
Vallen Systeme GmbH. Aoyama Gakuin University, AGU-Vallen Wavelet, Munich, Germany, 2010.
-
ABAQUS v6.11-1 Analysis User’s Manual, 2010.
-
Waas G. Earth Vibration Effect and Abatement for Military Facilities (s-71-14) – Analysis Report for Footing Vibrations Through Layered Media. Technical Report, US Army Engineer Waterways Experiment Station, 1972.
-
Kausel E. An Explicit Solution for the Green Functions for Dynamic Loads in Layered Media. Technical Report, Massachusetts Institute of Technology, 1981.
-
Park J. Wave Motion in Finite and Infinite Media Using the Thin Layer Method. Ph.D. Thesis, Massachusetts Institute of Technology, 2002.
-
Nelson R. B., Dong S. B. High frequency vibrations and waves in laminated orthotropic plates. Journal of Sound and Vibration, Vol. 30, 1973, p. 33-44.
-
Lagasse P. E. Higher-order finite-element analysis of topographic guides supporting elastic surface waves. Journal of the Acoustical Society of America, Vol. 53, 1973, p. 1116-1122.
-
Rattanawangcharoen N., Shah A. H., Datta S. K. Wave propagation in laminated composite circular cylinders. International Journal of Solids and Structures, Vol. 29, 1992, p. 767-781.
-
Mukdadi O. M., Desai Y. M., Datta S. K., et al. Elastic guided waves in a layered plate with rectangular cross section. Journal of the Acoustical Society of America, Vol. 112, 2002, p. 1766-1779.
-
Hayashi T., Song W. J., Rose J. L. Guided wave dispersion curves for a bar with an arbitrary cross-section, a rod and rail example. Ultrasonics, Vol. 41, 2003, p. 175-183.
-
Han X., Liu G. R., Xi Z. C., et al. Characteristics of waves in a functionally graded cylinder. International Journal for Numerical Methods in Engineering, Vol. 53, 2002, p. 653-676.
-
Liu G. R., Dai K. Y., Han X. et al. Dispersion of waves and characteristic wave surfaces in functionally graded piezoelectric plates. Journal of Sound and Vibration, Vol. 268, 2003, p. 131-147.
-
Rose J. L., Ultrasonic Waves in Solid Media. Cambridge University Press, London, 2004.
-
Marzani A., Viola E., Bartoli I., et al. A semi-analytical finite element formulation for modeling stress wave propagation in axisymmetric damped waveguides. Journal of Sound and Vibration, Vol. 318, 2008, p. 488-505.
-
Bocchini P., Marzani A., Viola E. Graphical user interface for guided acoustic waves. Journal of Computing in Civil Engineering (ASCE), Vol. 25, 2010, p. 202-210.
-
Young Modulus of Elasticity for Metals and Alloys, http://www.engineeringtoolbox.com/young-modulus-d_773.html.
About this article
This work was finically supported by the National Science Foundation of China (Grant No. 51275022), Beijing Higher Education Young Elite Teacher Project (Grant No. YETP1116).
