Abstract
Unlike the method of influence coefficients, modal balancing permits a reduction in the number of test runs in order to balance a rotodynamic system. This presents a great contribution to the area of turbomachinery, specifically in the reduction of offline time, as well as of economic losses as a direct consequence of the increased lifetime of the rotatory components. The success of modal balancing depends mainly on correct extraction of the modal parameters of the rotatory systems. One of the current limitations for the application of field balancing is the unreliability of the modal parameter extraction tools due the great quantity of information contained in the response diagrams added to the presence of close modes, which can generate confusion and provoke errors in the extraction process and modal identification. This work presents the development and application of two methodologies for the identification of the optimal modal parameters and close modes in the domain of frequency, applying the concept of coordinate transformation for rotatory systems. These methodologies were implemented separately in vibration signals from two field turbogenerators with the same technical and operational characteristics.
1. Introduction
One of the methods currently used in the balancing process is modal analysis, which assumes that rotatory systems have flat modes of vibration [1]. Although the initial modal balancing process is carried out one mode at a time, it is currently possible to perform the balancing of the different modes of vibration at the same time, without the need to perform test runs, as presented in [2]. For this, one of the procedures used requires knowledge of the modal parameters of each mode of vibration (natural frequency, damping ratio, vibration amplitude, and phase angle), modal forms, and modal mass. However, a factor not commonly considered during the modal balancing process and which generates errors when collocating the correction weights is the angular location of the vibration transducer and its difference to the Principal Directions of Stiffness (PDS) of the mode, as presented in [3]. Both of the aforementioned factors contribute to limiting systematic field application using modal balancing. In addition, further causes are as follows:
a) The massive quantity of information given by vibration sensors in a turbogenerator can be so great and complex that it surpasses the capacity of the available team, whether it be composed of the engineers present or even expert analysts. [4] presents the study of a field turbogenerator that works at 1,800 rpm and has 10 critical velocities, which implies that when obtaining the response diagrams in a raising or lowering of the rotor for balancing, the vibration sensors detect 10 coupled modes in each of its 11 supports. However, it is not clear in the article if the modal forms correspond to horizontal directions, vertical directions, or both. In the event that they are horizontal or vertical, there would be 22 coupled modes in the 1,800 rpm velocity range.
b) Problems in interpretation and extraction errors when close frequency modes are present, as in [5].
c) Low reliability in the tools for Modal Parameter Extraction (MPE).
A work focused on contributing to the solution of sub point b) is presented in [5] in order to define and identify close frequency modes. In [6] a methodology is presented that permits identifying the modes of vibration separation frequency by characteristic patterns, as well as locating the positions where modal parameter extraction is optimum.
This article presents the results obtained when applying the methodologies proposed in [5, 6] to two field turbogenerators with the same physical characteristics and working conditions. This implementation let us to ensure the present of modes separated in frequency as well the identification of close modes in frequency. Further a robustness of the propose methodologies in [5, 6] are prove using data field which include acquisition and processing problems, not linearity behavior, noise and relative amplitude of vibration below the international norm ISO 7919-2. The analysis was performed for diagnostic purposes.
2. Coordinate transformation
In the process of modal balancing, localization of the PDS is fundamental in order to obtain the optimum modal parameters of the different modes of vibration, which also contributes to the uncoupling of the different modes, as presented in [6]. In addition, the difference between the PDS of a mode and the angular position of the sensor generates a proportional error in the collocation angle of the balancing weight, as presented in [3].
The uncoupling of modes of vibration is possible due to it not being and intrinsic property of the rotatory system, but rather a factor that depends on the coordinate system used, as presented in [7]. Therefore, it is possible to generate the behavior that an imaginary sensor q would observe given and angular position α, from two transducers x', x'' placed in an angular position θ, β respectively, where the angular position between x' and x'' can be different from 90°. This is achieved by applying the coordinate transformation method shown in [8], and using Fig. 1.
As presented in [6] the equation of imaginary sensor which permits numerical generation of the dynamic behavior observed for any angular position around the bearing:
This equation represents an imaginary sensor that senses the system movements by using the signals detected from physical transducers in x' and x'' directions. In the other hand, the denominator of Eq. (1) sin(β-θ) usually has a value of 90º because the angular location for θ and β is 45° and 135° respectively. Thus, the terms sin(β-α) and sin(α-θ) in the numerator represent the complex coupling between x', x'' and q. A numerical treatment can be applied in the previous equation in order to determine the modes evolution in different positions around the bearing using coordinate transformation.
Fig. 1Coordinate system
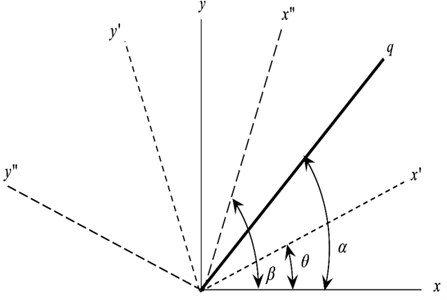
Another application in turbomachinery of Eq. (1) is presented in [11] where the authors generate the dynamic response using the modal parameters and not perpendicular PDS.
Using Eq. (1) permits the generation of an “N” number of response diagrams for different angular positions α. On the other hand, the response diagrams with the proposed analysis are generated numerically and do not require more instrumentation than that already installed in the bearings of a field rotor, which is an advantage, as it does not require further economic investment.
Likewise, by analyzing the above equation, it is possible to obtain the behavior of the phase angle for a vibration separation frequency as mode presented in [2]. For this, the response of a rotor in directions x, y in their sine and cosine components is considered, as follows:
Similarly, for directions x', x'', and q the following is obtained:
In order to obtain the maximum amplitude value of a mode of vibration, it is necessary to determine the value of ωt that avoids the first derivative of displacement with respect to time. This value represents the phase angle of the signal that the transducer detects with respect to an obtained reference, normally using a tachometer, and which is used as a reference in order to localize the angular position of a balancing weight.
In order to show the independent between the phase angles and angular position of q, the real and imaginary components of x' and x'' are used. Substituting Eqs. (4) and (5) in Eq. (1), the following expression is obtained:
Which, when deriving it and equaling it to zero, the phase angle ϕ is obtained, as follows:
The above equation shows an apparent coupling of ϕq in function of angular position of q. However, in order to probe the independent from the imaginary sensor, it is considered that q is orthogonal to the direction x', hence the next equation is obtained:
This condition is met when X'c=X's=0, therefore:
If the previous analysis is applied for direction x'' the conclusion is the same: the phase angle is independent of the angular position of the sensor being exclusively dependent on the vibration components. This property shows that the phase angle is unique for each mode of vibration and provides a characteristic parameter that aids in the identification of vibration separation frequency modes.
Likewise, Eq. (1) can be re-expressed as:
where the period in each of the signals is 2π radian. From the analysis of Eq. (11) the terms in brackets show that in the coupling of the modes, the vibration amplitude will have the behavior of a rectified sine and cosine. Considering a maximum vibration amplitude, it will have a graphic behavior as shown below.
Fig. 2Characteristic variation of the displacement vibration amplitude, with respect to the angular position of the imaginary sensor
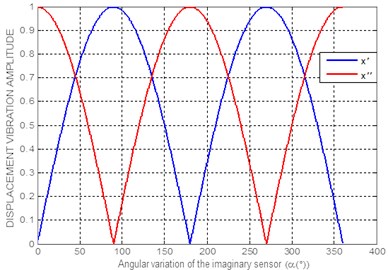
In Fig. 2, it was considered that the difference β-θ= 90°, as the PDS are perpendicular. The variation in displacement amplitude of Eq. (11) provides the characteristic pattern it would have when changing the angular position of the imaginary sensor around the bearing, as well as the localization of the PDSs in the angular q, where the vibration amplitudes are zero. Another important conclusion of Eq. (11), which can be observed in Fig. 2, is that the maximum vibration amplitude occurs 90° ahead of each PDS, and for cases where β-θ≠ 90°, these maximum amplitudes are not found in pair mode PDSs.
3. Identification methodology
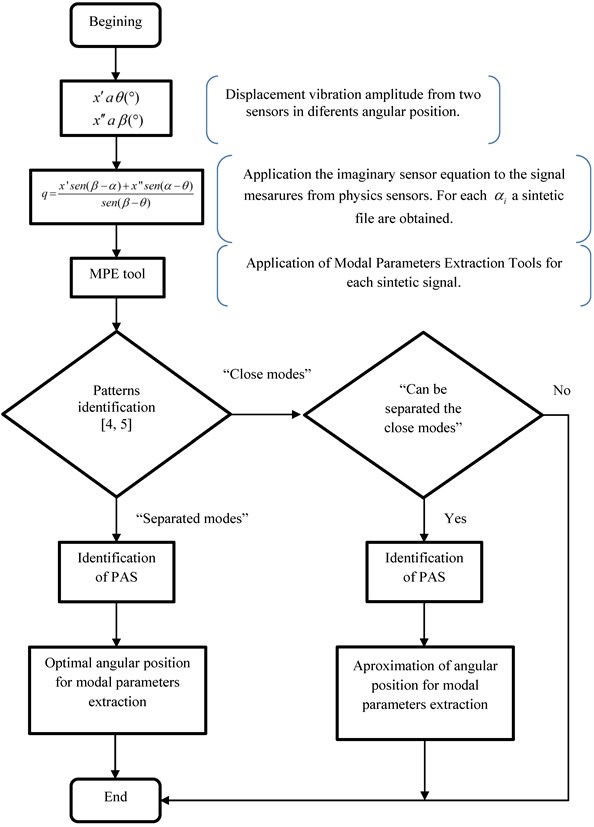
The mode separation frequency identification methodology presented in [4] is carried out using characteristic patterns that permit the determination of the optimal positions for extracting the modal parameters, as well as assuring the presence of a mode of vibration. Likewise, in [5] a methodology for identifying the presence of close frequency modes is presented, using the method of coordinate transformation. The proposed procedures are summarized in the following flowchart.
Fig. 3Flowchart of the identification methods
4. Comparative study of field turbogenerators
The flowchart presented in Fig. 3 was applied in the response diagrams in the signals (two displacement signals per bearing) from the displacement transducers of two field turbogenerators with the same generation capacity working at a velocity of 1800 rpm, shown in Fig. 4.
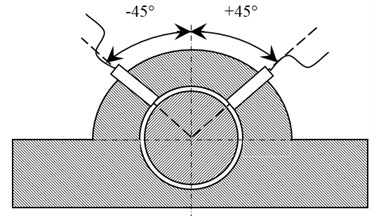
The displacement sensor locations are shown in Fig. 5.
Fig. 4Diagram of a field turbogenerator: H.T. – High-pressure turbine, L.T. – Low-pressure turbine, E.G. – Electric generator, Bi – Bearing in position i

With the goal of avoiding confusion, the measured equipment will be defined using the velocities reached for taking data in deceleration. For turbogenerator 1, the maximum velocity is 1800 rpm, while turbogenerator 2 had an overspeed of 1900 rpm. A two turbogenerator with the same physics characteristics as show in Fig. 4 were analyzing using relative measurement from displacement sensors for each bearing. The authors not have the permission to comment the capacity or location of turbogenerator equipments.
Fig. 5Bearing cross-section
For the beginning of analysis, the given information was:
– Two files for each bearing from displacement sensors at 45° and 135° location as see in Fig. 5. The same information was given for each turbogenerator.
– Digit files in polar plotting format.
– The knowledge of the vibration amplitude was under the ISO 7919-2 international norm.
Different numbers of trial runs were made for each new turbogenerators. The necessity was to identify the different modes under the normal operation speed and its resonance location because an excessive vibration in foundation.
In the study, an analysis performed on bearings 7 and 8 of Fig. 4 will be presented.
5. Results
At the first part this section the study in turbogenerator 1 is presented and then the results of turbogenerator 2 analysis.
5.1. Analysis of turbogenerator 1
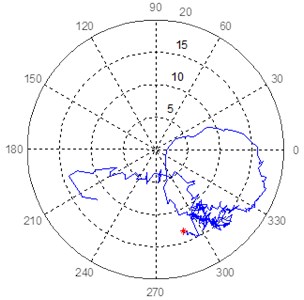
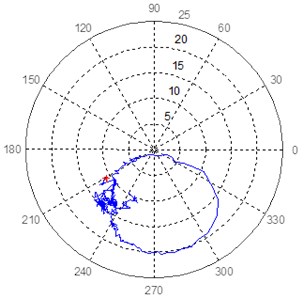
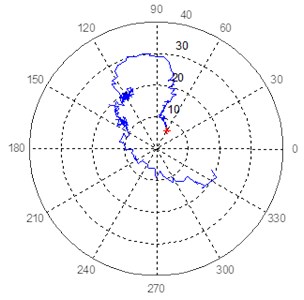
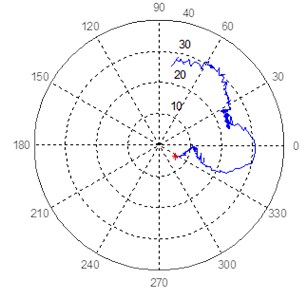
The initial analysis is presented for Equipment 1, showing in the following figures the polar diagrams of bearings 7 and 8 with an angular position of the vibration sensor at 45° and 135°, with respect to the horizontal axis. This bearings are used because of an important component working around resonance were found, also a close modes and separated modes in frequency show a clear patterns. The unit used are μm.
Fig. 6Polar response diagram in bearing 7 at 45° and 135° of turbogenerator 1
a) Bearing 7, sensor at 45°
b) Bearing 7, sensor at 135°
Fig. 7Polar response diagram in bearing 8 at 45° and 135° of turbogenerator 1
a) Bearing 8, sensor at 45°
b) Bearing 8, sensor at 135°
Fig. 8Characteristic patterns of close modes in bearing 7 of turbogenerator 1
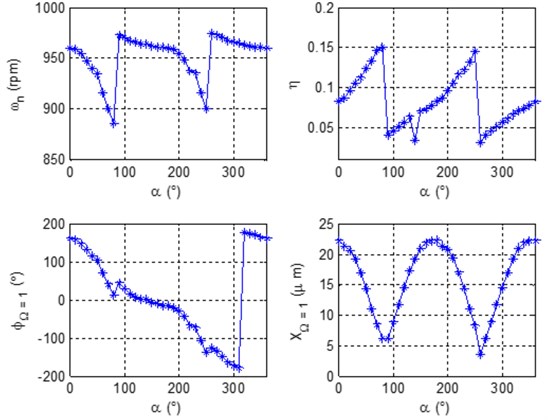
Applying Eq. (1) in the polar diagrams of Fig. 6 and Fig. 7, and following the methodology in the flowchart in Fig. 3, characteristic patterns of a mode separation frequency and a close mode are identified. This is just two of the identified mode in this bearing. These patterns are shown below.
During the analysis of Equipment 1, histeretic damping was used due to the difficulties of applying viscous damping during the MPE stage.
A separate mode of vibration in bearing 7 was identified during the analysis process when applying the methodology proposed in [6] and summarized in Fig. 3. The characteristic patterns are shown in Fig. 9.
Fig. 9Characteristic patterns of mode separation frequency in bearing 7 of turbogenerator 1
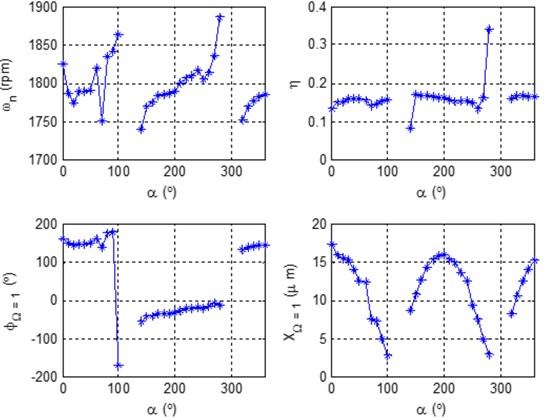
Patterns similar to those presented in Fig. 8 and Fig. 9 were identified during the analysis of bearing 8, and help to corroborate the modes identified in bearing 7.
The modal parameters are presented in the following Tables 1 and 2.
Table 1Modal parameters extracted in the close modes identified in Equipment 1
B. | Mode 1 | Mode 2 | ||||||||
ωn (rpm) | PDS (°) | ϕΩ-1 (°) | η | XΩ-1 (μm) | ωn (rpm) | PDS (°) | ϕΩ-1 (°) | η | XΩ-1 (μm) | |
7 | 885 | 80 | 12.6 | 0.15 | 6.2 | 960 | 170 | –14.6 | 0.07 | 22.3 |
8 | 904 | 80 | 38.5 | 0.15 | 6.8 | 942 | 180 | –52.6 | 0.11 | 24.8 |
Table 2Modal parameters extracted in the mode separation frequency in Equipment 1
B. | Mode 3 | ||||
ωn (rpm) | PDS (°) | ϕΩ-1 (°) | η | XΩ-1 (μm) | |
7 | 1788 | 200 | –33.6 | 0.16 | 16.0 |
8 | 1776 | 170 | 101.3 | 0.13 | 33.0 |
In Table 1, the modal parameters of both close modes are observed, while in Table 2, the frequency separation modal parameters are presented.
5.2. Analysis of turbogenerator 2
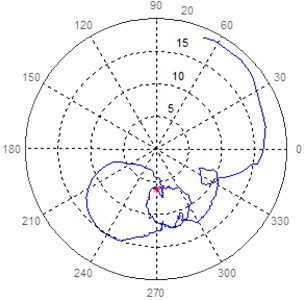
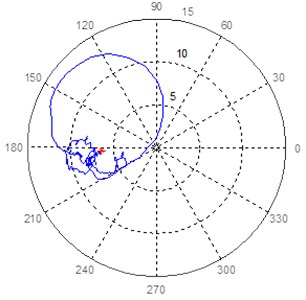
Viscous damping was used for the analysis of turbogenerator 2. The data were acquired in deceleration for an overspeed of 1900 rpm. First, the polar diagrams of bearings 7 and 8 are presented, as shown below. Some of the localized modes are shown in Figs. 10 and 11.
Fig. 10Polar response diagram in bearing 7 at 45° and 135° of turbogenerator 2
a) Bearing 7, sensor at 45°
b) Bearing 7, sensor at 135°
Fig. 11Polar response diagram in bearing 8 at 45° and 135° of turbogenerator 2
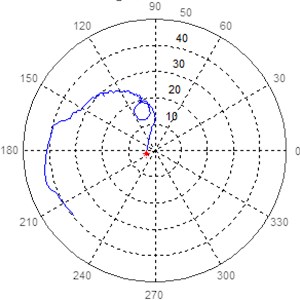
a) Bearing 8, sensor at 45°
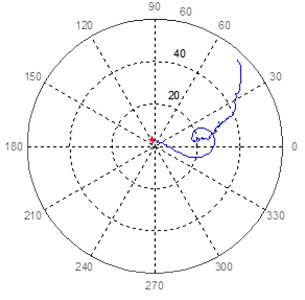
b) Bearing 8, sensor at 135°
Fig. 12Characteristic patterns of mode separation frequency 1 in bearing 8 of turbogenerator 2
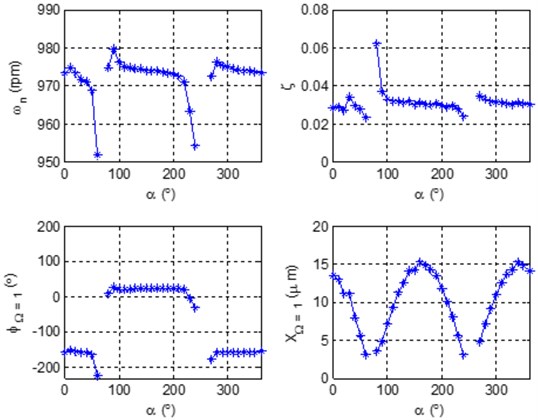
In Fig. 11 the mode separation that was detected and which corresponds to the first mode detected in turbogenerator 1 is presented. Unlike turbogenerator 1, where a pair of close frequency modes was detected, the same mode separation frequency was found in Equipment 2. The even mode of the latter could not be identified.
Another mode detected in bearing 7 is shown in Fig. 13.
Fig. 13Characteristic patterns of mode separation frequency 2 in bearing 8 of turbogenerator 2
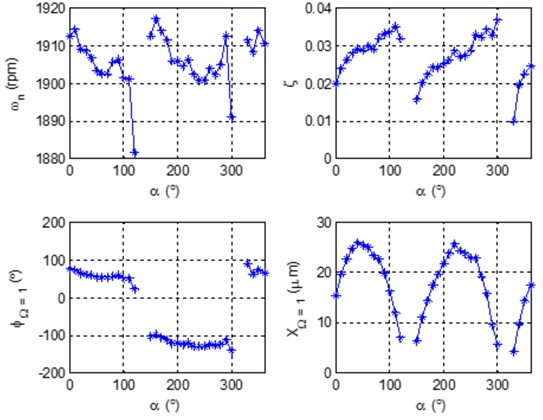
The modal parameters extracted in the modes presented in Fig. 12 and Fig. 13 are shown in Table 3 and Table 4.
Table 3Modal parameters extracted in mode separation frequency 1 in Equipment 2
B. | Mode 1 | ||||
ωn (rpm) | PDS (°) | ϕΩ-1 (°) | η | XΩ-1 (μm) | |
7 | – | – | – | – | – |
8 | 973 | 160 | 24 | 0.03 | 15.19 |
Table 4Modal parameters extracted in mode separation frequency 2 in Equipment 2
B. | Mode 2 | ||||
ωn (rpm) | PDS (°) | ϕΩ-1 (°) | η | XΩ-1 (μm) | |
7 | 1903 | 50 | 53.2 | 0.03 | 25.41 |
8 | 1909 | 20 | –144.8 | 0.04 | 57.35 |
In bearing 7, it was not possible to locate the mode for 973 rpm, as presented in Table 3.
In Table 4, a mode of vibration near 1900 rpm is presented, with a 5.26 % difference with respect to the working speed. This indicates that the electric generator of turbogenerator 2 is working close to resonance in its second modal mode.
6. Discussion
An analysis was run for diagnostic purposes on the polar diagrams of the 2 field turbogenerators with the same physic characteristics. There were several difficulties during the implementation of the methodologies proposed in [5-6], one being the low levels of vibration amplitude, as the equipment was functioning below the established levels in [10], which caused high noise levels coupled with the modes of vibration, making difficult the use of MPE tool. In addition, all of the analyzed diagrams have different levels of run-out magnitude, as shown in Fig. 6, Fig. 7, Fig. 10, and Fig. 11.
According to [10], for an electric generator working at 1,800 rpm when measuring relative peak-to-peak displacement, a permitted vibration amplitude magnitude of 90 μm is obtained for zone A/B (including zones B/C and C/D, the first of these being the range of least vibration amplitude). Based on the vibration amplitudes detected in Tables 1 and 2, these are found to be below ISO standard 7919-2.
Finally, another difficulty arose during the process of adjusting each mode with the experimental MPE tool denominated AMODAL, property of the Electrical Research Institute (ERI) based in Cuernavaca, Morelos, Mexico, due to high noise levels in the polar diagrams.
During the analysis process, in Fig. 8 the presence of close frequency modes were found in the graph (θΩ=1 vs α), and applying the methodology proposed in [5], which is summarized in the flowchart in Fig. 3, the modal parameters presented in Table 1 are extracted. For this particular case, the MPE was performed on each of the modes when considering an 20 % difference in displacement vibration amplitude and perpendicularity between the PDS. [9] demonstrates that for amplitudes in displacement equal to or lower than 20 % a good approximation of the modal parameters extracted from the modes is achieved.
For the case study of turbogenerator 2, no close modes were detected. However, a separation mode was detected with a natural frequency similar to that of the pair of close modes detected in turbogenerator 1. The MPE is shown in Table 3.
During the analysis of Equipments 1 and 2 a separation mode was detected in 7 and 8, as shown in Fig. 9 and Fig. 13. The modal parameters are shown in Table 2 and Table 4, where the identified mode has a natural frequency close to the working velocity, indicating that the electrical generator in Fig. 4 is functioning close to resonance. In the same tables, it can be observed that based on the variation of the phase angle between bearings 7 and 8, this mode corresponds to the second modal mode of the generator.
Finally, a 30° difference is identified between the PDS of bearings 7 and 8 for the same mode of vibration, and that this could be due to errors during the extraction process, the use of relative signals, the presence of twisted modes, or a combination of these factors.
7. Conclusion
Currently, there are various limitations for systematically applying modal balancing in the field, one of the main issues being the low reliability of modal parameter extraction tools, as well as errors during the extraction process mainly due to the interaction between the modes of vibration and problems in identifying the presence of close modes. An important problem in modal balancing, which is not identified as such, is the importance of identifying the PDSs in order to eliminate errors when collocating the balancing weight, as presented in [3], as well these directions are fundamental for obtaining optimum modal parameters [9].
In order to carry out this study, the methodologies proposed in [5-6] were applied in two field turbogenerators with the same characteristics for diagnostic purposes. Initially, these methodologies were developed for the process of modal balancing. The vibration amplitude at mode of interest to be balanced is essential for the correct calculation of the mass correction when the modal balancing is used. To find the optimal position of the mass correction for a particular mode is necessary to calculate over the PDS for this mode. A different position from the PDS will be produced an error proportional to the transducer angular position and the PDS angular difference.
Unlike the [9] where the characteristic patterns of phase angle, damping ratio and natural frequency are constant lines for any imaginary sensor positions around the bearing. However, in this work was showed that for practical analysis the effects of adjacent coupling modes could produce a variation in the particular behavior as well as the amplitude of vibration (see Fig. 9, Fig. 12 and Fig. 13). Thus, the optimal values of these modal parameters have to be extract over the PDS of the interest mode.
However, like modal balancing, the diagnostic process requires identification of the different modes of vibration, permitting its use. During the study, the robustness of the proposed methodologies was tested when applying them in the dynamic response of 2 field turbogenerators with the same characteristics and operations and whose vibration levels were below ISO standard 7919-2. After the analysis, the presence of close modes was detected in Equipment 1, while the same frequency separation mode was detected in Equipment 2. For the case of detected close modes, the modal parameters of each of the modes were obtained.
The second mode identified in the 2 turbogenerators corresponds to a frequency separation mode whose natural frequency is close to the working speed of 1,800 rpm, indicating that the electric generator is working in resonance. Furthermore, it was identified that the mode corresponds to the second modal mode of the element.
Application of the methodologies proposed in [5-6] permitted testing robustness when being applied in field turbogenerator data in order to perform the analysis of different response diagrams using coordinate transformation. The obtained results allowed us to ensure the identification of separated modes and detect the presence of close modes in a field turbogenerator, and that the management of Turbomachinery of the ERI had had indication of its presence for years. On the other hand, evidence of the presence of twisted modes was found in the electrical generator.
References
-
Foiles W. C., Allaire P. E., Gunter E. J. Review: rotor balancing. Shock and Vibration, Vol 5, 1998, p. 325-336.
-
Preciado D. E., Bannister R. H. Balancing of an experimental rotor without trial runs. International Journal of Rotating Machinery, Vol. 8, Issue 2, 2002, p. 99-108.
-
Preciado-Delgado E. Mixed Modal Balancing of Flexible Rotors without Trial Runs. Doctoral Research Work, Cranfield University, United Kingdom, 1998.
-
Gunter E. Imbalance response and field balancing of an 1150-MW turbine-generator with a generator bow. Proceedings of the Seventh Annual Internacional Conference on Rotor Dynamics, Vienna, Austria, 2006.
-
Figueroa D. R. A., Aguirre R. J. E. Identificación de modos cercanos en frecuencia, usando el concepto de transformación de coordenadas. Thirteenth Congress and Exposition of Turbomachinery in Latin-America, Querétaro, México, 2012.
-
Figueroa-Díaz R. A., Aguirre-Romano J. E. Metodología para mejorar la identificación de parámetros modales en balanceo. Proceedings of the Thirteenth International Conference of the Mexican Society of Mechanical Engineers (SOMIM), Guanajuato, México, 2012, p. 378-385.
-
Den Hartog J. P. Mechanical Vibrations. Fourth Edition, 1974, p. 436.
-
Beecher J., Penna J., Bittiger M. Algebra and Trigonometry. Third Edition, 2007, p. 1058.
-
Figueroa-Díaz R. A. Techniques for Extraction of Modal Parameters of the Dynamic Response of an Imbalanced Rotor by Angling a Hypothetical Transducer. Doctoral Thesis in Mechanical Engineering, CENIDET, Electrical Research Institute, México, 2012.
-
International Standard ISO 7919-2. Mechanical Vibration-Evaluation of Machine Vibration by Measurements on Rotating Shaft, Part 2: Land-based steam turbines and generators in excess of 50 MW with normal operating speed of 1,500 r/min, 3,000 r/min and 3,600 r/min. Second Edition, 2001.
-
Figueroa-Díaz R. A., Herrera-Sarellano M., Cruz-Alcantar P., Murillo-Verduzco I. Dynamic response in non-perpendicular stiff main directional rotors using coordinate transformation. Journal of the Brazilian Society of Mechanical Sciences and Engineering, 2015.
About this article
This study received support from CONACYT during the development of doctoral studies. Likewise, we appreciate the support of the management of Turbomachinery of the Electrical Research Institute (IIE) for experience shared by investigators in this field during the development of this project from 2007 to 2011. As special acknowledgment is to Dr. Jorge Aguirre, the director of this research work.
