Abstract
This article presents the results obtained on vibration measurements of the centrifugal pumps together with the measurements of pressure pulsations, generated in the pipeline system. The main task of the current investigation, developed based on previously conducted substantiated experimental investigations, is to identify the main source of pressure pulsations in the pipeline system. More than 9 different operating modes were set for high capacity (up to 1000 m3/h) centrifugal pumps during the vibration and pressure pulsation measurement processes. Throughout the measurements, the high capacity pumps, connected in series or parallel, were transferring fluids to a pipeline, in a length of more than 350 meters. Having conducted the experimental investigation, the main source of pressure pulsations, generated in the pipeline system, was identified.
1. Introduction
Pressure pulsation is a rather common issue in lengthy pipelines, where the supplied product is additionally driven by (pressure is boosted) the pumps, connected in parallel or in series. A number of reasons can affect this process, thus, in order to investigate the pulsation, it is necessary to consider a variety of sources generating the pulsation, starting with the most significant ones. Identifying the sources of pulsation through the experimental research is a long and tiring task, for this reason, some authors, investigating the sources of pulsation, use mathematical or computational fluid flow simulation [1-3], where the fluid pulsation in the centrifugal pump is recorded using the method of hydroacoustics. Researchers of the theoretical models recommend conducting an experimental research with the centrifugal pumps, supplying the product to the pipeline, after the installation works of such pipeline. This is recommended because the theoretical research often imprecisely estimates damping in the pipeline [4, 5]. Other research, analyzing vibrations, generated in the pump housing by the blade-passing frequency [6, 7], is also significant as it is directly related to the centrifugal pump-borne vibrations, triggered in the fluid. Other authors also investigate swirl-caused vibrations, generated by the blades of the centrifugal pumps, which are relevant due to a noise in the pipeline [8, 9]. Low frequency noise, stimulated in the centrifugal pumps, is also analyzed [10]. Vibrations in the hydraulic and pneumatic systems often stimulated by the turbulence especially intensify in the bends, joints, where the diameter of a pipe changes, as well as T-joints. Thus, these processes are also analyzed using the method of acoustics [11]. Having reviewed the scientific publications on the subject of pressure pulsations and noise, generated by the centrifugal pumps in the pipeline, we may conclude that there is a gap in research since there is no one uniform method, which would describe how to precisely theoretically or experimentally predict the pressure pulsations or noise.
2. Object of research
The three pumping stations (with booster, old and the new main pumps) are positioned in the same area, however, in different buildings. The main installation scheme of the pumping stations is shown in the Fig. 1. The booster pumping station is equipped with 2 identical centrifugal pumps. The key nominal values and features of the boosters: Q=710 m3/h, NPSH=3.5 m, n=1500 rpm (25 Hz), h=160 m, P=450 kW; single stage, 4-blade impeller, no diffuser, and a horizontal split case pump. The three centrifugal pumps, installed in the old pumping station, are identical to the centrifugal pumps, installed in the main new pumping station. The latter pumps are horizontal split case pumps with the key nominal features and values of: Q=1140 m3/h, NPSH=13.5 m, n=3000 rpm (50 Hz), h=250 m, P=847 kW; single stage, 5-blade impeller, and 7 stationary diffuser vanes. Manufacturer-specified diameter of the pipes, being connected to the pump: suction side – DNs 350 mm, discharge side – DNd 275 mm. The kinematic scheme of the boosters and the new main pumps is identical. Images of the new main pump and the kinematic scheme are presented in the Fig. 2.
The old pumping station was closed after the new main pumping station with the new pumps was built and launched for operation. The booster pumping station usually has one of the pumps in operation, i.e. one pump is running, while the others remain as spare. Rotational speed of pump impellers can vary from 800 rpm to 1500 rpm, as their electric motors are controlled via the frequency converters. The maximum allowable pressure, generated by the pumps, is 14 bar, and, having exceeded such value, all pumps are turned off automatically. One or two pumps, being connected in series inside the new main pumping station, can operate simultaneously. It depends on settings, preset by the pump operators. Pressure, generated by these two simultaneously operating pumps, cannot exceed a value of 54 bar, otherwise, a safety alarm will be triggered and all of the pumps will shut down. The total pressure inside the pumps and the pipeline is controlled via the booster pump with its variable rotational speed 900-1500 rpm. The minimum allowable flow rate in the pipeline is 700 m3/h, and the maximum – 1200 m3/h. The valve, controlling the flow rate, is installed behind the main pumping station, facing the pipeline (other valves are not given in Fig. 1).
Fig. 1Installation scheme of a centrifugal pump station (Booster No. 1 and the Main Pump No. 2 are shown as working pumps)
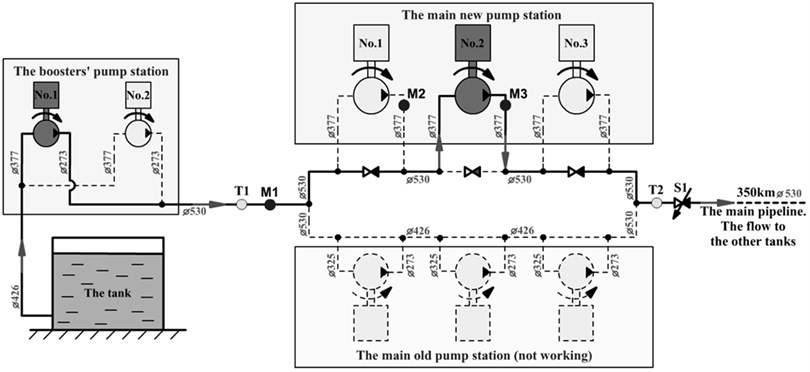
Based on the operation diagram of the pumps, the Booster pumps can operate one by one, however, technological potential allows to connect them in series (image of such is not given in Fig. 1) or parallel. The main pumps can operate individually or be connected in series, however, not more than two pumps can be connected and operate simultaneously.
3. Description of the problem
Pressure pulsations, stimulated in the pipeline of the booster and the main old pumping stations during the operation, were recorded to be very insignificant. The highest value of such pressure pulsation was ~0.2 bar. The old pumping station was physically worn out; therefore, the new one with modern single stage pumps was designed and installed. Having the pumps operating under a new scheme – one booster pump and pumps of the new main pumping station – the pressure pulsations exhibited in the main pipeline were at ~1.5 bar. Having compared the pumps of the old and the new main pumping stations, and a pipeline connected to them, the following differences were observed:
1. The old pumps were the three stage pumps, while the new ones – single stage.
2. The new pumps are slightly of a higher capacity.
3. Diameter of the main pipes is different: the old pumping station – 426 mm, the new one – 530 mm.
4. Diameter of the pipes, connected to the old pumps, is 325 mm (suction side) and 273 mm (discharge side), while the pipes connected to the new pumps are of the same diameter, i.e. 377 mm both on the suction and the discharge side).
Fig. 2a) Kinematic scheme of a pump (EM – electric motor, 1, 2, 3, 4 – roller bearings, M – coupling, n – rotor’s direction of rotation) and b) image of the machine
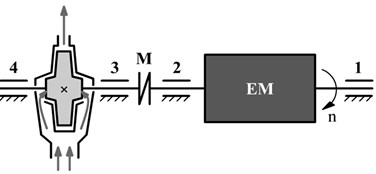
a)
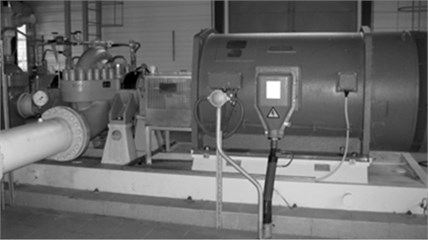
b)
Having conducted an investigation on the pumps and their pipeline system, we may identify few potential causes of significantly increased pressure pulsations in the main pipeline system:
1. Cavitation is generated in the new pumps due to a low-pressure suction in the pipe or due to an overly increased resistance in the discharge pipe.
2. Due to defective and poorly operating new pumps: different impeller blades, wear of the impeller, corrosion, overheating of the pump, etc.
3. Due to improperly sized diameters of the suction and discharge pipes, connected to the main pump flanges.
4. Due to poorly completed pump assembly works at the pumping station and etc.
4. Experimental test and results
In order to identify a source of pressure pulsations, created in the main pipeline, researchers conducted a test on vibrations, exhibited by the booster and the new main pumps (bearing supports). The authors also measured pressure pulsations of the suction and discharge pipes, connected to the main pumps. The vibration test and pressure measurements were conducted using two pieces of portable vibration analysis equipment: four channel A4400-VA4PRO (Adash, Czech Republic) and 12-channel Mobi-Pack (Oros, France) with software. Vibrations were measured using magnetic accelerometers WR797 (Wilcoxon, USA), and the pressure was measured with electronic pressure sensors 2088 (Rosemount Inc., USA).
Vibrations, created in the pump bearing supports, were measured in a vertical and horizontal directions (see Fig. 4), complying with ISO10816 standard requirements. Positions of temporarily installed pressure sensors Rosemount 2088 are shown in Fig. 1 (M1, M2 and M3). Number of permanently installed pressure sensors in the pipeline is rather high; however, only two of them were used in the present research: one in a pipe between the pumping stations and one in a pipe behind the main pumping station, facing the main pipeline (see Fig. 1, T1 and T2). Vibration analysis was conducted based on measured VRMS (10-1000 Hz) values and FFT spectra of vibration velocity.
In the process of the experimental investigation, the pumps ran in 9 different operating modes during which 9 different measurements were made. The two booster pumps (No. 1 and No. 2) and the main pumps (No. 1 and No. 2) were used for the same investigation. No experiment was conducted using the main pump No. 3. These operating modes are presented in Table 1.
Fig. 3Experimental equipment
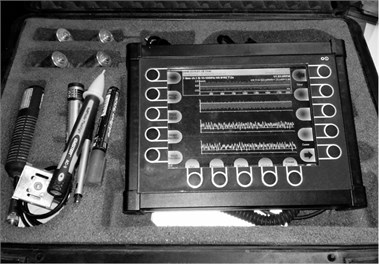
a) A4400-VA4PRO
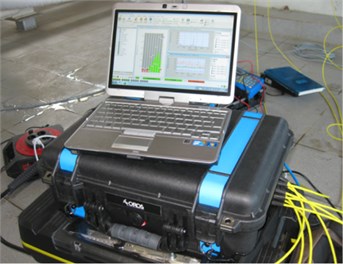
b) Mobi-Pack
Fig. 4Position of the vibration acceleration sensors (accelerometers) on the pump bearing supports (3 V and 3 H – on a third bearing in a vertical and horizontal direction, 4 V and 4 H – on a fourth bearing in a vertical and horizontal direction)
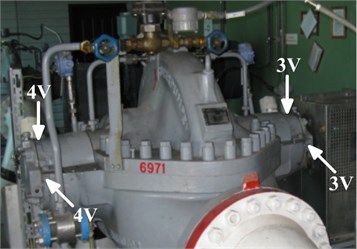
a) Accelerometer positions on the booster pump bearing supports
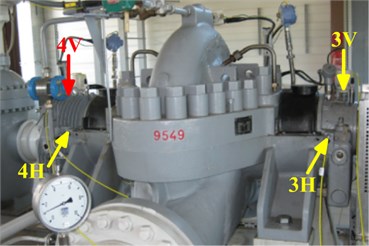
b) Accelerometer positions on the main pump bearing supports
Data, obtained during the experimental investigation having measured vibrations and pressure pulsations of the operating pumps, is presented in Table 2.
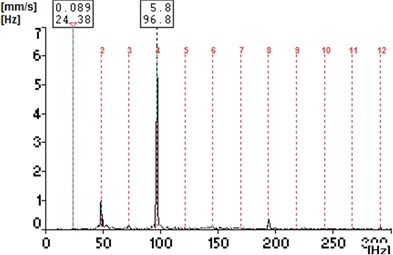
Based on the information, presented in Table 2, and having compared the 1st, 2nd and the 3rd operating modes, it is evident that having increased a booster No. 2 load from 1000 rpm to 1450 rpm, vibrations of the present booster have significantly increased from 1.74 mm/s to 6.24 mm/s. While, vibration level of the main pump No. 2 has only insignificantly decreased from 6.24 mm/s to 5.82 mm/s, with the pressure pulsations in the pipeline (M1, M2 and M3 positions) basically remaining unchanged. The lowest pressure in the pipe between the pumping stations was 7.1 bar, therefore, a possibility of cavitation in the main pump is rejected, as NPSH value of these pumps reached 13.5 m. (during all of the operating modes, the suction pressure was higher than the one necessary for the cavitation to occur). Fig. 5 presents two vibration velocity spectrums of the booster pump No. 1, which are dominated by the 4X frequency vibrations (18.13∙4 ≅ 73.13 Hz and 24.38 Hz∙4 ≅ 96 Hz; 4X – BPF (blades pass frequency); 4 – blade impeller). Vibrations of this frequency were created by the pump’s impeller blades on the discharge side. It is fully natural that having added the booster pump load, vibration values of the present pump (especially 4X) have grown, since pressure of the fluids, being pumped (on the discharge side), and resistance inside the pipe against the main pump have increased.
Table 1Pump operating modes during the experimental investigation
Operating mode number | Booster pumps | Main pumps | Pipeline pressure, bar | Valve S1 position | |||
No. 1 | No. 2 | No.1 | No. 2 | No. 5 | No. 6 | ||
1 | – | Operated at 1100 rpm | – | Operated at 3000 rpm | 7.1 | 31.3 | 100 % opened |
2 | – | Operated at 1200 rpm | – | Operated at 3000 rpm | 9.3 | 33.6 | 100 % opened |
3 | – | Operated at 1450 rpm | – | Operated at 3000 rpm | 12.5 | 36.7 | 100 % opened |
4 | – | Operated at 980 rpm | Operated at 3000 rpm | Operated at 3000 rpm | 6.0 | 53.8 | 100 % opened |
5 | – | Operated at 960 rpm | Operated at 3000 rpm | Operated at 3000 rpm | 6.0 | 53.8 | 50 % opened |
6 | Operated at 960 rpm | Operated at 1050 rpm | – | Operated at 3000 rpm | 7.3 | 31.5 | 100 % opened |
Pumps connected in parallel | |||||||
7 | Operated at 1450 rpm | Operated at 1400 rpm | – | Operated at 3000 rpm | 12.7 | 37.0 | 100 % opened |
Pumps connected in parallel | |||||||
8 | Operated at 1090 rpm | Operated at 1170 rpm | Operated at 3000 rpm | – | 13.8 | 37.9 | 100 % opened |
Pumps connected in series | |||||||
9 | Operated at 1030 rpm | Operated at 1110 rpm | – | – | 13.7 | 13.6 | 100 % opened |
Pumps connected in series | |||||||
Table 2Pump vibrations and pipeline pressure during the experimental investigation
Operating mode number | Bearing support vibration VRMS (10-1000 Hz)*, mm/s | Pressure pulsation in a pipe, bar | |||||||||
Booster pumps | Main pumps | Position of measurement | |||||||||
No. 1 | No. 2 | No. 1 | No. 2 | M1 | M2 | M3 | |||||
Bearing numbers | |||||||||||
3 | 4 | 3 | 4 | 3 | 4 | 3 | 4 | ||||
1 | – | – | 1.74 | 2.44 | – | – | 4.57 | 6.34 | 1.22 | 0.37 | 1.07 |
2 | – | – | 1.96 | 2.23 | – | – | 4.31 | 6.08 | 1.38 | 0.37 | 1.31 |
3 | – | – | 6.24 | 3.67 | – | – | 4.38 | 5.82 | 1.27 | 0.38 | 1.18 |
4 | – | – | 1.85 | 2.24 | 5.01 | 4.45 | 3.68 | 4.23 | 0.82 | 1.05 | 0.68 |
5 | – | – | 1.79 | 2.34 | 6.18 | 4.65 | 5.18 | 3.90 | 0.83 | 1.09 | 0.75 |
6 | 3.13 | 3.06 | 2.11 | 2.86 | – | – | 4.82 | 6.09 | 1.10 | 1.24 | 1.18 |
7 | 5.27 | 5.26 | 7.19 | 7.94 | – | – | 4.00 | 6.00 | 1.05 | 0.15 | 1.18 |
8 | 2.90 | 2.38 | 2.03 | 2.10 | 4.10 | 6.07 | – | – | 0.40 | 0.11 | 1.00 |
9 | 2.42 | 2.65 | 2.38 | 2.46 | – | – | – | – | 0.13 | – | 0.25 |
* NOTE. Vibrations of bearing supports are measured in a vertical and horizontal direction; however, the Table presents only the highest values measured in a particular direction | |||||||||||
Fig. 5Vibration velocity spectrums of the booster pump’s No. 1 bearing support: a – fourth bearing in a horizontal direction (1 operating mode) and b – third bearing in a horizontal direction (3 operating mode)
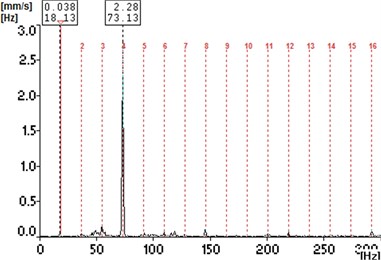
a)
b)
Fig. 6Vibration velocity spectrums of the main pump’s No. 2 bearing supports measured during the operating modes No. 1 and No. 3
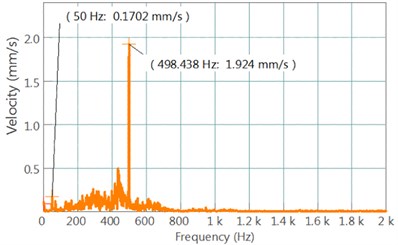
a) Bearing No. 3 (operating mode No. 1)
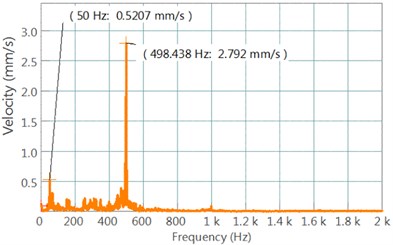
b) Bearing No. 4 (operating mode No. 1)
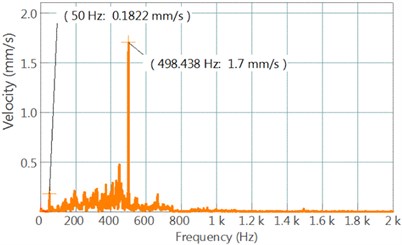
c) Bearing No. 3 (operating mode No. 3)
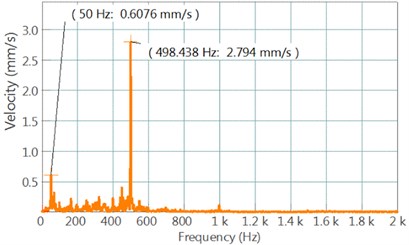
d) Bearing No. 4 (operating mode No. 3)
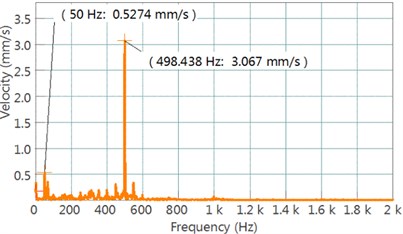
Fig. 6 presents vibration velocity spectrums of the main pump No. 2, which are dominated by the 10X (498.4 Hz) frequency vibrations. In this case, 10X – is pump’s 2xBPF. Since this pump is a horizontal split case pump with a diffuser, it can create two frequency BPF vibrations: BPFsuc (vibration frequency at fluid inlet port – 50 Hz∙2∙Zbl≅498.4 Hz or 10X; here Zbl – number of impeller blades; Zbl=5) and BPFdis (vibration frequency at fluid outlet port – 50 Hz∙Zbl∙ Zdif= 1750 Hz; here Zdif – number of diffuser blades; Zdif=7). Spectrums, presented in the Fig. 6, instead of BPFdis frequency vibrations, are dominated by the 10X frequency vibrations and the noise reaching a value of up to 800 Hz, developed due to cavitation. As it was already previously mentioned, this pump cannot be affected by cavitation, as NPSH value of the present pump is 13.5 m, and the lowest pressure (1-3 operating mode) may reach only 7.1 bar. These findings allow to conclude that cavitation develops not in the main pump No. 2 (and not passed it), but in the area before reaching the pump. Having the vapor cavities formed during the cavitation process prior to reaching the main pump, these cavities, together with the fluids, access the suction blades of the main pump, therefore 2×BPF frequency vibrations dominate in the pump bearing supports.
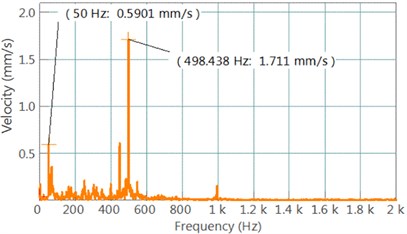
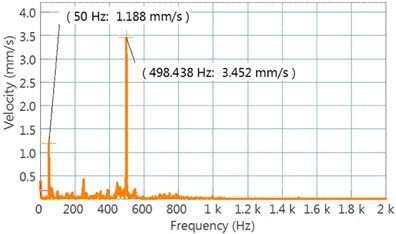
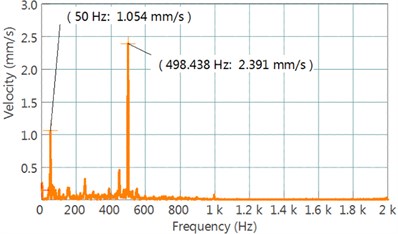
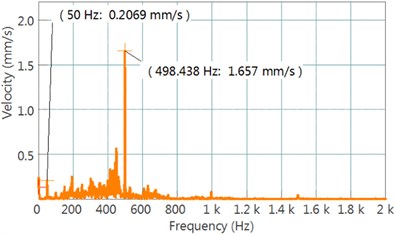
To make sure that the source of pressure pulsations is not related to the main pipeline (small pipeline diameter or too high flow resistance inside the pipeline ant etc.), two tests were ran with the 4th and 5th operating modes. During the time the operating mode No. 5 was in process, the valve S1 was closed by up to 50 %. Data, presented in the Table 2, pertaining to a level of vibrations, clearly states that vibration level of the booster pump remained fairly low (up to 2.35 mm/s) and did not fluctuate radically, while in case of the main pumps – such has increased only slightly with the pressure pulsations in the pipeline remaining mainly stable. Fig. 7 and Fig. 8 present vibration velocity spectrums of the main pumps No. 1 and No. 2, which reveal the dominance of 10X (498.4 Hz) frequency vibrations. Vibrations at 1X (50 Hz) frequency are also observed. The spectrums also demonstrate vibration noise of a small amplitude, reaching a frequency value of up to 800 Hz. These spectrums of vibration velocity remain basically equal to the ones presented in the Fig. 6. Considering these two operating modes (No. 4 and No. 5), it is obvious that even having the valve S1 closed by 50 %, the pressure pulsations have remained slightly changed, i.e., we may assume that the main pipeline has suitable parameters.
Fig. 7Vibration velocity spectrums of the main pumps’ No. 1 and No. 2 bearing supports measured during the operating mode No. 4
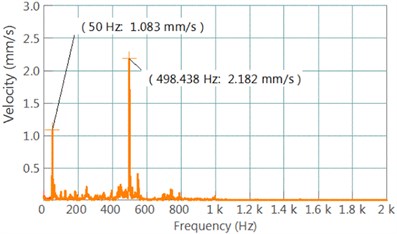
a) Bearing No. 3 of the main pump No. 1
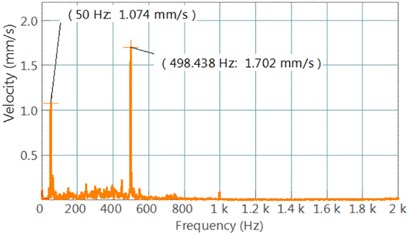
b) Bearing No. 4 of the main pump No. 1
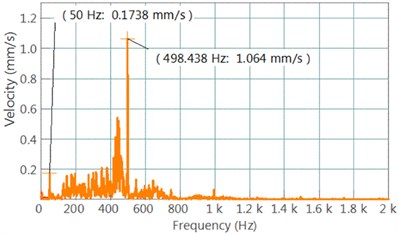
c) Bearing No. 3 of the main pump No. 2
d) Bearing No. 4 of the main pump No. 2
To make sure that the pressure pulsations inside the pipeline are not generated due to a relatively moderate flow, running from the booster pump to the main pumps, the 7th and the 9th operating modes were set, during which the two booster pumps were connected in parallel. During the 6th operating mode, the booster pumps were running under the lowest load (960 r/min and 1000 r/min), while in case of the 7th operating mode – under the highest (1450 r/min and 1400 r/min). During the latter two operating modes, the main pump No. 2 was in operation. Data (presented in Table 2) obtained on the measured vibration level and pressure pulsations in the pipeline reveals that the vibration level of the both booster pumps has increased significantly (up to 7.94 mm/s). Vibration level of the main pump No. 2 basically remained unchanged. Pressure pulsations inside the pipeline also remained unchanged (pressure pulsations of M2 position have reduced, as a valve, which is not shown in Fig. 1, located opposite the pressure sensor, was closed). These operating modes revealed that the main cause of pressure pulsations, initiated inside the pipeline, is not related to a flow rate from the booster pumps.
Fig. 8Vibration velocity spectrums of the main pumps’ No. 1 and No. 2 bearing supports measured during the operating mode No. 5
a) Bearing No. 3 of the main pump No. 1
b) Bearing No. 4 of the main pump No. 1
c) Bearing No. 3 of the main pump No. 2
d) Bearing No. 4 of the main pump No. 2
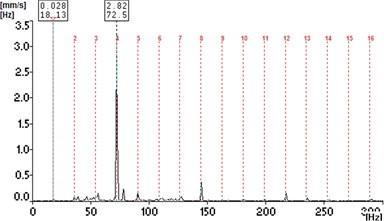
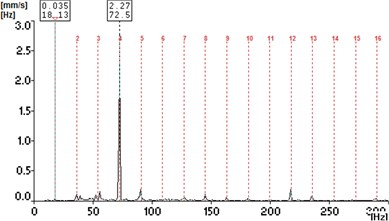
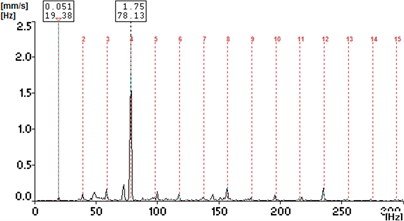
Two booster pumps during another experimental test were connected in series (such is technically possible, although it is not pictured in Fig. 1) and the main pump No. 1 was launched for operation. Data, presented in Table 2, revealed that the vibration level of both booster pumps was not very high (highest value reached 2.90 mm/s with the pump’s No. 1 third bearing support), and in case of the main pump No. 1 – vibration level was only slightly different compared to other operating modes. Pressure pulsations of the M1 position has decreased almost twice, however, in the M3 position – remained have only slightly changed (compared to other operating modes) and reached a value of 1.0 bar. Vibration velocity spectrums of the booster pumps and the main pump No. 1 are given in Fig. 9. These spectrums reveal that the bearing supports of the booster pumps are dominated by the 4X frequency vibrations. Vibrations of the said frequency dominated in all other operating modes as well. Bearing supports of the main pump No. 1 are dominated by the 10X frequency vibrations (same as with other operating modes) and a vibration noise of a small amplitude, reaching a value of up to 800 Hz. Data received during this operating mode has demonstrated that the suction pressure of the main pump is sufficient, as the NPSH value is equal to 13.5 m, while the actual suction pressure reached a value of 13.8 bar. However, vibration generated noise reaching the value of up to 800 Hz and 10X frequency vibrations persist. This demonstrates the signs of cavitation not in the pump, but in the area before reaching the main pump.
So that to validate earlier found results, the last test was ran, during which the two booster pumps were connected in series and none of the main pumps were launched for operation. The vibration level of the booster pumps remained relatively low (the highest measured value – 2.65 mm/s of the No. 1 pump’s 4th bearing). It is apparent that having no main pumps running, the pressure pulsations in the pipeline are significantly reduced (to 0.25 bar in M3 position). Velocity spectrums of the booster pump vibrations are presented in the Fig. 10. These spectrums demonstrate that bearing supports of these pumps are dominated by the 4X frequency vibrations. Results gathered from this operating mode allowed to determine that cavitation, developed before reaching the main pumps (from the 1st to 8th operating mode), was not generated in the booster pumps, i.e. booster pumps do not cavitate and do not have a major effect on pressure pulsations inside the pipeline, when the main pumps are launched for operation.
Fig. 9Vibration velocity spectrums of the booster pumps’ and the main pump’s No. 1 bearing supports measured during the operating mode No. 8
a) Bearing No. 3 of the booster pump No. 1
b) Bearing No. 4 of the booster pump No. 1
c) Bearing No. 3 of the booster pump No. 2
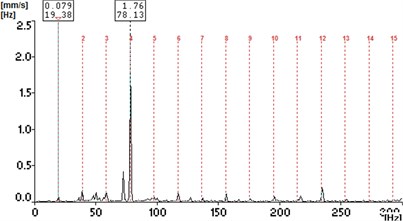
d) Bearing No. 4 of the booster pump No. 2
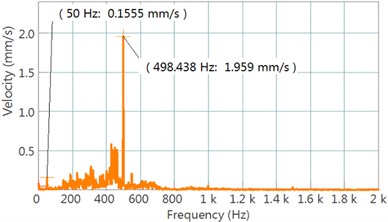
e) Bearing No. 3 of the main pump No. 1
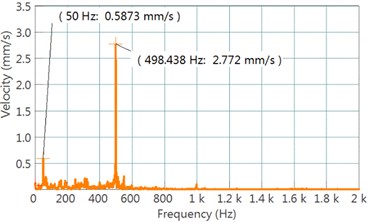
f) Bearing No. 4 of the main pump No. 1
5. Conclusions
1) Having performed 9 different operating mode-based tests in an attempt to measure vibrations and pressure pulsations, being generated in the pipeline of the booster and the main pumps, it was developed that pressure pulsations in the pipeline are generated only when at least one of the main pumps are started. Having the main pumps running, the pressure in the main pipeline pulsates from 0.68 bar to 1.31 bar. Having only the booster pumps running, the pressure pulsations are reduced significantly to a value of 0.25 bar.
Fig. 10Vibration velocity spectrums of the booster pumps’ bearing supports measured during the operating mode No. 8
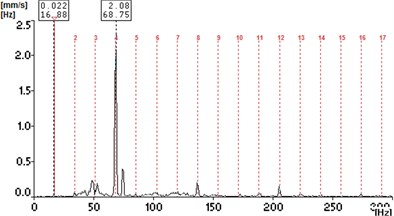
a) Bearing No. 3 of the booster pump No. 1
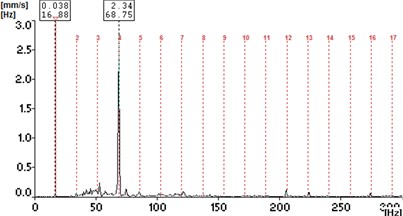
b) Bearing No. 4 of the booster pump No. 1
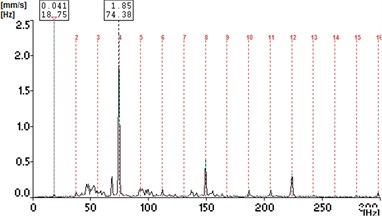
c) Bearing No. 3 of the booster pump No. 2
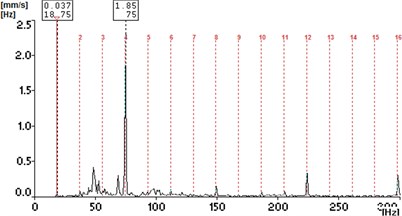
d) Bearing No. 4 of the booster pump No. 2
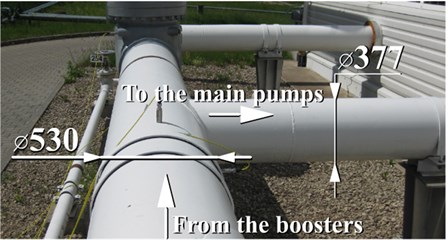
Fig. 11Incorrect piping between the booster and the main pump stations
2) Suction pressure, exhibited by the main pumps during all of the tested operating modes (1-8 operating modes), was significantly higher (6.0-13.8 bar) than the limit pressure value (NPSH=13.5 m), during which cavitation can develop in the main pump. For this reason, an assumption that the main pump, being in operation, cavitates and thus causes a pressure to pulsate inside the pipe is rejected.
3) Having compared the 4th and the 5th operating modes, results allow to conclude that the pressure pulsations are not related to a throughput of the main pipeline, as having the S1 valve closed by 50 %, the pressure pulsations remained unchanged in the pipeline despite the fact that vibrations, initiated in the bearing supports of the main pumps, have slightly increased. For this reason, the main pipeline, located behind the pumps of the main pumping house, has no effect on the pressure pulsations.
4) The conducted experimental testing allows concluding that a flow rate of the fluids to the main pumps is sufficient. Such conclusion was made having compared the parameters measured during the 6th and 7th operating modes: pressure pulsations persisted unchanged, while the vibration level of the booster pumps has increased having loaded them to a maximum permissible load (max up to 1450 r/min).
5) The bearing supports of the booster pumps were dominated by the 4X frequency vibrations throughout all of the operating modes. While the bearing supports of the main pumps were dominated by the 10X frequency vibrations and the vibration noise, reaching a value of up to 800 Hz. Based on these frequencies, we may conclude that the cavitation occurs in a pipe area before reaching the main pumps, during which the vapor cavities reach the main pumps. Vibration noise of up to 800 Hz was generated in the cavitating pipe, and the entering fluids with the vapor cavities generated the 10X frequency vibrations (horizontal split case pump has 5 blades, therefore 1X∙2∙5X =10X).
6) The experimental testing has shown that cavitation in the pipeline has developed due to improperly installed pipelines between the booster and the main pump station (see Fig. 11).
The conical taper joints are recommended to be used when connecting the pipes of a larger diameter (in this case d=530 mm) with the pipes of a smaller diameter (in this case d=377 mm). The present case recommends to change the pipeline configuration when installing the conical taper joint between the pipe with the larger diameter (d=530 mm) and the smaller diameter (d=377 mm). Smooth transition from the pipes with a larger diameter to the pipes with a smaller diameter reduces the probability of a turbulent flow and cavitation of fluids, being transported.
References
-
Langthjem M. A., Olhoff N. A. Numerical study of flow–induced noise in a two-dimensional centrifugal pump. Part I. Hydrodynamics. Journal of Fluids and Structures, Vol. 19, 2004, p. 349–368.
-
Langthjem M. A., Olhoff N. A numerical study of flow–induced noise in a two-dimensional centrifugal pump. Part II. Hydrodynamics. Journal of Fluids and Structures, Vol. 19, 2004, p. 369-386.
-
Choi J., Mclaughlin D. K., Thompson D. E. Experiments on the unsteady flow field and noise generation in a centrifugal pump impeller. Journal of Sound and Vibration, Vol. 263, 2003, p. 493-514.
-
Hayashi I., Kaneko S. Pressure pulsations in piping system excited by a centrifugal turbomachinery taking the damping characteristics into consideration. Journal of Fluids and Structures, Vol. 45, 2014, p. 216-234.
-
Rzentkowski G., Zbroja S. Experimental characterization of centrifugal pumps as an acoustic source at the blade–passing frequency. Journal of Fluids and Structures, Vol. 14, 2000, p. 529-558.
-
Jiang Y. Y., Yoshimura S., Imai R., Katsura H., Yoshida T., Kato C. Quantitative evaluation of flow-induced structural vibration and noise in turbomachinery by full-scale weakly coupled simulation. Journal of Fluids and Structures, Vol. 23, 2007, p. 531-544.
-
Hren Y., Wang K., Wu D., Ru W., Tan M. Research of inner flow in a double blades pump based on openfoam. Journal of Hydrodynamics, Vol. 24, Issue 2, 2012, p. 226-234.
-
Keller J., Parrondo J., Barrio R., Fernįndez J., Blanco E. Effects of the pump-circuit acoustic coupling on the blade-passing frequency perturbations. Applied Acoustics, Vol. 76, 2014, p. 150–156.
-
Lavrentjev J., Abom M. Characterization of fluid machines as acoustic multi-port sources. Journal of Sound and Vibration, Vol. 197, Issue 1, 1996, p. 1-16.
-
Parrondo J., Pérez J., Barrio R., Gonzįlez J. A simple acoustic model to characterize the internal low frequency sound field in centrifugal pumps. Applied Acoustics, Vol. 72, 2011, p. 59-64.
-
Parrondo J. L., Fernandez J., Garcıa I., Ruiz E. Noise transmission through duct divisions in air circuits, considered as three-port acoustic systems. Journal of Sound and Vibration, Vol. 296, 2006, p. 183-194.
Cited by
About this article
Valentinas Kartašovas performed literature review, formalized and make translation of article into English language. Pranas Mažeika performed experimental tests, analyzed experimental data, formulated conclusions and made recommendations. Marius Vasylius performed experimental tests and analyzed experimental data. Vytautas Barzdaitis performed analysis of experimental tests results, formulated conclusions and made recommendations. Artūras Tadžijevas performed literature review, wrote an article, processing of experimental data.

