Abstract
This study conducted a CFD-2D coupled analysis of a suspension bridge subjected to wind loads. Previous studies found that rotational oscillation was due to differences in the restoring force at hanger cables and could generate torsional oscillations. However, due to uncertain external force terms, the previous studies could not be applied to analyze actual structures. To enable application in a real design process, this study proposed a methodology for determining the external force terms. The external force terms were determined with CFD, and a moment force term was added to equations of motion derived from dynamic equilibrium conditions. All constants and properties were calculated from an assumed cross section of superstructure. This methodology can be used not only to avoid torsional resonance but also in preliminary analysis in the bridge design stage.
1. Introduction
Among bridges, the suspension bridge has the one of the longest spans and one of the most graceful exteriors. Many suspension bridges have been built worldwide since the first suspension bridge, the Brooklyn bridge, was built in 1883. Today, a suspension bridge can have a span of more than 1,000 m. However as the span between main towers becomes longer, a suspension bridge becomes more vulnerable to wind load. To predict structural responses under wind loads, the engineers who design the bridge usually conduct wind-tunnel tests and computer simulations. However, these methods involve significant cost and time. Thus, another method for predicting bridge structure response which can save costs and time is needed.
A simple 2D analysis of wind-induced oscillations of suspension brides has been demonstrated by McKenna [1] who analyzed the Tacoma Narrows Bridge collapse, and its vertical/torsional oscillation. The day of its collapse, a vertical mode amplitude of 2 m with 38 Hz frequency was observed. In addition, a torsional mode was observed with 2 radian amplitude at 14 Hz. To investigate the collapse of the Tacoma Narrow Bridges, McKenna analyzed a suspension bridge with one rigid suspension bridge cross section and two-nonlinear hanger cables. Equations of motion were derived for each degree of freedom, and solved by a numerical method. Dool and Hogan [2] found torsional oscillation due to differences of resistances at each hanger cable. The study by McKenna and Tuama [3] became the basis of numerical analysis for suspension bridge oscillation. However, previous studies ignored the torsional resistance of the bridge cross section. So, Kim and Lee [4] provided an analysis that included the torsional resistance of the superstructure and found that a torsional resonance could be generated.
The previous model by McKenna had two degrees of freedom, and the model had two distinct natural frequencies for the vertical mode and torsional model. However, only vertical stiffness was considered in the model, without torsional stiffness. Also, the model led to unrealistic results with increasing wind speeds. Therefore, in order to identify the feasible ranges of torsional resistance of suspension bridges, this study investigated varying speeds and frequencies of wind loads which can trigger torsional resonance, as torsional resistance was changed.
Also, previous studies could not have been applied in the actual design stage due to an uncertain external force term. The external force term in previous studies consisted of magnitude coefficient, sine function and frequency coefficient, but they did not have a solid basis for why the values of the external force term coefficients were selected. Therefore, this study intends to provide a framework to simulate wind oscillation of a suspension bridge and predict dynamic responses, which can be used in a preliminary design process.
2. Numerical modeling of a suspension bridge
As shown in Fig. 1, this study modeled a suspension bridge with one rigid suspension bridge cross section and two hanger cables. Degrees of freedom of the cross section were vertical displacement (y) and rotational displacement (θ). The superstructure was assumed to be hung by hanger cables at the end of the cross section. If the force-displacement relationship of the hanger cable is linear elastic, equations of motion for the vertical and torsional displacement derived with force equilibrium are Eqs. (1) and (2) below [1]:
where, c is a damping coefficient, m is the mass of the suspension bridge superstructure, K is the stiffness of hanger cables and l is the half width of cross section. As shown in Eqs. (1) and (2), the vertical mode and torsional mode are coupled and express systems of ordinary differential equations (ODEs).
Fig. 1Degree of freedom of the numerical model
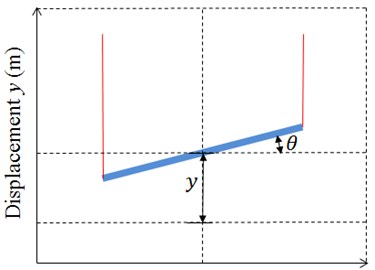
Fig. 2Hanger cable force-displacement relationship
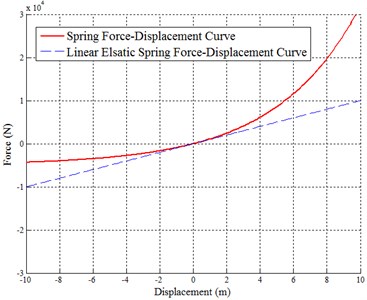
Both linear and nonlinear cable force-displacement curves are presented in Fig. 2. It is reasonable that hanger cables only resist tensions and the restoring force increases as displacements increase. Therefore, the modified hanger cable force-displacement equation is as follows:
where, α is the coefficient representing nonlinearity. As Eq. (3) is substituted into Eqs. (1) and (2) for the hanger cable stiffness term (K), the motion of equation is improved, as shown in Eqs. (4) and (5):
Eq. (6) is obtained to insert the wind speed λ and wind frequency ω:
Tuama and McKenna’s study used the external force term λsinωt. λ is 0.2 times of the wind speed. ω is the frequency of the external force, and the value used was (38/60)π. In Eq. (5), the torsional mode can only be determined by the hanger cable restoring force, however, the torsional resistance of the cross section actually exists. By inserting a torsional resistance term (KT) in Eq. (5), the torsional motion of equation becomes Eq. (7) [4]:
However, these equations cannot be applied to the actual design process because of the uncertain external force term. To determine the external force term, this study coupled a previous study and CFD (Computational Fluid Dynamics). The external force term in Eqs. (6) and (7) are substituted for the new force term calculated with CFD. Also, the section property in the motion of equations is substituted for the assumed section. Eqs. (6) and (7) are modified to (8) and (9):
where, FL(ws,θ) is a lift force on the cross section of the superstructure depending on windspeed (ws) and cross section rotational angle (θ). FM(ws,θ) is a moment force on the cross section. ws is the wind speed through the cross section of the superstructure and θ is the rotation angle of the cross section of the super structure.
A CFD domain is presented in Fig. 3. The CFD domain consists of an inlet boundary, outlet boundary, wall condition boundary and cross section boundary. Conditions of the inlet boundary were assigned with an air flow velocity of 30 km/h to 250 km/h with 10 km/h increments. The outlet boundary conditions were assigned the relative pressure ‘0’. The wall boundary conditions were assigned with no-shear stress. The reason no-shear stress was selected instead of outlet condition was to prevent a backflow calculation. If backflow occurred in the model, the solution might diverge or need more time. The cross section rotation angle was changed from –1 radian to 1 radian, with increments of 0.1 radian [5].
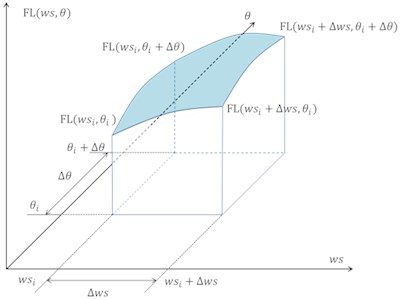
Selected analysis dimensions were 2D. This model assumed an incompressible flow because the inlet boundary velocity less than 0.3 mach [6]. So the property of air density is constant. Also, thermal/phase options were inactivated because there was no heat transfer problem. The turbulence model was selected with the standard K-epsilon model. The cross section rotational angle was changed from -1 radian to 1 radian with increments of 0.1 rad. The outlet condition was relative pressure. Upper and under wall conditions were selected with no shear stress. Furthermore, CFD analysis could not cover the entire possible area. Therefore, linear interpolation was utilized in Eqs. (10) and (11), as presented in Fig. 4. The CFD analysis was conducted with the commercial CFD program, ANSYS/FLUENT [5]:
where, wsi is the lower boundary of the CFD parameter for wind speed. θi is the lower boundary of the CFD parameter for cross section rotational angle. Δws is the increment of wind speed from the lower bound. Δθ is the increment of cross section rotational angle from the lower bound.
Fig. 3CFD analysis domain
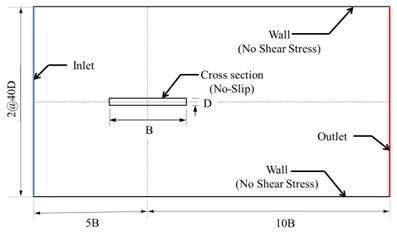
Fig. 4CFD results interpolation
The analysed suspension bridge cross section is shown in Fig. 5. Slab thickness is 300 mm, flange thickness is 30 mm and web thickness is 15 mm. Properties of the materials used are shown in Table 1.
Fig. 5Cross section dimensions

Table 1Material properties
Concrete (fck= 35 MPa) | Steel (SM 490) | |
Elastic modulus | 2.88E4 N/ mm2 | 2.05E5 N/ mm2 |
Poisson’s ratio | 0.18 | 0.3 |
Unit weight | 2.45E-5 N/ mm3 | 7.70E-5 N/ mm3 |
The hanger cable was spaced at 10 m. Material properties were referenced from the Korea Concrete Structure Design Code [7]. Calculating the composite section properties is nearly impossible by hand due to the difficulty of solving the complex integral equations. Thus, the torsional resistance factor and section properties were calculated with MIDAS/SPC, based on Finite Element Method (FEM). The mass of the suspension bridge cross section was calculated by MIDAS/SPC [8] automatically, and the torsional resistance and hanger cable stiffness were calculated by elastic relationship with Eqs. (12) and (13):
where, G is the shear modulus, E is the elastic modulus, R is the torsional resistance factor, A is the area of the hanger cable cross section, Lss is the length of 1 segment of the suspension bridge and LHC is a length of the hanger cable (10 m). The 4th order Runge-Kutta method [9] was selected for solving the ODEs. Initial values were assigned to be θ0=0.001 and other initial values were assigned ‘0’ in this study.
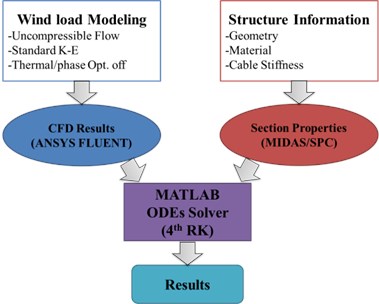
Summarizing the modeling procedure, the wind load information was input and the effect of the wind load on the structure was calculated with the CFD Solver (ANSYS FLUENT). The structure information was input and section properties calculated with MIDAS/SPC. These results were transfered to the MATLAB ODEs solver which calculated the structure response.
Fig. 6Flow of the CFD-coupled suspension bridge modeling
3. Numerical analysis results
The CFD analysis results are presented in Fig. 7. The MIDAS/SPC results are presented in Table 2. The lift force and the moment force are in proportional relation with velocity. However, the lift force and the moment force are not proportional with the cross section rotational angle. The lift force and the moment force increased as the rotational angle was changed from 0 to 0.5 rad, and reached maximum near the 0.5 radian. The absolute maximum value of lift force was 156,257 N for 1 segment of superstructure, where the wind speed was 250 km/h and cross section rotational angle was –0.2 radian. Also, the absolute maximum value of moment force was 397,025 N-m for 1 segment of superstructure, where wind speed was 250 km/h and cross section rotational angle was +0.2 radian. These results, the CFD results and the MIDAS/SPC results, were translated to the MATLAB and the structure response was calculated by CFD-Coupled differential equations.
Fig. 7CFD analysis results
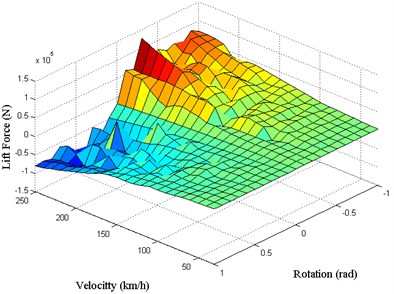
a) Lift force
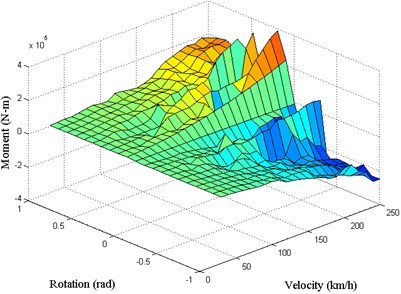
b) Moment
Table 2Section properties, calculated by MIDAS/SPC
Section property | Value |
m | 1.60E5 kg |
K | 7.02E7 N/m |
KT | 4.62E6 N/rad |
l | 12 m |
Before comparing the models, this study checked that the CFD results correctly affected structure response. Fig. 8 shows the effect of moment force and lift force on the results. In every time step, lift force and moment force were calculated and these forces were applied in the equations of motion.
Fig. 8CFD-coupled model time history results
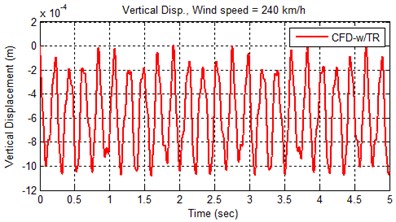
a) Vertical displacement
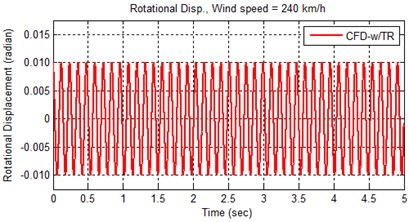
b) Rotational displacement
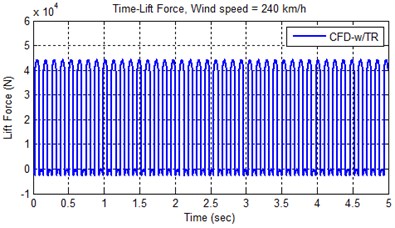
c) Lift force
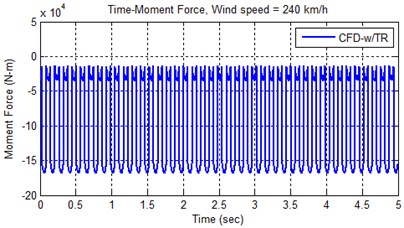
d) Moment
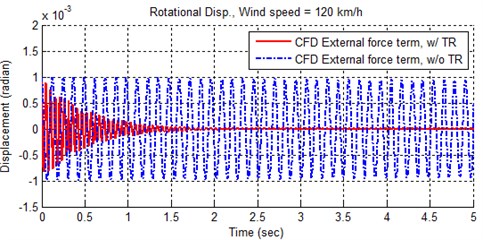
The analysis results are presented in Fig. 9. In Fig. 9, 4 cases were analyzed. Case No. 1 had a CFD-coupled external force term with torsional resistance (Eqs. (8), (9), (10) and (11)). Case No. 2 had a CFD-coupled external force term without torsional resistance (Equations (8), (9), (10) and (11)). Case No. 3 had a sine external force term with torsional resistance (Eqs. (6) and (7)). Case No. 4 had a sine external force term without torsional resistance (Eqs. (5) and (6)). Wind speed was 120 km/h.
The CFD-coupled models (Cases No. 1 and 2) in Fig. 9 show that the vertical displacement is very small compared with the sine function external force term models (amplitude is 1.0E-4 m). Also, the sine function external force term models (Cases No. 3 and 4) appear to be beat (amplitude 0.12 m). On the other hand, the rotational displacement results show that the displacement w/ torsional resistance models (Cases No. 1 and 3) was gradually reduced, and w/o torsional resistance models (Cases No. 2 and 4) it continually oscillated. Summarizing Fig. 9, the CFD-w/ torsional model could provide more favorable results to the engineer with smaller displacement.
Fig. 10 presents the oscillation movement shown in the CFD-coupled model without changing wind speed. The oscillations were generated by interaction between the structure and wind subjected to the cross section. So, with this methodology, the engineer could determine that a generated oscillation might affect the structure’s safety or serviceability.
Fig. 9Analysis results comparison

a) Vertical displacement (t: 0 to 1000 sec)

b) Rotational displacement (t: 0 to 1000 sec)

c) Vertical displacement (t: 0 to 5 sec)

d) Rotational displacement (t: 0 to 5 sec)
This is just an example. It’s important to note that this methodology has great potential for use in the design and analysis of an actual structure. Attempts have been made to apply existing methods, such as the Fluid Structure Interaction (FSI), to small structures. However FSI could not be applied to an actual structure due to lack of computational power. FSI processes need a data exchange between the CFD solver and mechanical solver due to differences in the approach methods of the solvers. However, the method demonstrated here allows the solver to calculate results at once. Utilizing the advantages of this methodology, the engineer who is concerned with wind loads could easily determine structural responses. In addition, the method allows the engineer to revise structural components during the design process, by changing the relevant coefficient, such as structure stiffness or external force characteristics.
Fig. 10Analysis results of CFD-coupled model
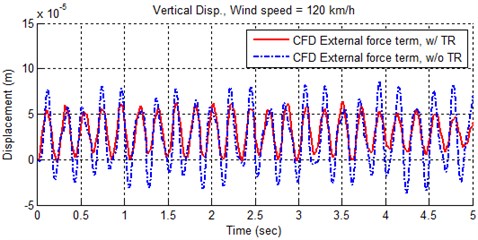
a) Vertical oscillation
b) Rotational oscillation
4. Conclusions
This study conducted a CFD-2D coupled analysis of a suspension bridge subjected to wind load. The model consisted of a suspension bridge cross section and 2 nonlinear hanger cables. Equations of motions were derived by equilibrium relationships. Contrary to previous studies, the torsional resistance of the suspension bridge was considered, and the external force term was determined by CFD analysis. Other coefficients regarding section properties were calculated by commercial FEM program. The results of the CFD and section properties were then transferred to MATLAB and the structural response was calculated by numerical method. With this methodology, the engineer is able to determine and check wind load structural responses easily.
Also, future study is needed. The results in this study show that the structural response rapidly changed in a short time. Generally, rapid change indicates the need for tight time increments. So, a future study needs to check the suitability of the time increment. In addition, a future study needs to examine the optimal CFD parametric study coverage, to avoid being too tight or coarse. This methodology could be expanded to include frequency analysis or revisions in the design stage. Future studies to investigate these improvements will be planned and conducted.
References
-
McKenna P. J. Large torsional oscillation in suspension bridges revisited: fixing an old approximation. The American Mathematical Monthly, Vol. 106, 1999, p. 1-18.
-
Doole S. H., Hogan S. J. Non-linear dynamics of the extended Lazer-McKenna bridge oscillation model. Dynamics and Stability of Systems, Vol. 15, Issue 1, 2000, p. 43-58.
-
McKenna P. J., Tuama C. Ó. Large torsional oscillations in suspension bridges visited again: vertical forcing creates torsional response. The American Mathematical Monthly, Vol. 108, 2001, p. 738-745.
-
Kim W. S., Lee J. H. Simplified 2D analysis for suspension bridges subject to wind excitation. Computational Structural Engineering Institute of Korea, Vol. 25, Issue 6, 2013, p. 463-470.
-
ANSYS, Fluent 14.5 Help, 2014.
-
Cengel Y. A., Cimbala J. M. Fluid Mechanics: Fundamentals and Applications. 2th Edition, Mcgraw Hill Education, 2009.
-
Korea Concrete Institute, Concrete Structure Design Code. Ministry of Land, Transport and Maritime Affairs, 2012, (in Korean).
-
MIDAS Information Technology Co., Civil 2012 Analysis References, 2012.
-
Sauer T. Numerical Analysis. 2nd Edition, 2012, p. 646.
About this article
This research was supported by Basic Science Research Program through the National Research Foundation of Korea (NRF) funded by the Ministry of Education, Science and Technology (NRF-2012R1A1A044378).
