Abstract
Radiofrequency ablation (RFA) is medical procedure that causes coagulation necrosis in the ablative tissue. Experts using descriptive and morphometric methods usually assess the shape of necrosis zone. However, a precise and objective assessment of necrosis zone shape requires quantitative evaluation methodology that includes computerized mathematical algorithms. One of such methods is presented in the program package “SHAPE ver.1.3”, in which quantitative evaluation of various biological contour shapes is based on principal component analysis of elliptic Fourier descriptors (EFDs). Aim of present study was elaboration of quantitative measure for complexity of the necrosis zone shape after radiofrequency ablation. We performed assessment of suitability of computer program package “SHAPE ver. 1.3” to produce valuable estimates of necrosis zone shape. Minimal yet sufficient number of principal components for optimal representation of necrosis area shape could be a quantitative measure of the shape complexity. Program package “SHAPE ver.1.3” together with proposed procedure for determination of this measure could be used for optimization of radiofrequency ablation procedures.
1. Introduction
In the clinical context, radiofrequency ablation (RFA) is a precise, minimally invasive medical procedure based on thermal tissue destruction. The tissue is ablated using the heat generated from high frequency alternating current. In our study RFA takes place at frequencies of 460-550 kHz. RFA current is delivered to the tissue via electrodes inserted percutaneously or during surgery [1]. The electromagnetic energy is converted to heat, eventually resulting in cell necrosis [2]. Character of ablation processes is similar in most biological tissues and structures. However, quantitative characteristics are very different when applying the technique in heart, liver, and other biological structures. Different applications imply different biomedical accents, different physical constants are necessary, and biological reaction of different tissues to the thermal field may also appear to be different [1]. The energy deposition during RFA is mainly determined by the electrical conductivity of tissue close to the probe [2].One of the simplest volume conductors is saline. The electrical conductivity of saline arises from the motion of free ions in response to a steady electric field, and is on the order of 1 S/m [3]. It may premise that the conductivity of a tissue differs depending on its histological appearance, as it leads to specific mollecular organization. Particular electrical conductivity determines different lesion shape caused by RFA procedure. Since liver tumor has similar conductivity at 20 kHz and 500 kHz, it was not observed any difference in lesion shape between 20 kHz and 600 kHz when the tumor had 40 mm diameter and was completely encompassing the probe. There was a significant difference for a tumor of 20 mm diameter, where part of the probe tines are protruding into normal liver. Summing up, RFA at lower frequencies may result in larger lesions, preferentially within the tumor boundaries [2].
Considering that RFA launched in the late 1970s, it has been published a lot of research papers analyzing the difference in shape of RFA induced coagulation necrosis zone as well as its dependence on various specifications. The shape of RFA induced lesion is usually assessed by using descriptive and morphometric methods. However, an assessment of the shape would be more precise if it employed quantitative evaluation methodology based on computerized mathematical algorithms. Elliptic Fourier descriptors (EFDs), proposed by Kuhl and Giardina, can delineate any type of shape with a closed two-dimensional contour and have been effectively applied to the evaluation of various biological shapes in animals and plants (Furuta et al. 1995; Iwata et al. 1998; McLellan 1993; Ohsawa et al. 1998; White et al. 1988). There are many reports showing that measurements based on EFDs are helpful for such quantization of the shapes of plant and animal organs.The shape evaluation method based on EFDs can be a powerful tool for analyzing biological shapes, but it is not easy for a researcher to use this method because it involves several complex procedures, such as image processing, contour recording, derivation of the descriptors, and multivariate analysis of the descriptors.
Program package “SHAPE ver. 1.3” provides simplified methods letting evaluate various biological shapes in quantitative manner based on elliptic Fourier descriptors. Using this package, a researcher can easily analyze shapes on a personal computer without special knowledge about the procedures related to the method [4]. The software package “SHAPE ver.1.3” is freeware. It uses digital images of histological samples in (*.bmp) format. Pixels describe the image as a function of two independent variables (, ) representing their position. Shape representation methods can be classified into two categories: region based versus contour based. In region-based techniques, all the pixels within a shape are taken into account to obtain the shape representation. Comparing with region based shape representation contour based shape representation is more popular. Contour based shape representation only exploits shape boundary information. Most shape signatures such as complex coordinates, curvature and angular representations are essentially local representations of shape features; they are sensitive to noise and not robust. Apparently, Fourier descriptors not only overcome the weak discrimination ability of the moment descriptors and the global descriptors but also overcome the noise sensitivity in the shape signature representations.These descriptors represent the shape of the object in a frequency domain. The lower frequency descriptors contain information about the general features of the shape, and the higher frequency descriptors contain information about finer details of the shape [5].
As mentioned before, EFDs have been widely used for the scientific evaluation of large-scale biological shapes such as: leaf shape [6], shape of Foraminifera's test [7], wing shape of Mosquito [8] and root shape of Japanese radish [9]. The images involved in these researches typically have definite shapes with consistent landmarks. Histological images, however, lack such landmarks and they tend to exhibit multiple highly variable shapes. As such, it is difficult to compare histological images using common techniques using common techniques such as template matching with standard image templates or using shape-based similarity measures after registration of the shapes in a histological image. Fourier descriptors, described by Kuhl and Giardina have been reported to be very useful as shape descriptors.Although, EFDs have not been widely used in the evaluation of histological samples referring to their shape-based features, Kothari et al. (2013) have recently developed an automatic histological image classification system classifying hematoxylin and eosin (H&E) stained renal tumor images by capturing the distribution of shape patterns, described by Fourier shape descriptors [10].
Aim of present study was elaboration of quantitative measure for complexity of the necrosis zone shape after radiofrequency ablation. We performed assessment of suitability of computer program package “SHAPE ver. 1.3” to produce valuable estimates of necrosis zone shape.
2. Material and methods
Experimental study was carried out on the mongrel dogs (13) as an animal model in accordance to Laboratory Animals Ethical Committee permission Nr. 0027/2001. Animals weighting between 26 and 40 kg were anesthetized with midazolam (bolus, 25 mg; infusion, 3 to 6 mg/h) and ketamine (bolus, 750 mg; infusion, 100 to 200 mg/h). Initially, after the injection of anaesthetic agents into the back of dogs’ thigh, a 15 cm skin incision was made on the right or left thigh [11]. Subsequently, the muscle was uncovered and the skin was shaped to form a cradle.
A standard 4 mm diameter tip catheter ablation electrode “Biosense Webster” (Johnson nad Johnson, USA) was used in this study. The ablation catheter was inserted into a thin pipe for irrigation. A thermocouple electrode was used to measure the temperature at the ablation site. Both ablation and thermocouple electrodes were positioned perpendicular to the thigh muscle during all the experiments. At first, the tip of the ablation electrode was driven up to the tissue surface and then it was pushed with constant weight of 10 g. Then, the thermocouple electrode tip was driven up to the tissue surface and bundled up with the ablation electrode. The cooling solution was administered to the ablation site at the rate of 16 ml/min during ablation procedure. Sodium chloride (NaCl) solution irrigation was initiated at the same moment as the RFA started and had been maintained until radiofrequency application stopped. The concentrations of NaCl cooling solutions were 0.1 % and 0.9 %. Such NaCl concentrations were chosen because of their conventional usage in clinical practice. The temperature of the cooling solutions was 20°C. The duration of RFA procedure was 30 s. Ablation power of 40 W (500 kHz) was delivered at a constant voltage mode. During the procedure, the resistance varied in the range from 110 to 210 Ω. Energy of RFA was delivered between the ablation electrode and adhesive electrosurgical dispersive pad applied to the shaved opposite side of the thigh. During each radiofrequency application, changes of impedance and temperature on tissue surface were monitored. RFA was performed in three different places on the musculus quadriceps femoris surfaces of right and left legs for each animal. In total, three various ablation sessions took place. The first experimental ablation session was done without cooling of RF ablation electrode (no cooling – NC). During the second experimental session the electrode was cooled with a 0.1 % NaCl solution (cooling with 0.1 % NaCl – C0.1) and during the third experimental session the electrode was cooled with a 0.9 % NaCl solution (cooling with 0.9 % NaCl – C0.9).
The histological specimens presenting RFA induced coagulation necrosis within the tissue were obtained and fixed with 10 % formalin. After each experimental session, all histological samples were sectioned into a number of slices. The number of sectioned slices per specimen was following: 19 slices per specimen after NC experimental session, 20 slices per specimen after C0.9 session and 23 slices per specimen after C0.1 session. Histological preparations of affected tissues were prepared in the following manner. Paraffin embedded sections were sliced with a microtome (step 0.2-0.3 mm), mounted on slides and stained with hematoxylin and eosin according to protocol described in [11]. Then, the necrosis area was identified and measured in each histological slice, as well as the relative strength and the character of the tissue damages was evaluated. Micrographs of histological preparations were taken with computerized microscope OLYMPUS BX 40, at resolution of 2080 x 1544 pixels. According to magnification factors of microscope pixel size was 3.45×3.45 μm. Micrograph image pre-processing was made using softwares “ImageJ, Microvision 1.1” and “Cell Sens Dimensions 2010”. Subsequently, micrographs of canine thigh muscle necrosis were processed by program package “Adobe Photoshop CC”: using Quick Selection Tool function the contours of shape of necrosis were marked. Then the contour of necrosis zone shape was drawn on a micrograph. Four images containing the same type contours were connected side by side into one figure. The inner areas of all the drawn contours were artificially filled with homogeneous color, which significantly differed from the background color. Lastly, digital images were processed by the computer program package “SHAPE ver.1.3” designed for the evaluation of biological shapes using EFDs.
Computer Program Package "SHAPE ver.1.3”. This package contains programs for image processing, contour recording, derivation of EFDs, principal component analysis of EFDs, and visualization of shape variations estimated by the principal components. SHAPE is characterized by the following features: (1) The packaged programs are easily operated with the aid of a graphical user interface (GUI); (2) No special computer devices for image processing are required; (3) A large number of samples (say 1,000) can be treated; (4) The scores of principal components are stored in tabbed text format files and can be easily exported for analysis by other software; and (5) The variations in shape accounted for by the principal components can be visualized and printed out. “SHAPE ver.1.3.” contains four different programs: “ChainCoder”, “Chc2Nef”, “PrinComp” and “PrinPrint” [4]. The software has to be downloaded from the website run by the developer Hiroyoshi Iwata and installed properly according to provided instructions.
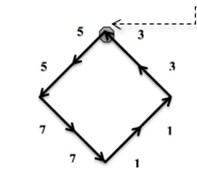
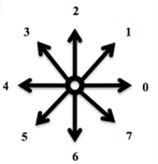
First Program: “ChainCoder”. A program named ChainCoder extracts the contours of objects from digital images and stores the relevant information as chain code (Freeman 1975) [4]. The processed micrographs of RFA induced coagulation necrosis in canine thigh muscle contain only two-dimensional shapes. Such shapes can be described into two different ways. The first method uses shape boundary and features such as boundary length, compactness. The other method is to describe shapes through the region they occupy such as areas, or skeletons. Shape features are classified into boundary features and region features [12]. The first approach for representing digital boundary was introduced by Freeman in 1961 using chain codes [12]. In digital image processing, chain codes are used to represent shape of an object in the binary image by encoding a close shape contour made of pixels. In our study, encoding of necrosis zone contour is performed in counterclockwise manner Fig. 1(a), beginning from arbitrary selected start point (reference pixel). All pixels belonging to the contour of necrosis area boundary are converted into the direction codes using 8-neighbourhood scheme Fig. 1(b). Here the change of a pixel value is based on its 8 neighbours. Each 8-neighbour can be assigned a number from 0 to 7. The sequence of such numbers (direction codes) is called a chain code, which is numerical description of a shape’s geometrical information. Details of the procedure are described in [9].
Fig. 1An example of a chain code; the reference pixel is marked by dashed arrow; in this case the chain code is 55771133
a)
b)
Noticeable, “ChainCode” can handle only full color (24-bit) bitmap (*.bmp) digital images. The scale marker (1 mm×1 mm) was included with each micrograph of RFA induced coagulation necrosis (*.bmp) making “ChainCoder” capable to measure the size of the objects. Every micrograph as a *.bmp file was opened with “ChainCoder”. The program converted every full color image to a binary (black and white image), reduced noise, automatically detected the contours of necrosis shape, traversed them and described the geometrical contour information as a chain code in a manual manner. “ChainCoder” output a chain-code (*.chc) file that is appropriate for the subsequent shape analysis using following program “Chc2Nef”.
Second Program: “Chc2Nef”. Using provided chain-code, “Chc2Nef” calculates coefficients of EFDs by the discrete Fourier transformation of chain-coded contours through the procedure proposed by Kuhl and Gardina (1982), using the formulas (Eq. (1), Eq. (2)). Briefly, the procedure is as follows. Using the chain code, a truncated Fourier series expansion of the closed-contour which is a projection on the and axes was obtained, given as:
where is the step required to traverse 1 pixel along the closed-contour, such that for code values of , within the range of and is the total number of codes describing the boundary contour. is the number of Fourier harmonics required to generate the approximation of the boundary (each harmonic has four coefficients). is the basic period of the chain code, or steps needed to traverse the entire contour, . and are the bias coefficients, corresponding to a frequency of 0. These coefficients are related to image translation and is the total number of EF harmonics needed to generate an accurate approximation of the boundary. For each harmonic, the th set of four harmonic coefficients , , and was defined [6]. Coefficients are classified into symmetric (, ) and asymmetric (, ). EFDs descriptors represent the shape of the object in a frequency domain. The lower frequency descriptors contain information about the general features of the shape, and the higher frequency descriptors contain information about finer details of the shape. In the program “Chc2Nef” the coefficients are mathematically normalized by the procedure based on the ellipse of the first harmonic (the number of harmonics used in this study was 10). After the normalization the coefficients are invariant with respect to the size, rotation, and starting point which is required if they are going to be useful for any size of shape.
Third Program: “PrinComp”. This program performs the principal component analysis (PCA) of the normalized coefficients of the EFDs. The normalized coefficients of the EFDs can still not be used directly as shape characteristics because the number of coefficients is generally very large and the morphological meaning of each coefficient is difficult to interpret separately. Principal component analysis is effective for summarizing the information of the variations contained in the coefficients [4, 8]. The main idea of PCA is to reduce the dimensionality of a data set, which consists of a large number of correlated variables. At this time, it is necessary to preserve as much as possible of the variation of original data set [13]. Therefore, “PrinComp” performed PCA enabling to minimize the excess array of numerical information and calculated effective principal components, which were significant for the shape evaluation.
Principal component analysis is based on the variance-covariance matrix of the coefficients. The variance for a variable is a measure of the dispersion of scores. Covariance indicates how two variables vary together. The variance-covariance matrix is a compact way to present data for the variables. PCA is a statistical procedure that uses orthonormal transform to convert a set of observations containing possibly correlated variables giving optimal representation in a new set of linearly uncorrelated variables called principal components. The number of principal components is less than or equal to the number of original variables. This transformation is defined in such a way that the first principal component has the largest possible variance (that is, accounts for as much of the variability in the data as possible), and each succeeding component in turn has the highest variance possible under the constraint that it be orthogonal to (i.e., uncorrelated with) the preceding components [14]. It is proven that first principal components represent deterministic signal and the last one – zero-mean noise [15]. So it is possible to construct truncated representation based on several first principal components sufficiently representing original deterministic data. The problem of determination of minimal yet sufficient number of principal components for this representation actually has no final answer. However, in many cases percentage of variance represented in the analyzed signal is quickly rising and reaching nearly 99 % when few first principal components used. In such simplest cases percentage of variance, determined by cumulative sum of eigenvalues could be used [16].
In more complicated cases method proposed by Wold, based on ratio of estimates of the original data set based not on all but the first and 1 principal components could be used (Eq. (3)) [17]:
where is calculated as following (Eq. (4)):
where is the estimate of the original data set using first m principal components; – the original data set.
Determined minimal yet sufficient number of principal components reflects complexity of the represented data set, so as more complex shape we analyze, as bigger minimal yet sufficient number of principal components we will have.
Fourth Program: “PrinPrint”. The program visualized the variation in shape that can be accounted for by each principal component. The visualization is conducted through the procedure proposed by Furuta et al. (1998). First, the coefficients of the EFDs are calculated, letting the score for a particular principal component be equal to the mean plus or minus two times the standard deviation. Then the contour shape on each condition can be reconstructed from the calculated coefficients by the inverse Fourier transformation [4]. Noticeable, the reconstructed contours can be easily printed on a sheet of paper with an ordinary printer. It proves again the simplicity of usage of the software “SHAPE ver.1.3”, as being unsophisticated program package without any special technical requirements. This visualization may be helpful for giving the morphological meaning of the variation evaluated by each principal component. In this study the reconstruction of the contour of the shape was used as the representation of all the made calculations to prove their veracity visually.
3. Results
The shapes of necrosis zone contours were classified into eight types after the thorough review of all the micrographs containing coagulation. Two types included regular geometric shapes (regular circle and regular ellipse), which were artificially drawn as the contours of ablative lesions. Remaining six types included original curves of the boundaries lining necrosis zones. The eight types of shape were labeled as regular circle, regular ellipse, circle-like shape, ellipse-like shape, irregular ellipse shape, dog-bone shape, bean-like shape and indefinite shape. Noticeable, this study includes the first subtype of indefinite shape type, which is called indefinite (1st) shape. The indefinite shape type includes the shapes that do not match any of the remaining seven types. Micrographs of histological samples containing radiofrequency induced necrosis zones on the canine thigh muscle are presented on Figs. 2, 3, 4 to illustrate each of eight types of lesion shapes; necrosis area contours are marked black; size of scale marker is 1 mm×1 mm.
After making the quantitative analysis of contours lining the necrosis areas, we obtained the following results. In the case of regular circle (Fig. 2(a)), it was ascertained that only the first principal component (eigenvalue of PC1 was 6.91E-008) was representing the major part of shape variance (Table 1). In the case of regular ellipse (Fig. 2(b)), two principal components (eigenvalues of PC1 was 1.59E-007 and of PC2 was 3.17E-009) were needed for the representation of the shape variance (Table 1).
In the case of circle-like shape (Fig. 3(a)) three principal components (eigenvalue of PC1 was 2.38E-003, of PC2 was 1.70E-003 and of PC3 was 1.24E-003) were needed for the representation of major part of shape variance (Table 1). As well, in the case of ellipse-like shape (Fig. 3(b)) three principal components (eigenvalues of PC1 was 2.35E-003, of PC2 was 1.36E-003 and of PC3 was 7.62E-004) were effective for the representation of the shape variance. For the representation of irregular ellipse shape (Fig. 3(c)) variance, also, three principal components were needed (eigenvalue of PC1 was 6.43E-003, of PC2 was 1.79E-003 and of PC3 was 1.09E-003) (Table 1).
Fig. 2Micrographs of histological samples containing radiofrequency induced necrosis zones on the canine thigh muscle. Contours lined in black are drawn artificially. Size of scale marker is 1 mm×1 mm
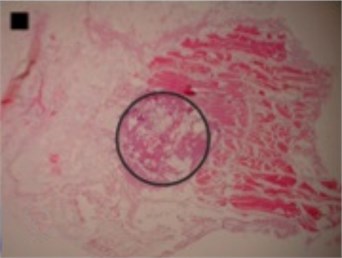
a) Regular circle
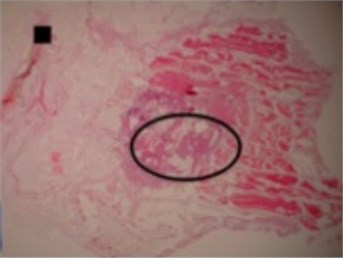
b) Regular ellipse
Fig. 3Micrographs of histological samples containing radiofrequency induced necrosis zones on the canine thigh muscle. Contours of ablative lesions are lined in black. Size of scale marker is 1 mm×1 mm
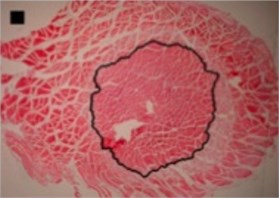
a) Circle-like shape
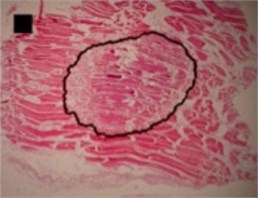
b) Ellipse-like shape
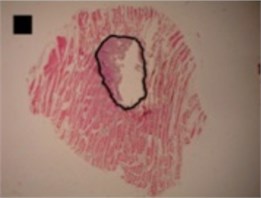
c) Irregular ellipse shape
Table 1The eigenvalues, proportions and cumulative of necrosis zone shape (regular circle, regular ellipse, circle-like shape, ellipse-like shape, irregular ellipse shape) variance by corresponding effective principal components
Type of necrosis zone shape | The eigenvalues of effective PCs | The proportions of effective PCs (%) | The cumulative of effective PCs (%) | ||||||
PC1 | PC2 | PC3 | PC1 | PC2 | PC3 | PC1 | PC2 | PC3 | |
Regular circle | 6.91E-008 | – | – | 100.00 | – | – | 100.00 | – | – |
Regular ellipse | 1.59E-007 | 3.17E-009 | – | 98.04 | 1.96 | – | 98.04 | 100.00 | – |
Circle-like shape | 2.38E-003 | 1.70E-003 | 1.24E-003 | 44.76 | 32.02 | 23.22 | 44.76 | 76.78 | 100.00 |
Ellipse-like shape | 2.35E-003 | 1.36E-003 | 7.62E-004 | 52.49 | 30.48 | 17.03 | 52.49 | 82.97 | 100.00 |
Irregular ellipse shape | 6.43E-003 | 1.79E-003 | 1.09E-003 | 69.04 | 19.25 | 11.71 | 69.04 | 88.29 | 100.00 |
Three principal components were also representing the major part of dog-bone shape (Fig. 4(a)) variance (eigenvalues of PC1 was 1.07E-002, of PC2 was 3.02E-003 and of PC3 was 1.99E-003) (Table 2), of indefinite (1st) shape (Fig. 4(b)) variance (eigenvalues of PC1 was 8.13E-003, of PC2 was 2.58E-003 and of PC3 was 1.38E-003) (Table 2) and of bean-like shape (Fig. 4(c)) variance (eigenvalues of PC1 was 1.00E-002, of PC2 was 3.57E-003 and of PC3 was 1.96E-003) (Table 2).
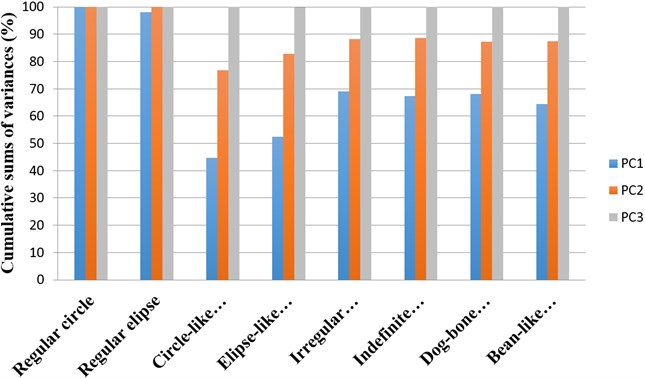
An overview of proportions of variance by corresponding effective principal components when describing different necrosis zone shapes is presented in Fig. 5. Cumulative sums of variances represented by corresponding effective principal components describing necrosis zones of different shapes are presented in Fig. 6.
Fig. 4Micrographs of histological samples containing radiofrequency induced necrosis zones on the canine thigh muscle. Contours of ablative lesions are lined in black. Size of scale marker is 1 mm×1 mm
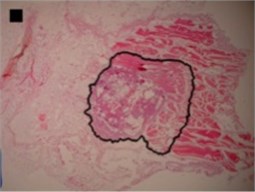
a) Dog-bone shape
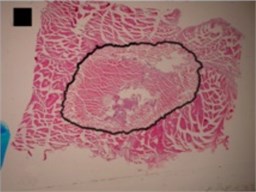
b) Indefinite (1st) shape
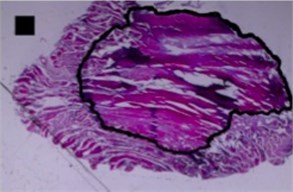
c) Bean-like shape
Table 2The eigenvalues, proportions and cumulative of necrosis zone shape (dog-bone shape, indefinite (1st) shape) variance by corresponding effective principal components
Type of necrosis zone shape | The eigenvalues of effective PCs | The proportions of effective PCs (%) | The cumulative of effective PCs (%) | ||||||
PC1 | PC2 | PC3 | PC1 | PC2 | PC3 | PC1 | PC2 | PC3 | |
Dog-bone shape | 1.07E-002 | 3.02E-003 | 1.99E-003 | 68.11 | 19.20 | 12.70 | 68.10 | 87.31 | 100.00 |
Indefinite (1st) shape | 8.13E-003 | 2.58E-003 | 1.38E-003 | 67.28 | 21.32 | 11.40 | 67.28 | 88.60 | 100.00 |
Bean-like shape | 1.00E-002 | 3.57E-003 | 1.96E-003 | 64.49 | 22.93 | 12.58 | 64.49 | 87.42 | 100.00 |
Fig. 5An overview of proportions of necrosis zones shapes variance by corresponding effective principal components
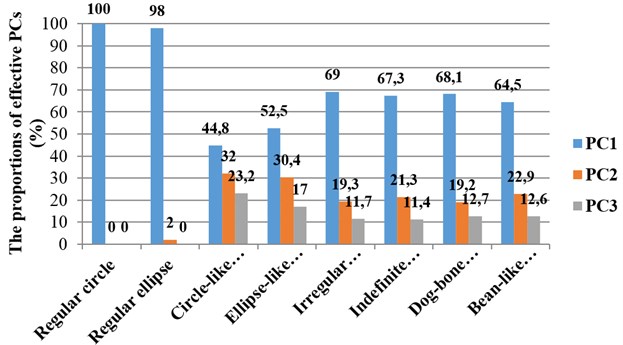
Fig. 6An overview of cumulative sums of variances represented by corresponding effective principal components describing necrosis zones of different shapes
4. Discussion
After the thorough review of all the micrographs containing coagulation necrosis induced by radiofrequency ablation on the canine thigh muscle, following the quantitative evaluation of the shapes of necrosis zone contours, we noticed that the shapes of ablative lesions do not form randomly, moreover, they have specific tendencies in shape formation. We are considering that the formation of a specific type of shape is associated with the conditions related to the ablation procedure (for example using or not cooling solutions). These sightings suggest us the hypothesis that there exists a specific nomenclature for shapes of radiofrequency ablation induced necrosis zones. However, the reasoning of this hypothesis needs further consecutive studies.
Furthermore, in all observed cases only few first eigenvalues were showing cumulative sum of nearly 100 % and there was no slow decay in their values. So simplest criteria of determining minimal yet sufficient number of principal components – cumulative sum of eigenvalues – was showing significant result. There was no need to use Wold criteria for this procedure. However this was our first attempt and more experiments on animal models are planned, so we expect more complicated cases processing data of future experiments.
5. Conclusions
Minimal yet sufficient number of principal components for optimal representation of necrosis area shape could be a quantitative measure of shape complexity. Program package “SHAPE ver.1.3” together with proposed procedure for determination of this measure could be used for optimization of radiofrequency ablation procedures.
References
-
Barauskas R., Gulbinas A., Barauskas G. Investigation of radiofrequency ablation process in liver tissue by finite element modeling and experiment. Medicina, Vol. 43, Issue 4, 2007, p. 310-325.
-
Haemmerich D., Mahvi D. M., Lee F. T. Jr., Webster J. G. RF ablation at audio frequencies preferentially targets tumor – a finite element study. Proceedings of the Second Joint EMBS/BMES Conference Houston, TX, USA, Vol. 23-26, p. 1797-1798.
-
Roth B. J. The electrical conductivity of tissues. The Biomedical Engineering Handbook: Second Edition, 2000, p. 1-13.
-
Iwata H., Ukai Y. SHAPE: a computer program package for quantitative evaluation of biological shapes based on elliptic Fourier descriptors. Journal of Heredity, Vol. 93, Issue 5, 2002, p. 384-385.
-
Zhang D., Lu G. A comparative study on shape retrieval using Fourier descriptors with different shape signatures. http://knight.temple.edu/~lakamper/courses/cis601_2008/etc/fourierShape.pdf.
-
Neto J. C., Meyer G. E., Jones D. D., Samal A. K. Plant species identification using Elliptic Fourier leaf shape analysis. Computers and Electronics in Agriculture, Vol. 50, 2006, p. 121-134.
-
MacLeod N. The centre cannot hold II: elliptic Fourier analysis. Paleo-Math 101, 2014, p. 79.
-
Rohlf F. J., Archie J. W. A comparison of Fourier methods for the description of wing shape in Mosquitoes (Diptera: Culicidae). Journal of Zoological Systematics and Evolutionary Research, Vol. 33, Issue 3, 1984, p. 302-317.
-
Iwata H., Niikura S., Matsuura S., Takano Y., Ukai Y. Evaluation of variation of root shape of Japanese radish (Raphanus sativus L.) based on image analysis using elliptic Fourier descriptors. Euphytica, Vol. 102, Issue 2, 1998, p.143-149.
-
Kothari S., Phan J. H., Young A. N., Wang M. D. Histological image classification using biologically interpretable shape-based features. BMC Medical Imaging, Vol. 13, Issue 9, 2013.
-
Vaitiekaitis G., Vitkus A., Noreika A., Balnyte I., Packevicius A., Balciuniene N., et al. Radiofrequency ablation with two sodium chloride concentrations cooling solutions and its influence on dog thigh muscle tissue damage character and size. Veterinary medicine and zootechnics, Vol. 60, Issue 82, 2012, p. 84-91.
-
Ibrahim A. A chain code approach for recognizing basic shapes. Proceedings of the 4th International Multiconference on Computer Science and Information Technology, 2006.
-
Lee C. Some methods of dimension reduction. 2006, p. 5-9, http://sas.uwaterloo.ca/~rwoldfor /students/ChangkeeLee/essay.pdf.
-
Shi Z. Evaluation study on the operation ability of urban old-age care service institutions based on Principal Component Analysis. Studies in Asian Social Science, Vol. 1, Issue 1, 2014, p. 48-54.
-
Sörnmo L., Laguna P. Bioelectrical Signal Processing in Cardiac and Neurological Applications. Academic Press, 2005.
-
Besse P., Ferre L. Sur l’usage de la validation croisée en analyse en composantes principales. Annual Review of Statistics and Its Application, Vol. 41, 1993, p. 71-76.
-
Wold S. Cross-validatory estimation of the number of components in factor and principal component models. Technometrics, Vol. 20, 1978, p. 397-405.
About this article
Darius Skaudickas – surgery, data analysis; Vincentas Veikutis – administration, surgery; RFA procedures; Aleksandras Vitkus – histology views analysis; Greta Peciulyte – technical assistance: surgery, histology preparation, data analysis; Dalia Marciulionyte – data analysis; Gintare Sakalyte – RFA procedures; Algimantas Krisciukaitis – mathematical modeling, data analysis; Gintautas Vaitiekaitis – mathematical modeling, data analysis.
