Abstract
This paper proposes the use of short-time signal processing techniques for measurements and analysis of ground vibrations. This type of signal processing is suitable e.g. for vibration analysis in the places of planned installation of vibro-sensitive machines or devices. It has been pointed out that the use of conventional measurement methods usually leads to an underestimation of paraseismic vibrations influencing machines. The idea of the short-time signal processing technique in the form of a simplified algorithm has been presented. The results of this type of analysis allow to properly determine maximal amplitudes of ground vibrations needed for assessment of their influence on devices. In addition, time-frequency maps obtained by use of the short-time Fourier transform are useful to identify sources of paraseismic excitation. Examples of results of ground vibration analysis, recorded in the place of planned installation of 3D coordinate measuring machines, have been shown.
1. Introduction
Some components of machinery and equipment (in line with designer assumptions) should be made with high dimensional accuracy of the order of a few microns. Partial or final dimensional control of medium or large-size machine elements requires usually the use of specialized measuring devices, e.g. coordinate measuring machines (CMM). It is worth noting that currently 3D coordinate measurement techniques are increasingly being used for control of a manufacturing process, e.g. machine parts, tools, molds, etc. These devices, besides the measurement of the geometry of objects, can be applied to contact or contactless (optic – using the laser head or camera system) scanning of models.
Manufacturers of measuring devices precisely define the environmental parameters that must be fulfilled while conducting measurements. Thus, the technical specifications also contain: the recommended temperature range, temperature stability or acceptable rate of its change, requirements for ventilation systems, access of sunlight (yes/no), maximal noise level and the acceptable level of ground vibration at the place of planned installation of such equipment [1].
The acceptable levels of ground vibration mainly depend on the required accuracy of the measuring machine. However, device manufacturers can define limit vibration levels in various forms such as numerical values or spectral characteristics. In the first case there are given maximum allowable vibration values (peak or rms value), determined in frequency bands strictly defined by the manufacturer of the machine. In the second case the shape of the spectral limit curve, which determines acceptable environment vibration, depends on design features of measuring machines and the results of dynamic tests that enable the detection of location of machine resonance zones in frequency domain.
Unfortunately, technical documentations of CMMs do not usually include important details about the method of measurement or analysis of signals, such as: minimal required measurement time, averaging time, averaging variant (quadratic, mean, peak-hold, exponential), type of the time windows used for the spectral analysis. Without this information the obtained measurement and analysis results can be ambiguous and they can lead to erroneous conclusions. Improper (often random) setting of the measuring or analyzing systems usually leads to an underestimation of the real influence of paraseismic vibrations transmitted through the ground to the CMM measuring machine. Underestimation of paraseismic excitation amplitudes can cause errors at the design stage of the vibro-isolation system or may lead to an erroneous premise to abandon building foundation for a CMM machine.
If the proper processing parameters are used, the short-time signal processing technique proposed in the paper is in general free from above mentioned disadvantages which occur in conventional (long-term) methods of ground vibrations measuring and analysis.
2. Proposed method of signal processing
Due to usually significantly longer averaging time, in conventional (long-term) measurements the rms value will not be adequate to identification of short-term ground excitations. The peak value indicates the highest signal value, but, on the other hand, basing on this measure it is not possible to state whether during observation the shock occurs only once or many times. Similar problems exist in the conventional spectral analysis. It should be emphasized that this type of analysis (analyzing of long signal sequence or spectra averaging) is definitely not suitable for non-stationary signals in terms of the frequency and amplitude [2].
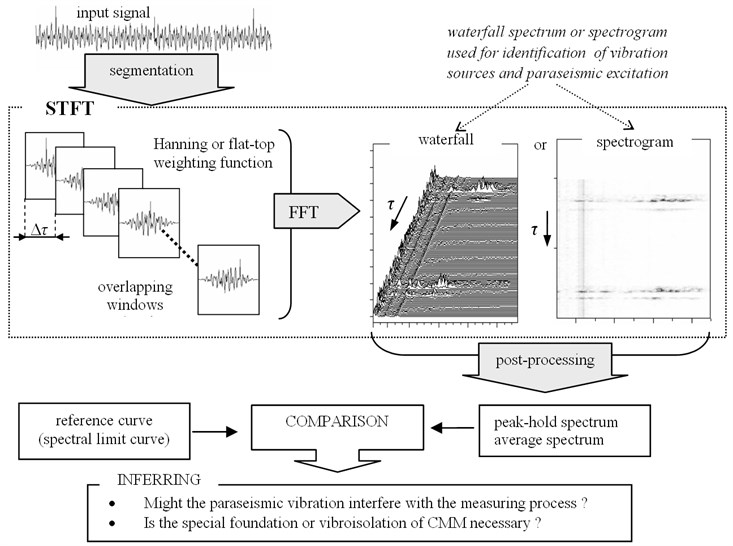
Fig. 1 shows the idea of the proposed signal processing method. Proper segmentation of the input signal into short time segments is crucial for this type method of analysis. The segmentation can be done by various types of time windows (weighting function) [3-6]. It should be pointed out that in general, the rectangular window is most suitable for signal analysis in the time domain. The frequency or time-frequency analyses require the use of other window types e.g. Hanning (for a high-selective analysis), flat-top (optimal for correct amplitude estimations), Hamming, Gauss and many others. However, the usage of the window other than rectangular entails the necessity of the overlap analysis of signal [7] segments, because the effective duration [7] of these windows is shorter than one (it is shorter than window size).
Fig. 1Simplified algorithm of short-time signal processing applied to the assessment of influence of paraseismic vibration on coordinate measuring machines

When choosing the weighting function for signal windowing before the Fourier transform (FT) [6] or short-time Fourier transform (STFT) [8], the occurrence of so called picked fence effect [7] and spectral leakage [9] should be taken in to consideration. Note that the leakage causes underestimation of spectral components amplitudes. For example, the consequence of use of the most popular Hanning window can be the underestimation of the peak value by up to 16 % [2]. The flat-top window gives correct amplitude estimation but due to low effective duration of this window type the higher overlap of signal segments should be applied. One of the disadvantages of use of the flat-top window are wide spectral lines and, in consequence, low selectivity of analysis. Some rules and recommendations concerning the choice of an optimal type, size of windows etc., have been described in [2, 10].
The short-time Fourier transform which has been used here for paraseismic signal processing is expressed as follows [8, 11]:
where: x(t) is the analysed signal, w(t,τ) is a moving time window, τ is the window position in the time domain, t is time, fis frequency.
The STFT analysis gives the result in the form of a time-frequency (TF) map which may be displayed as a 3D waterfall spectrum or 2D spectrogram [12-14]. The TF map can be used for determination of features of the time-varying excitation as well as identification of vibration sources.
Asessment of ground vibration by direct comparison of the TF map with the spectral limit curve is impossible. The post-processing of the TF map is necessary. It can be done by short-time spectra averaging. In this case, however, the short-term vibration events will be not properly represented in the averaged spectrum. This type of post-processing should be used for stationary vibrations analysis only. The peak-hold spectrum (PHS) is more suitable for vibrations evaluation and detection of their most adverse impacts on CMM. It can be obtained by searching and storing the maximum values of spectral components in all short-time spectra for each spectral frequency separately.
3. Examples of results of ground vibration analysis
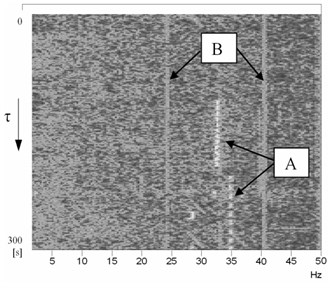
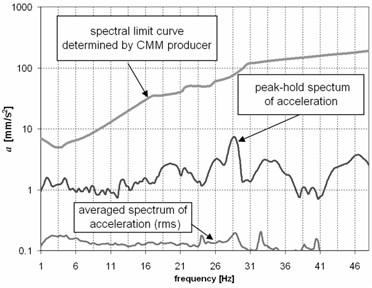
Examples of results of paraseismic signal processing recorded in the place of the planned installation of a coordinate measuring machine are presented in Fig. 2.
Fig. 2Acceleration of ground vibration in the place of the planned coordinate measuring machine installation: a) time-frequency (TF) map; b) vibration evaluation by comparison of the peak-hold spectrum with the spectral limit curve (referential curve) determined by the CMM producer

a)

b)
On the basis of the time-frequency map (Fig. 2(a)) two types of paraseismic influence can be detected: short-term periodic (A) and stationary monoharmonic (B) ground vibrations caused by the CNC machining center.
Fig. 2(b) shows the peak-hold spectrum (PHS) as a final result of the TF map post-processing. Comparing the PHS spectrum with the reference curve we can conclude that no special foundations or additional vibration isolation for the CMM machine are necessary.
4. Conclusions
The short-time signal proceessing method should be used especially to avoid loosing information about shocks and other short-term events which can occur in the paraseismic signals. In order to determine the highest vibration impacts, all potential sources of paraseismic excitation (e.g. neighboring machines and devices, local transport system etc.) should be active during the test. Recording time of vibration should be sufficiently long. It must not be shorter then the longest measuring cycle but it is better if it corresponds to the typical working day in the factory. The results of the proposed signal processing method allow also to state if any special foundations or vibroisolation of CMM are necessary.
References
-
3-Koordinaten-Messmaschine LHF 2517/LHF 3020. User Manual, Wenzel Präzision GmbH TD50.0283, 2005.
-
Barczewski R. Diagnostic Oriented Methods of Short Time Processing of Vibroacoustical Signals. Monograph No. 504, Publishing House of Poznan University of Technology, Poznan, 2013.
-
Gade S., Herlufsen H. Use of weighting functions in DFT/FFT analysis (Part I). Technical Review, 1987, p. 1-28.
-
Geckinli N., Yavuz D. Discrete Fourier Transformation and Its Applications to Power Spectra Estimation. Elsevier, Amsterdam, Oxford, New York, 1983.
-
Randal R. B. Application of B&K Equipment to Frequency Analysis. Brüel&Kjaer, Naerum, 1977.
-
Oppenheim A., Schafer R. Digital Signal Processing. Transport and Communication Publisher, Warsaw, 1979, (in Polish).
-
Gade S., Herlufsen H. Use of weighting functions in DFT/FFT analysis (Part II). Technical Review, 1987, p. 1-35.
-
Qian S., Chen D. Joint Time-Frequency Analysis: Methods and Applications. Prentice-Hall, Upper Saddle River, NJ, 1996.
-
Lyons R. Understanding Digital Signal Processing. Transport and Communication Publisher, Warsaw, 2006, (in Polish).
-
Zieliński T. Digital Signal Processing; from Theory to Applications. Transport and Communication Publisher, Warsaw, 2005.
-
Staszewski W. J., Tomlinson G. R. Local tooth fault detection in gearboxes using a moving window procedure, Mechanical Systems and Signal Processing, Vol. 11, Issue 3, 1997, p. 331-350.
-
White P. Time-frequency methods. Encyclopedia of Vibration, Elsevier, 2002, p. 1360-1369.
-
Braun S. Discover Signal Processing. Wiley, West Sussex, England, 2008.
-
Newland D. E. Practical signal analysis: Do wavelets make any difference? Proceedings of Design Engineering Technical Conference, Sacramento, California, 1997, p. 1-12.
