Abstract
In this paper we present the equations for determining the volume of the pool of peat for a set of given three-dimensional coordinates. The discrete approach is discussed and tested for additive noise also. Such an approach can be successfully applied in estimating the energy value of a pool of peat. By evaluating the sets of each adjacent points the local properties of peat can be carried out through the calculations.
1. Introduction
Potential applications of peat varies from using it as fuel to applying it as a sorbent [1, 2]. In either case one needs to find the volume of a particular peatland. And although there are techniques like 3D terrestrial laser scanning [3] which makes it easy to obtain surface coordinates it is just one of the first steps of the entire process of analysis of the pool of peat.
In order to estimate the energy value of a particular pool of peat one needs to obtain terrain data and analyze a number of samples of the peat. Samples of the peat need to be collected and their chemical composition must be determined. Usually the number of samples collected is much smaller than the necessary number of surface coordinates. Thus interpolation techniques are required to determine the chemical composition of the peat at all of the surface points.
However, in this paper we are not focusing on interpolation techniques. The set of points, where the samples of the peat are taken, is considered to be the same as the points, representing peatlend’s surface. In this sense the entire volume is defined as the set of solids.
1.1. The data and the problem
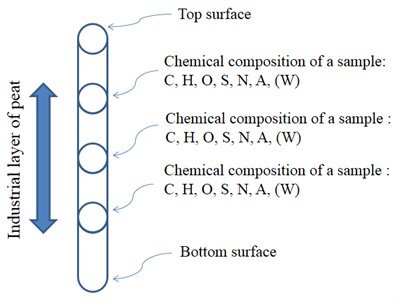
As mentioned before the analysis of stored energy value of a particular peatland starts by taking a number of samples and determining their chemical composition. Fig. 1 illustrates the schematic diagram of a bore for peat along with the information to be determined during chemical analysis of the samples.
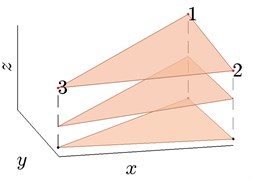
Corresponding samples are exactly one over another as bores are drilled vertically. Thus x and y coordinates will be identical for samples from one bore. Furthermore, adjacent bores form vertical prisms. If there is a constant number of n samples across all of the bores then the pool of peat consists of n-1 layers of smaller vertical prisms.
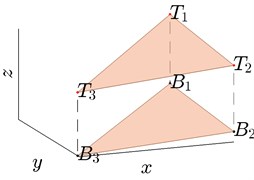
One can construct constrained triangulation from the positions of bores in peatland. We use Delaunay triangulation [4] for this. Consider the prism Pij, where i is the index of the triangle in corresponding Delaunay triangulation and j is the index of the sample. Fig. 2(b) depicts a prism like this.
The limiting points of the top plane are denoted as T1, T2 and T3. B1, B2 and B3 denotes the limiting points for the bottom plane. Thus we need 6 points in three dimensional space to represent a prism Pij:
B1=(xB1,yB1,zB1),B2=(xB2,yB2,zB2),B3=(xB3,yB3,zB3).
Fig. 1A schematic diagram of a bore and a points of sampling in a peatland
Note that in the case of vertical bores xT1=xB1, xT2=xB2, etc. Let us denote the volume of a vertical prism Pij as Vij and the energy value as Qij.
If using a particular programing language as C++ or Java, there are no built-in procedures for calculating the volume of solids. In fact finding the volume of non-regular geometry solids as sets of prisms Pij would not be an easy task for a number of mathematically oriented software. Thus by employing basic rules from vector operations and calculus we derived Eq. (2) for Vij comprising of basic arithmetical operations:
-(f1x3min3+f2x2min2+f3xmin),
where:
f2=c(d1-d3)+a(e1-e3)+b(d1e1-d3e3),
f3=c(e1-e3)+b(e21-e23)2,
g2=c(d2-d3)+a(e2-e3)+b(d2e2-d3e3),
g3=c(e2-e3)+b(e22-e23)2,
d2=yxmax-yxmidxmax-xmid,e2=yxmid-xmidd2,
d3=yxmax-yxminxmax-xmin,e3=yxmin-xmind3,
αTB=(y3-y1)(zT2-zT1-zB2+zB1)-(y2-y1)(zT3-zT1-zB3+zB1),
βTB=(x2-x1)(zT3-zT1-zB3+zB1)-(zT2-zT1-zB2+zB1)(x3-x1),
γ=(x2-x1)(y3-y1)-(y2-y1)(x3-x1).
One can easily implement Eq. (2) in a desired programming language.
Fig. 2Three adjacent bores in a) forms a prism which consists of smaller prisms as shown in b) limited by the positions of the samples of peat in each bore
a)
b)
1.2. Chemical composition and volume-to-mass ratio of peat
Peat’s chemical composition is relative to peatland location and is mostly associated with its decomposition level. Table 1 shows typical intervals for the elements in peat. The values we used in our calculations are chosen to correspond to those found in Lithuania peatlands.
Table 1Typical chemical composition of peat
The element | Typical interval in percentage | Values used in calculations, % |
Carbon, C | 48-60 | 49.2 |
Hydrogen, H | 5-6.5 | 5.8 |
Oxygen, O | 30-42 | 30 |
Sulfur, S | < 0.2 | 0.1 |
Nitrogen, N | 0.5-3 | 1.5 |
Ash, A | 4-15 | 13.4 |
Water, W | 10-80 | 40 |
The energy value in KJ (kilojoules) obtained by burning 1 kg peat-block is a function of quantity values in percentage (p) corresponding to its chemical composition as in Eq. (7). eC, eH, … denotes energetic value by mass of 1 percent element quantity for carbon, hydrogen, etc.:
The mass of peat is obtained by using volume-to-mass ratio k. It highly depends on the water level in peat. One can fix k∈[0.15; 0.24] as it corresponds to fuel ready peat. We use k=0.217.
Fig. 3A schematic diagram of a pool of peat

1.3. The geometry of peatland as a set of vertical prisms
An approximation of the geometry of a part of particular peatland in Lithuania is depicted in Fig. 3. The numbers are the indexes of the bores.
The model is obtained by MATLAB software incorporating Delaunay triangulation and a number of numerical techniques. Such discretization enables one to evaluate additional information for each prism such as its energy value, chemical composition.
1.4. Adding random noise to the data
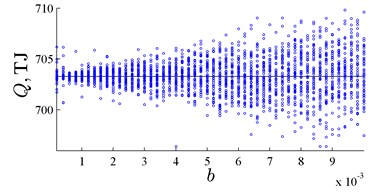
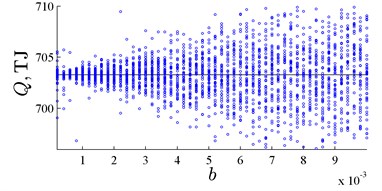
Now we discuss the effect of additive random noise in the coordinates of vertices of Pij to V and Q. Fig. 4 shows the energy value for the pool of peat depicted in Fig. 3. In each run the coordinates of vertices of Pij are perturbed by adding the value b∙u. Fig. 4(a) corresponds to u~N(0,1), i.e. Gaussian random number while in Fig. 4(b) u follows Laplace distribution with shape parameter 1 and displacement 0. Laplace distribution was chosen due to its sharp shape at the vicinity of 0 to represent more scattered perturbations.
Fig. 4Evaluated energy value Q is shown as the solid line. Small dots represents the energy value for the pool of peat if each coordinate is perturbed by b∙U. U is a random variable following Gaussian distribution in a) and a random variable of Laplace distribution in b)
a)
b)
Linear increase in the uncertainty of Q is observed as the intensity of perturbations increases. Calculations showed that the same conclusions apply to V also.
2. Conclusions
Evaluating the volume and stored energy value in separate elements (prisms) is more accurate than just multiplying typical calorific value of peat and its mass. The developed approach employs Delaunay triangulation and dividing the pool of peat into vertical prisms. As there are no standard procedures in MATLAB to find the volume of such a solid Eq. (2) comes into the model.
Linear increase in the uncertainty of values of Q and V is observed as the intensity of perturbations in the coordinates of the bores and sample positions increases. The values of chemical composition in percentage were also perturbed by techniques mentioned in section 1.4. Linear increase was spotted also but of several times lower rate.
References
-
Brown P. A., Gill S. A., Allen S. J. Metal removal from wastewater using peat. Water Research, Vol. 34, Issue 16, 2000, p. 3907-3916.
-
Ringqvist L., Holmgren A., Öborn I. Poorly humified peat as an adsorbent for metals in wastewater. Water Research, Vol. 36, Issue 9, 2002, p. 2394-2404.
-
Slob S., Hack R. 3D terrestrial laser scanning as a new field measurement and monitoring technique. Lecture Notes in Earth Sciences, Vol. 104, 2004, p. 179-189.
-
Okabe A., Boots B., Sugihara K. Spatial Tessellations: Consepts and Applications of Voronoi diagrams. New York, Wiley, 1992.
