Abstract
The article describes a concept of a non-invasive method for diagnosing the size of valve clearance in internal combustion engines, based on the analysis of engine surface vibration signals using artificial neural networks. The applicability of the method was tested on a single-cylinder compression-ignition engine with a low power rating, which had an OHV timing gear, acting indirectly on the valves, and manual adjustment of valve clearance. The method uses as diagnostic signals the readings of vibration sensors, which record the acceleration of engine head movement as a function of the angle of rotation of the crankshaft, with pre-set valve clearance values measured in a cold condition. From among the signals recorded, components corresponding to the impact of rocker arms against valve stems were identified and low-pass filtered in order to eliminate measurement interference. A classifier of selected features of the signals processed was constructed using artificial neural networks. This classifier recognizes signals generated by engines with correct valve clearance as well as those with too much and too little valve clearance.
1. Introduction
Timing gear mechanisms of internal combustion engines make wide use of cam drives of poppet valves. The popularity of this solution is not so much due to its advantages as to the lack of effective alternatives. In engines which do not reach speeds exceeding 5,500 rpm, timing gear mechanisms acting indirectly on the valves are commonly used. An indirect valve drive consists of a cam shaft, shaft bearings in the motor housing, a follower, a push rod, a rocker arm, a poppet valve with a spring, and rocker arm bearings. Due to their mass, the moving parts of the mechanism exert high loads on kinematic joints with the forces of inertia. On the other hand, an indirect drive has a relatively low stiffness, which largely depends on the length of the push rod. A timing gear mechanism, therefore, possesses its own dynamic characteristics, which manifest themselves during engine operation. These characteristics are also influenced by the so-called valve clearance.
The term valve clearance stands for the total clearance in the timing gear. In indirect drive mechanisms, the numerical value of the clearance is measured between the valve stem and the sliding surface of its mating rocker arm. The need for valve clearance is due to the changing linear dimensions of the elements of timing gear mechanisms caused by their thermal expansion. Clearance values depend on engine type, the mode of its cooling, timing gear design, and numerous other factors. Optimum valve clearances are usually determined experimentally. Calculations of valve clearances do not give reliable results because it is difficult to predict the actual temperature distributions in different parts of a running engine. The general rule is that valve clearance should be as small as possible, but still large enough for the valves to close tightly during engine operation. Excessive valve clearance can be the cause of reduced engine power (as an effect of impaired filling of the cylinder space due to the dislocation of the beginnings and ends of valve opening and closing, and as a result of a reduction in actual valve stroke), the occurrence of additional impact forces of inertia, which lead to rapid wear of the mating surfaces (especially valve faces and valve seats), resulting in an uncontrolled increase in clearance values, increasingly noisy operation of the timing gear, and valve bounce during the closing of the valves. Diagnosis of valve clearances in timing gear mechanisms of internal combustion engines, which can be carried out by vibroacoustic methods, is, therefore, critical from a practical point of view. It represents an important direction in current research, as evidenced by the significant number of articles on this topic that are published each year in scientific journals.
Information about faults in the timing gear mechanism can be obtained from vibration signals of the engine cylinder head. Measurement of these signals is relatively simple and convenient. The possibility of diagnosing the operation of the timing gear by analysing head vibration signals has been noticed and investigated by many researchers [1-6]. It has been found, among others, that these signals carry information about valve operation, excessive valve clearance, burning of valve seats, fractured valve springs, etc. [6].
2. The concept of a non-invasive method for assessing valve clearance
The primary forces affecting an internal combustion engine during operation are gas forces, the character of which is a consequence of the cyclic occurrence of combustion processes. Since the engine block provides support for all the mechanisms making up the engine, it is subjected to dynamic interactions in all kinematic pairs. The vibrations of the block are a response to the total forces acting in the places of its contact with moving parts of the engine. In the case of a prolonged period of operation under a fixed load, the vibration signal of the engine block shows a periodicity corresponding to the periodicity of the occurrence of ignitions. In particular, some components of the block’s vibrations are caused by the elements of the timing gear mechanism, whose vibrations depend on the size of valve clearance. To use the vibration of the block to assess valve clearance, components of the vibrations coming from other engine mechanisms need to be filtered off. In this case, the application of bandpass filtering does not solve the problem due to the fact that the same frequency of vibrations of the block can be forced by different elements of the engine. One of the possible solutions, which also forms the basis of the diagnostic method proposed in the present article, is time selection. It requires information on the exact moments of opening and closing of the valves. This information can be quite easily obtained, since those moments are determined by the shape and arrangement of the cams on the camshaft, while the angular position of the camshaft depends on the position of the engine crankshaft (variable valve timing is not considered here). The application of a sensor of the angular position of the crankshaft (a crank sensor) allows the separation of the moment of opening and closing of the valves from the vibration signal.
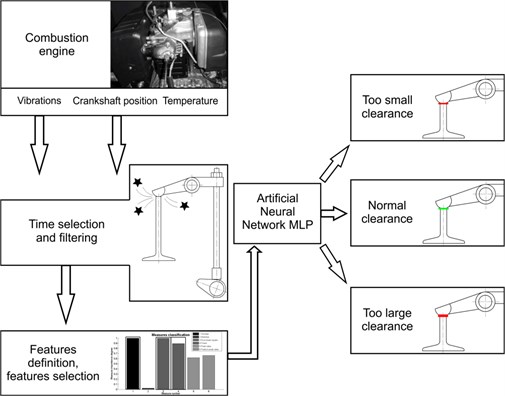
The non-invasive diagnostic method of engine valve clearance evaluation proposed by the present authors is based on these premises. The procedure involves four stages, schematically depicted in Fig. 1. In the first stage, vibration signals of the engine block are registered. The second stage consists in separating from this signal those vibrations which have been caused by opening of the valves (the rocker arm striking the valve stem) and filtering of the signal to eliminate inference. In the third stage, optimal signal features are selected (using a special selection algorithm) from among the typical features employed in technical diagnosis. The fourth stage involves classification of the signals using artificial neural networks. The present study uses for this purpose multilayer perceptron networks (MLP), whose task is to assign engine valve clearance, on the basis of the signal supplied, to one of three classes: too little clearance, correct clearance, or too much clearance.
The proposed method of diagnosing valve clearance is a comparative method. Its main limitation is that it requires the development of a database of experimental results before the actual experiments are carried out in order to find the best neural classifiers. The selection of such classifiers is preceded by training and testing procedures aimed at teaching a network to recognize specific characteristics and to empirically estimate the accuracy of recognition. These procedures require the preparation of three data sets: a training set, a test set and a validation set. The accuracy of a classification and, hence, the performance of a given neural network is determined by the ratio of the number of accurately recognized cases to the total number of cases. To use a neural network to evaluate the size of a valve clearance, first, engine vibration signals with a pre-set (known) valve clearance must be registered and the neural classifier must be taught to recognize the size of this clearance. The positively verified classifier can then be asked to evaluate vibration signals recorded in the same engine in the future, but in conditions analogous to those for the training signals. A good classifier should be able to correctly diagnose the size of valve clearance both in the engine which has been used to collect learning and training data, as well as in other engines of the same type. This would create the possibility of developing professional devices (clearance testers) dedicated to certain types of internal combustion engines (e.g., power units in cars).
Fig. 1Stages of the proposed diagnostic method for the evaluation of the size of valve clearance in an IC engine
The present diagnostic method is not an original method. It is based on the observation that the human ear is capable of recognizing (without any additional instruments) the characteristic noises generated during engine operation. In the past, engine auscultation was an effective diagnostic procedure. However, it required an experienced diagnostician – an expert who could properly recognize and interpret the sounds he or she heard by assigning them to the specific phenomena occurring in the engine. Modern methods of measuring and recording vibration signals have allowed to expand the analyzed frequency ranges beyond the audible range, while computer methods have provided new techniques for the analysis and processing of such signals. The use of neural networks for the analysis of vibration signals is, in these circumstances, quite natural, since these computer tools are simple (though astonishingly effective) simulators of the functioning of biological neural systems, including the human brain. A neural network is trained to distinguish signals (e.g., sounds) sent by a functional technical object (which can sometime generate false alarms) from the sounds made by a marginally operational object [7]. The main research goal of the present article is thus not to find whether the proposed method is correct or not, but to search for optimal ways in which it could be implemented.
When testing IC engines by vibroacoustic methods, it is important to adequately interpret complex measurement signals through the use of increasingly sophisticated processing methods [8-10]. Recent years have seen continuous development of diagnostic inference algorithms and signal processing methods [11-15], which have been successfully used in scientific research devoted to the diagnosis of internal combustion engines [16-19]. Various techniques have been employed to increase the ratio of signal to noise, such as noise reduction using the wavelet transform [4, 20-25]. The methods of artificial intelligence, mainly neural networks [1-2, 26-29], or less known methods such as recurrence plots [30, 31] are often used as inference algorithms.
The common denominator of the research results reported in scientific literature regarding the diagnosis of IC engines (including the diagnosis of timing gear mechanisms) is their purely empirical nature. To a large extent, this is due to the insufficient development of physical theories that would afford a quantitative description of the phenomena studied. The physics of phenomena, however, inevitably have to be taken into account when universal procedures for obtaining and processing vibration signals for purposes of the diagnosis of valve clearance are created. Such procedures can be effectively tested only on the basis of the results of tests of IC engines that have the simplest possible design – low-power single-cylinder engines unequipped with valve clearance self-adjusting mechanisms.
3. Bench testing
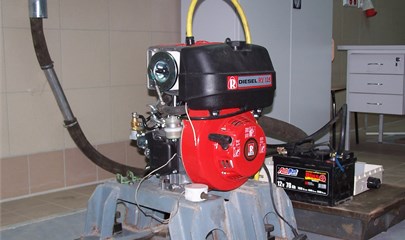
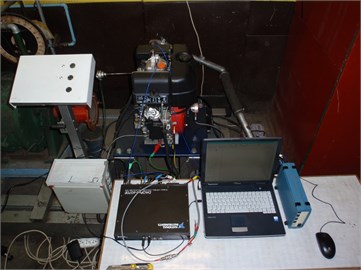
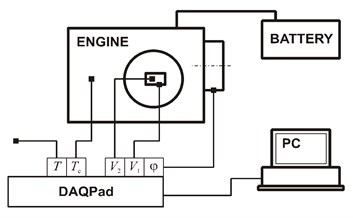
To verify the practical applicability of the proposed concept of processing of vibration signals for diagnosing IC engine valve clearance, an experiment was conducted on a test bench in the Institute of Transport, Internal Combustion Engines and Ecology of the Lublin University of Technology. The object of the study was a RUGGERINI RY125 four-stroke diesel engine (Fig. 2). The test bench was equipped with instruments for recording the acceleration of head vibrations, crank (crankshaft) angle, engine cylinder temperature, and ambient temperature. Fig. 3(a) shows a view of the test bench and Fig. 3(b) – a schematic diagram of the bench.
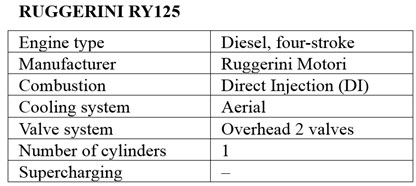
Fig. 2A RUGGERINI RY125 engine: a) a general view, b) technical description
a)
b)
Fig. 3The test bench for recording vibrations of the cylinder head of a RUGGERINI RY125 engine a) view of the bench, b) schematic diagram of the bench (DAQPad – measurement card, φ – position of the crankshaft, V1 – horizontal acceleration of engine head vibrations, V2 – vertical acceleration of engine head vibrations, Tc – temperature of the cylinder, T – ambient temperature)
a)
b)
The RUGGERINI RY125 engine is a single-cylinder unit (with a vertical cylinder) with a displacement of 0.505 dm3 (85 mm stroke, 87 mm bore), non-supercharged, air-cooled, capable of developing a rated power of 8.8 kW at 3600 rpm and a maximum torque of 31 Nm at 2000 rpm. It has an OHV timing gear mechanism with an indirect valve drive (one intake valve and one exhaust valve) and manual valve clearance adjustment. The rocker arms are double-sided and equipped with adjusting screws. The assembly valve clearances recommended by the manufacturer are the same for both valves and are 0.20 mm for a cold condition and 0.15 mm for a hot condition [32]. The basic technical specifications for the RUGGERINI RY125 engine are summarized in Table 1.
Table 1Basic technical parameters of the RUGGERINI RY125 engine [32]
Parameter | Value |
Bore×stroke | 87 mm×85 mm |
Displacement | 0.505 dm3 |
Capacity of final drive oil | 1.5 dm3 |
Nominal speed | 3600 rpm |
Compression ratio | 19:1 |
Max torque | 31 Nm at 2000 rpm |
Nominal rated power | 8.8 kW at 3600 rpm |
Capacity of fuel tank | 5.0 dm3 |
Weight of engine | 48 kg |
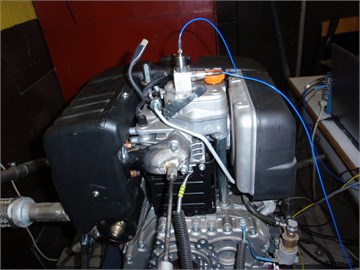
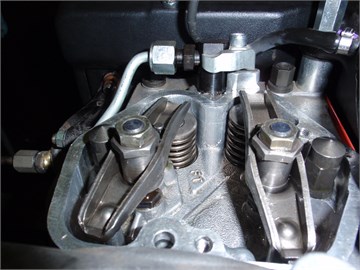
Information about the position of the engine’s crankshaft was obtained on the test bench from a Kübler incremental encoder 8.5820.1312.3600. Vibrations of the engine’s head were measured using two ICP 338B34 single-axis piezoelectric accelerometers (referred to in this article as sensor 1 and sensor 2), adhesive-mounted on the head housing, and a 482A16 PCB® PiezotronicsINC amplifier. Both sensors were mounted directly above rocker arms (Fig. 4). Sensor 1 recorded the acceleration amplitude in the horizontal direction (horizontal vibration amplitude) and sensor 2 registered the acceleration amplitude in the vertical direction (vertical vibration amplitude). The directions specified were perpendicular to the axis of the engine’s crankshaft, and the vertical direction corresponded to the direction of piston motion in the cylinder.
Fig. 4Measurement of head vibrations: a) location of the sensors, b) view of rocker arms after disassembling of the head housing
a)
b)
The temperature of the cylinder and ambient temperature were measured using TP-371 and TP-372 sensors with a single processing unit (a Pt100 platinum resistor). All measurement signals were recorded using a DAQPad-607 measurement card (16 inputs, 1.25 MS/s, 12bit, Multifunction ±5 V) from National Instruments.
To collect the data necessary for the preparation of the neural classifier, a series of horizontal and vertical engine head vibration signals were registered at three preset valve clearances: 0.15, 0.20, and 0.40 mm in a cold condition, for four cylinder temperatures of 30, 35, 40, and 45°C. Valve clearances were identical for both valves. Each measurement cycle was conducted under no-load idle conditions at a rotational speed of 1300 rpm, with the crankshaft making 200 complete revolutions. Valve clearance checks performed after each measuring cycle showed that, within the investigated range of cylinder temperatures, there was no change in valve clearance (measured using a feeler gauge with leave thicknesses increasing by 0.05 mm steps) as a result of the increase in the temperature of the head.
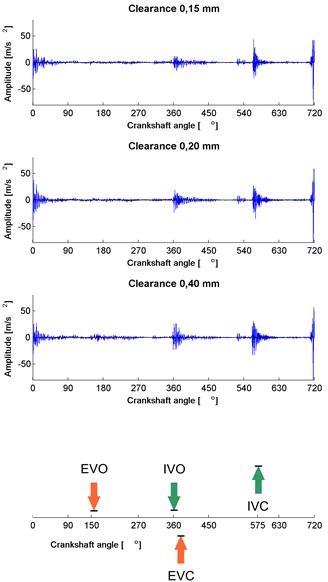
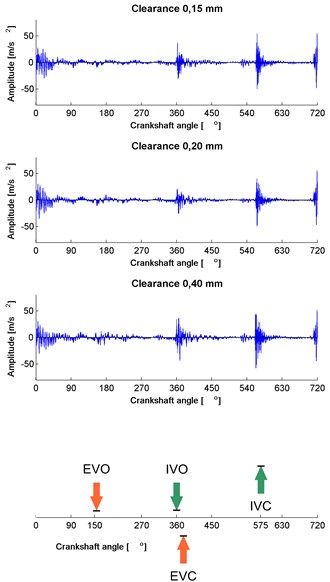
For the purposes of time selection, the positions of the engine’s crankshaft (crankshaft angles) at which the valves of the test engine started to open and close were also defined. It was measured that the exhaust (outlet) valve began to open (EVO) at the crankshaft angle of 148°±2° (the 0° angle corresponded to the top dead position (TDC) of a piston that begins its stroke) whereas intake valve opening (IVO) occurred at a crankshaft angle of 360°±2°. The moment of the close of the exhaust valve (EVC) corresponded to a crankshaft angle of 367°±2°, while the moment of intake valve closing (IVC) corresponded to a crankshaft rotation angle of 569°±2°. The positions of these points during four complete cycles of engine operation are shown in Fig. 5.
4. Processing of measurement signals of the Ruggerini RY125 engine vibrations
Before the signals recorded were processed, their waveforms as a function of crankshaft angle were analyzed. Fig. 5 shows typical acceleration waveforms of horizontal (sensor 1) and vertical (sensor 2) vibrations of the engine cylinder head at preset valve clearances of 0.15, 0.20, and 0.40 mm. For all graphs, angle 0° corresponds to the top dead center of the piston stroke. Waveforms recorded by the two sensors exhibit similar qualitative characteristics. The highest signal power is observed close to the crankshaft angles 0° and 575°. The increase in signal power in the vicinity of the 0° angle is a result of the combustion process. An analysis of the design of the engine leads to the conclusion that the increase in signal power near the angle of 575° is the result of vibrations generated by the engine supply system and, in particular, the fuel pump cam drive. These observations are consistent with reports in the literature on internal combustion engines. The increased signal power at position 360° is associated with gas exchange processes.
The graphs also show that the power of the vertical vibrations (measured with sensor 2) of the analyzed signals is significantly higher than the power of the horizontal vibrations (measured with sensor 1). It must therefore be assumed that the signal of vertical vibrations is more useful for diagnostic purposes than the horizontal signal. Since angle 575° is adjacent to the IVC point, it would be difficult to use vibrations associated with valve closing for diagnosing valve clearance because of the strong interference caused by the operation of the fuel supply system. This explains why in the present study a focus was put on isolating from the recorded signals those vibration components that were related to the opening of the two valves.
It is hypothesized in the present article that the impact of the rocker arm against the valve stem has its reflection in the vibration signal of the engine head. The value of the impulse of this impact is linearly dependent on the rotational speed of the rocker arm at the time of its contact with the valve. This speed is proportional to the linear speed of the point at which the arm contacts the push rod. The push rod performs a translational motion, the speed of which depends on the angle of rotation of the camshaft. Camshafts with conventional valve cams are characterized by a monotonic increase in the speed of follower motion (and thus the speed of push rod motion) as a function of crankshaft angle, in the initial phase of valve opening. Consequently, the speed of the push rod during the adjustment of valve clearance increases monotonically as a function of crankshaft angle, from an initial value of zero. This means that the value of the impulse of the rocker arm pushing down on the valve stem is, in the context discussed, an increasing function of valve clearance.
The design of the engine’s timing gear mechanism indicates that the direction in which this impulse acts is approximately vertical, i.e., consistent with the direction of movement of the piston in the cylinder. Because the rocker arm is bearing-mounted in the engine head (Fig. 4(b)), the impulse of the rocker arm pushing down on the valve stem triggers an impulse response of the bearing. According to (Newton’s) third law of motion, the impulse of the response of the bearing is transmitted to the head. In contrast, the impulse of the rocker arm acting on the valve stem is absorbed by the valve spring and is thus be distributed in time.
Fig. 5Typical acceleration waveforms for horizontal (sensor 1) and vertical (sensor 2) vibrations of the RUGGERINI RY125 engine head as a function of crankshaft angle for preset valve clearances of 0.15, 0.20, and 0.40 mm (registered on the test bench at an engine rotational speed of 1300 rpm) and an illustration showing the opening and closing positions of the valves (angle 0° – top dead center of the piston stroke, EVO – exhaust valve opening, IVO – intake valve opening, EVC – exhaust valve closing, IVC – intake valve closing)
a) Sensor 1
b) Sensor 2
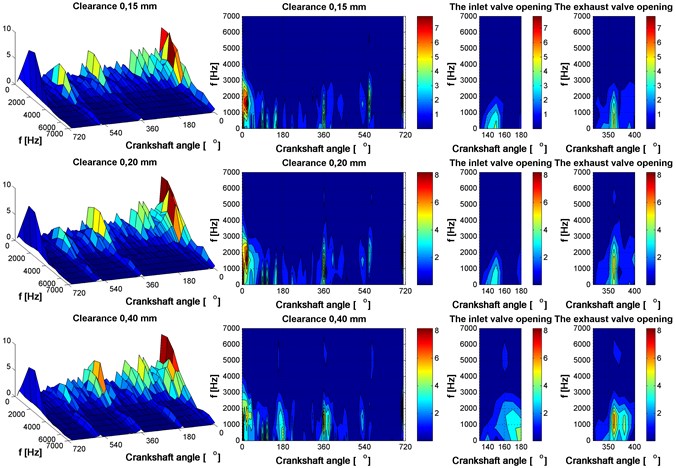
Under this reasoning, the vibration signals recorded from the head of the tested RUGGERINI RY125 engine should contain periodically occurring impulse components generated by the rocker arms striking the valve stems in the crankshaft angle ranges corresponding to EVO and IVO. This effect should be much more pronounced in the vertical vibration signal. In order to verify these assumptions, the signals obtained were analyzed in the frequency domain by performing short-time Fourier transform (STFT). The results of STFT for typical waveforms are shown in Fig. 6 (signal from sensor 1) and Fig. 7 (signal from sensor 2).
An analysis of two selected “windows” spanning the moments of opening of the two valves, seems to confirm the suggested effects in the vicinity of EVO (clear head vibration impulses registered by sensor 2, decidedly stronger for the 0.40 mm clearance, and no impulses in the signal registered by sensor 1). On the other hand, the signal in the window that includes IVO is visibly disturbed by other phenomena. Before input data for the neural network are prepared, it is necessary to both cut off and filter the signal, to remove the interference components found in the "windows". Accordingly, the signals registered on the test bench were processed by separating the vibrations caused by the rocker arms pressing down on the valve stems, and applying a low-pass filter to remove high-frequency components, which were mostly interference signals.
Fig. 6STFT analysis of the amplitude of a typical horizontal vibration acceleration signal recorded on the test bench for the RUGGERINI RY125 engine head using sensor 1 for three preset valve clearance values of 0.15, 0.20, and 0.40 mm
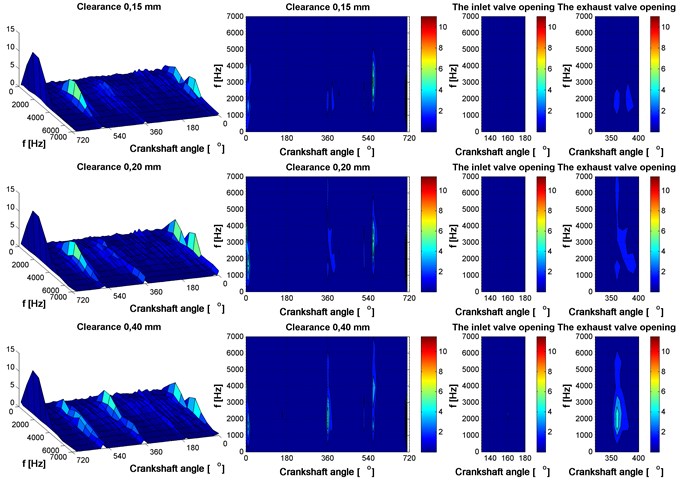
Fig. 7STFT analysis of the amplitude of a typical vertical vibration acceleration signal recorded on the test bench for the RUGGERINI RY125 engine head using sensor 2 for three preset valve clearances of 0.15, 0.20, and 0.40 mm
5. Selection of a neural classifier for the Ruggerini RY125 engine
Based on the signals processed in this manner, a set of input variables for the neural classifier of valve clearance was developed. Because different valve clearance values can cause changes in the amplitude of the vibration signal and its distribution, relevant signal features should be found by eliminating those that carry little information about the change of state. In the present study, twelve scalar signal features were tested: arithmetic mean of the absolute values of the signal, median of the absolute values of the signal, root mean square, signal power, peak value, peak-to-peak value, kurtosis, peak factor, impulse factor, clearance factor, variance and standard deviation of the sample (precise definitions of these features are given in Table 2).
Table 2Test features of the recorded vibration signal
No. | Feature | Symbol | Definition |
1) | Arithmetic mean of the absolute values of the signal | ˉxABS | ˉxABS=1N∑Nn=1|xn| |
2) | Median of the absolute values of the signal | ˜xABS | ˜xABS={|x(N+1)/2|,ifNis odd,12(|xN/2|+|xN/2+1|),ifNis even |
3) | Root mean square of the signal | xRMS | xRMS=√1N∑Nn=1x2n |
4) | Signal power | P | P=1N∑Nn=1x2n |
5) | Peak value | xmax | xmax=max{|xn|;n=1,…,N} |
6) | Peak-to-peak value | xpp | xpp=xmax-xmin |
7) | Signal kurtosis | k | k=1N∑Nn=1(xn-ˉx)4[1N∑Nn=1(xn-ˉx)2]2 |
8) | Peak factor | C | C=xmaxxRMS |
9) | Impulse factor | I | I=xmaxˉxABS |
10) | Clearance factor | L | L=xmax˜xABS |
11) | Empirical variance of the sample | s2 | s2=1N-1∑Nn=1(xn-ˉx)2 |
12) | Standard deviation of the sample | s | s=√s2=√1N-1∑Nn=1(xn-ˉx)2 |
13) | In the definitions of the features, xn stands for the value of a discrete signal at n-th measuring point, wherein n= 1,...,N, where N is the number of samples in the signal. Symbol xmin in the definition of feature (6) is the minimum absolute value of the signal: xmin=min{|xn|;n=1,…,N}. Symbol ˉx used in definitions (7), (11) and (12) represents the arithmetic mean of the signal. | ||
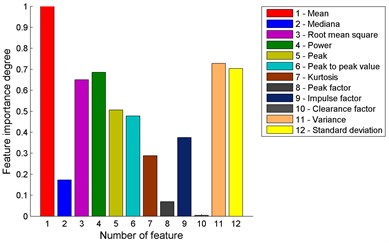
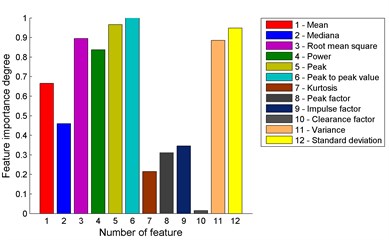
Application of a selection algorithm [33] identified seven, out of the twelve features considered, which had the highest significance levels; they included arithmetic mean of the absolute values of the signal, root mean square, signal power, peak value, peak-to-peak value, empirical variance and standard deviation of the sample (Fig. 4). An illustration of how the algorithm works is shown in Fig. 8. The value of a given feature is calculated for each of the selected vibration signals. All values from measurements taken with the same sensor are analyzed and the information about the size of valve clearance during the measurement is recorded. Then it is checked whether there is a relationship between the categories of valve clearance and feature value.
Fig. 9 shows the results of the feature selection algorithm for signals recorded using sensor 1 and sensor 2. It can be seen that in both cases, the algorithm has given priority primarily to those features that depend on signal power.
The usefulness of MLP networks for classification of valve clearance was verified using the StatSoft STATISTICA® Neural Networks module. In the case of sensor 1, when the procedure shown in Fig. 2 was followed, the classification accuracy achieved for the selected signal features was 90 % for the test data and approximately 95 % for the validation data. Better results were achieved for sensor 2, for which almost all of the cases were classified correctly (100 % and 99.25 %, respectively). The results of this classification are shown in Table 3. They confirm the hypothesis put forward earlier that the signal of vertical vibrations of the head of the RUGGERINI RY125 engine provides a better indication of the size of valve clearance than the horizontal vibration signal.
Fig. 8Example values of the tested standardized features of the processed horizontal vibration signal for the three preset valve clearance values
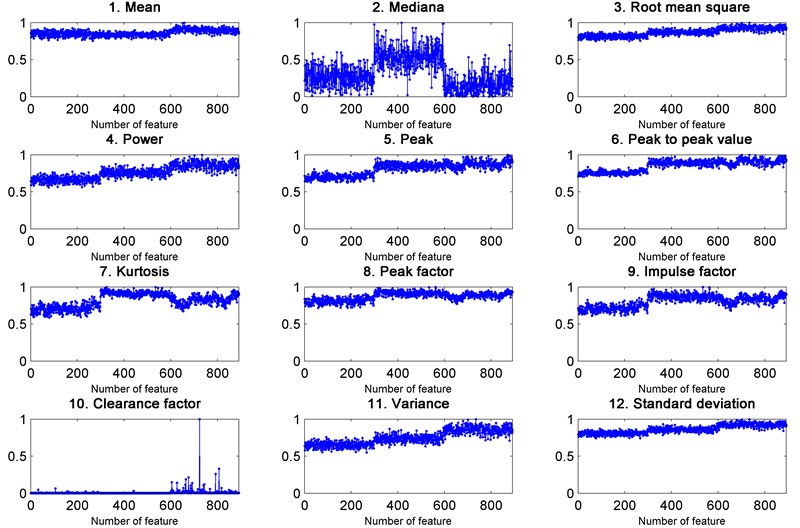
Fig. 9A bar chart of levels of significance of the investigated signal features for a) horizontal vibration sensor 1, and b) vertical vibration sensor 2
a)
b)
We also examined the possibility of classifying valve clearances in the absence of crankshaft angle data (i.e. without time selection and filtering of the signal). This experiment was conducted to verify whether it was possible to apply the method developed in this study to portable valve clearance testers for use in situations in which the measurement of an engine’s crankshaft angle is impeded. As expected, much poorer results were achieved in this case (see Table 4). For both sensors, the accuracy of classification was slightly over 80 %, which, in practice, disqualifies the procedure used.
Table 3Results of the classification of vibration signals subjected to time selection and filtration
Network characteristics | Sensor 1 | Sensor 2 |
Value / name | Value / name | |
Number of neurons in the hidden layer | 13 | 15 |
Activation function: hidden layer output layer | Hyperbolic tangent Softmax | Logistic Linear |
Accuracy of classifications for: training set test set validation set | 89.60 % 89.47 % 94.73 % | 99.68 % 100 % 99.25 % |
Table 4Results of classification of vibration signals not subjected to time selection and filtration
Network characteristics | Sensor 1 | Sensor2 |
Value / name | Value / name | |
Number of neurons in the hidden layer | 4 | 12 |
Activation function: hidden layer output layer | Linear Linear | Linear Exponential |
Accuracy of classifications for: training set test set validation set | 78.57 % 82.22 % 82.22 % | 78.09 % 80.00 % 81.11 % |
6. Conclusions
In the light of the results obtained, the valve clearance evaluation procedure for the analysis and processing of vibration signals of the head of an internal combustion engine is worthy of notice, though undoubtedly many details still need to be worked out. At the same time, there emerge a number of new research problems. Further experimental studies on a larger scale are needed which would include theoretical modelling of the physical processes taking place in the timing gear of an IC engine. Also, other signal features, filtration methods and methods of recording measurement signals should be considered, and other measurement methods (for example, using a laser vibrometer or a recorder of acoustic frequencies) should be tested. To investigate the effect of engine temperature on valve clearance values, the tests should be conducted under different conditions, with the test engine operating at a higher load and higher speeds.
References
-
Bi F., Song Z. Fault diagnosis of valve train of internal combustion engine based on the artificial neural network and support vector machine. Advanced Materials Research, Vols. 605-607, 2013, p. 729-733.
-
Czech P. Intelligent approach to valve clearance diagnostic in cars. Communications in Computer and Information Science, Vol. 395, 2013, p. 384-391.
-
Figlus T., Liščák Š. Assessment of the vibroactivity level of SI engines in stationary and non-stationary operating conditions. Journal of Vibroengineering, Vol. 16, Issue 3, 2014, p. 1349-1359.
-
Figlus T., Liščák Š., Wilk A., Łazarz B. Condition monitoring of engine timing system by using wavelet packet decomposition of an acoustic signal. Journal of Mechanical Science and Technology, Vol. 28, Issue 5, 2014, p. 1663-1671.
-
Liu S., Gu F., Ball A. Detection of engine valve faults by vibration signals measured on the cylinder head. Proceedings of the Institution of Mechanical Engineers, Vol. 220, Part D: Journal of Automobile Engineering, 2006, p. 379-386.
-
Wang C., Zhang Y., Zhong Z. Fault diagnosis for diesel valve trains based on time-frequency images. Mechanical Systems and Signal Processing, Vol. 22, 2008, p. 1981-1993.
-
Bishop C. M. Neural Networks for Pattern Recognition. Oxford University Press, 1995.
-
Charles P., Sinha J. K., Gu F., Lidstone L., Ball A. D. Detecting the crankshaft torsional vibration of diesel engines for combustion related diagnosis. Journal of Sound and Vibration, Vol. 321, Issue 3-5, 2009, p. 1171-1185.
-
Czech P.,Madej H. Applications of cepstrum and spectrum histograms of vibration engine body for setting up the clearence model of the piston-cylinder assembly for RBF neural classifier. Eksploatacja i Niezawodność – Maintenance and Reliability, Vol. 52, Issue 4, 2011, p. 15-20.
-
Liu J., Shi Y., Zhang X., Xu S., Dong L. Fuel injection system fault diagnosis based on cylinder head vibration signal. Procedia Engineering, Vol. 16, 2011, p. 218-223.
-
Antoni J., Randall R. B. Unsupervised noise cancellation for vibration signals: Part I – evaluation of adaptive algorithms. Mechanical Systems and Signal Processing, Vol. 18, 2004, p. 89-101.
-
Droździel P. The influence of the vehicle work organization conditions on the engine start-up parameters. Eksploatacja i Niezawodność – Maintenance and Reliability, Vol. 37, Issue 1, 2008, p. 72-74.
-
Fenga Z., Zuo M. J. Vibration signal models for fault diagnosis of planetary gearboxes. Journal of Sound and Vibration, Vol. 331, Issue 22, 2012, p. 4919-4939.
-
Hong L., Dhupia J. S. A time domain approach to diagnose gearbox fault based on measured vibration signals. Journal of Sound and Vibration, Vol. 333, Issue 7, 2014, p. 2164-2180.
-
Pankiewicz J., Deuszkiewicz P., Dziurdź J., Zawisza M. Modeling of powertrain system dynamic behavior with torsional vibration damper. Advanced Materials Research, Vol. 1036, 2014, p. 586-591.
-
Droździel P. Krzywonos L. The estimation of the reliability of the first daily diesel engine start-up during its operation in the vehicle. Eksploatacja i Niezawodność – Maintenance and Reliability, Vol. 41, Issue 1, 2009, p. 4-10.
-
Hunicz J., Gęca M., Rysak A., Litak G., Kordos P. Combustion timing variability in a light boosted controlled auto-ignition engine with direct fuel injection. Journal of Vibroengineering, Vol. 15, Issue 3, 2013, p. 1093-1101.
-
Kronast M. Theory and application of modal analysis in vehicle noise and vibration refinement. Vehicle Noise and Vibration Refinement, 2010, p. 117-141.
-
Łazarz B., Wojnar G., Czech P. Early fault detection of toothed gear in exploitation conditions. Eksploatacja i Niezawodność – Maintenance and Reliability, Vol. 49, Issue 1, 2011, p. 68-77.
-
Geng Z., Chen J., Hull B. Analysis of engine vibration and design of an applicable diagnosing approach. International Journal of Mechanical Sciences, Vol. 45, Issue 8, 2003, p. 1391-1410.
-
Wang Y., Zuo M., Lei Y., Fan X. Improvement of local mean approximation in empirical mode decomposition for gear fault detection. Eksploatacja i Niezawodność – Maintenance and Reliability, Vol. 48, Issue 2, 2010, p. 59-66.
-
Wu J. D., Liu C. H. An expert system for fault diagnosis in internal combustion engines using wavelet packet transform and neural network. Expert Systems with Applications, Vol. 36, Issue 3, 2009, p. 4278-4286.
-
Yen G. G., Leong W. F. Fault classification on vibration data with wavelet based feature selection scheme. ISA Transactions, Vol. 45, Issue 2, 2006, p. 141-151.
-
Czech P.,Madej H. Applications of cepstrum and spectrum histograms of vibration engine body for setting up the clearence model of the piston-cylinder assembly for RBF neural classifier. Eksploatacja i Niezawodność – Maintenance and Reliability, Vol. 52, Issue 4, 2011, p. 15-20.
-
Burdzik R. Implementation of multidimensional identification of signal characteristics in the analysis of vibration properties of an automotive vehicle’s floor panel. Eksploatacja i Niezawodnosc – Maintenance and Reliability, Vol. 16, Issue 3, 2014, p. 439-445.
-
Burdzik R., Konieczny Ł. Application of vibroacoustic methods for monitoring and control of comfort and safety of passenger cars. Solid State Phenomena, Vol. 210, 2014, p. 20-25.
-
Gajewski J., Jedliński Ł., Jonak J. Classification of wear level of mining tools with the use of fuzzy neural network. Tunnelling and Underground Space Technology, Vol. 35, 2013, p. 30-36.
-
Madej H., Czech P. Discrete wavelet transform and probabilistic neural network in IC engine fault diagnosis. Eksploatacja i Niezawodność – Maintenance and Reliability, Vol. 48, Issue 4, 2010, p. 47-54.
-
Burdzik R., Peruń G., Warczek J. Possibilities of using vibration signals for the identification of pressure level in tires with application of neural networks classification. Key Engineering Materials, Vol. 588, 2014, p. 223-231.
-
Jedliński Ł. Multi-channel registered data denoising using wavelet transform. Eksploatacja i Niezawodność – Maintenance and Reliability, Vol. 14, Issue 2, 2012, p. 145-149.
-
Syta A., Jonak J., Jedliński Ł., Litak G. Vibration of a gear box and wear effect monitoring by recurrences. Journal of Vibration and Acoustics, Vol. 134, 2012, p. 041006-1-041006-8.
-
Work Shop Manual RY125 Series Engines. First Edition, Ruggierini Motors, 2004.
-
Jedliński Ł., Jonak J. Optimum choice of signals’ features used in toothed gears’ diagnosis. Diagnostyka, Vol. 55, Issue 3, 2010, p. 9-12.
