Abstract
Vibration signal of reciprocating compressor gas valve presents a typical characteristics of non-stationarity and nonlinearity. An integration approach based on local mean decomposition (LMD) and Lempel-Ziv complexity (LZC) is proposed in this paper for improvement of diagnosis accuracy. First, the LMD method is applied to decompose original gas valve signals into a set of product functions (PFs), each of which is stationary signal. Then, the main PF components are selected by mutual information (MI) method with the original signal, and the LZC of each main PF is computed to form the feature vectors. Finally, the BP neural networks is applied to diagnose the faults of reciprocating compressor gas valve based on the feature vectors above. Experimental results indicate that the fault features of reciprocating compressor gas valve can be extracted by the integration of LMD and LZC. So the proposed approach is one of ways to achieve more accurate diagnosis of reciprocating compressor.
1. Introduction
Reciprocating compressor plays an important role in petrochemical industry, where gas valve is an essential component of reciprocating compressor. According to statistics, 60 % of reciprocating compressor failures was caused by gas valve [1]. Once it fails, considerable economy losses and serious safety problems will arise. So gas valve fault detection and diagnosis is one of important tasks in industrial maintenance. Vibration signals generated by reciprocating compressor gas valve present a multiple impulse source characteristics, which is typical non-stationary and nonlinear. Therefore, it is difficult to extract features of reciprocating compressor gas valve, effectively.
To process the non-stationary signal, modern time-frequency analysis techniques, such as wavelet transform (WT) and Hilbert-Huang transform (HHT), have been well accepted and widely applied to fault diagnosis of rotating machinery, which attracted more and more attention during the past few decades [2-3]. However, all of these techniques also present some own limitations in fault diagnosis of reciprocating machinery. In the case of WT, the appropriate base function needs to be selected in advance, which require some prior knowledge about fault mechanism. Compared with WT, HHT is a self-adaptive signal processing method that could decompose a non-stationary signal into a number of intrinsic mode functions (IMFs) based on empirical mode decomposition (EMD) [4]. By Hilbert transform, the corresponding frequency and energy distribution of signals can be obtained from IMFs. However, there still exist many deficiencies in EMD such as the end effects, mode mixing, IMF criterion and envelope line [5]. Recently, a novel self-adaptive time-frequency analysis method named LMD was first proposed by Jonathan S. Smith as an extension of EMD to process EEG perception data [6]. LMD can decompose a multi-component signal into a set of PFs, each of which is the product of an amplitude envelope (AM) signal and a frequency modulated (FM) signal. The gas valve signal of reciprocating compressor represents AM-FM feature, which is more obvious when fault occurs [7]. So it is possible to apply LMD to the fault feature extraction of reciprocating compressor gas valve. However, the corresponding time-frequency features in different gas valve states are not accurate enough. The problem is mainly focused on three concepts. Firstly, the analysis results are not stable and reliable when the number of samples increase. Secondly, the magnitude of amplitude is much different and the comparability is poor. Finally, the different noise influence the accuracy degree of result. The above problem is closely related to the nonlinear dynamics characteristics of reciprocating compressor gas valve.
The degree of nonlinearity for dynamical systems can be identified by calculating the chaotic characteristics of time series in dynamical systems, including correlation dimension, Lyapunov exponents, entropy, complexity etc. The notion of complexity is first proposed by Kolmogorov to measure the needed bit numbers for the shortest program that can produce a symbol series. Later, the specific algorithm called LZC was given by A. Lempel and J. Ziv [8]. LZC can reflect the information content for time series analysis involving nonlinear dynamics. Moreover, the normalized complexity index C of LZC can measure the nonlinear characteristics of time series [9]. Therefore, LZC can be extracted as the fault feature of reciprocating compressor gas valve.
In the paper, an integration approach based on LMD and LZC is proposed for improving the diagnosis accuracy of reciprocating compressor gas valve. The vibration signals of gas valve in four states, such as normal valve, gap valve, fractured valve and bad spring valve, are firstly decomposed by LMD into a set of PFs and a residual term. Then, the main PF components are selected by MI method with the original signal, and the LZC of each main PF components is computed to form the feature vectors. Finally, the BP neural networks is applied to diagnose the faults of reciprocating compressor gas valve based on the feature vectors above. Experimental results indicate that the fault features of reciprocating compressor gas valve can be extracted by the integration of LMD and LZC. It is therefore concluded that the proposed approach is one of the ways to achieve more accurate diagnosis of reciprocating compressor.
2. Algorithm and performance of LMD
For a given signal x(t), the LMD algorithm can be briefly described as follows [10].
1) Calculate the mean of the maximum and minimum points of each half-wave oscillation of the signal x(t):
where ni and ni+1 are two successive extremer. The local means mi are then smoothed using moving averaging to form a smoothly continuous local mean function m(t).
2) Get the local amplitude of each half-wave oscillation of the signal x(t):
The local amplitudes are smoothed in the same way as the local means to form a smoothly varying continuous envelope function a(t). Assuming that the initial envelope estimation is denoted by a11(t), and the initial mean is denoted by m11(t).
3) Subtract the local mean function m11(t) from the signal x(t):
4) h11(t) can be amplitude demodulated by the local amplitude function a11(t):
where s11(t) is frequency modulated signal. Then the envelope a12(t) of s11(t) can be calculated. If a12(t)≠1, the procedure needs to be repeated n times until a pure frequency modulated signal s1n(t) is obtained. So:
where:
5) The corresponding envelope of s1n(t) is given by:
where a1(t) is called instantaneous amplitude function, and the objective is that:
6) The instantaneous frequency function can be defined from the pure frequency modulated signal s1n(t) as:
7) Multiply s1n(t) by the envelope function a1(t) and the first product function PF1(t) of the signal x(t) can be obtained:
where PF1(t) contains the highest frequency oscillations of the signal x(t).
8) Subtract the product function PF1(t) from the signal x(t), and a new signal u1(t) can be obtained. Then the whole process above is repeated k times until uk(t) is a constant or contains no more oscillations:
Thus, the original signal x(t) can be reconstructed according to:
According to the algorithm above, LMD can extract several physically meaningful PFs and a residual term u(t), so it adapts the analysis of non-stationary signal. The PFs contain the main information of the original signal and can be used for the feature extraction.
Before applying the LMD method to fault feature extraction of reciprocating compressor gas valve, we need evaluated its performance on some non-stationary simulation signals, for which the ground truth is fully known. Time–frequency representation is best suited to non-stationary signals, since it preserves both time and frequency information. The simulation signal x(t) is taken as an example in the following:
where s(t)is a AM_FM signal. tis 2 s and sample frequency is 1000 Hz. Add a nonlinear trend d(t) to s(t), and then the investigated signal x(t) is obtained as follows:
Fig. 1Comparison of different time-frequency analysis method for x(t)
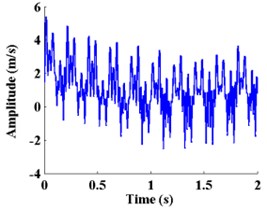
a) Time waveform
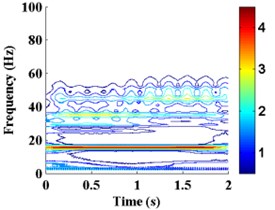
b) WT
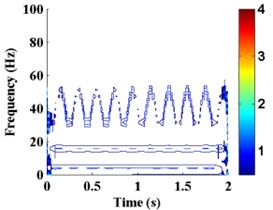
c) HHT
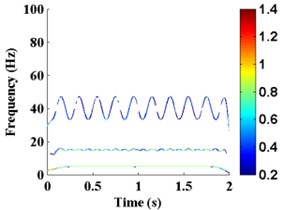
d) LMD
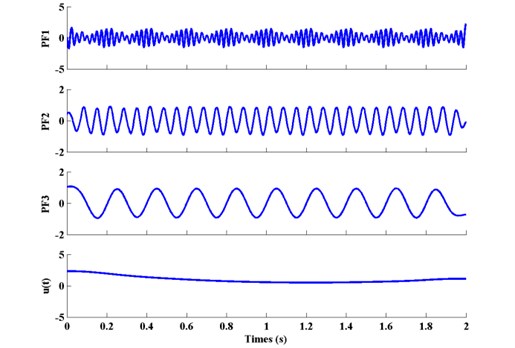
The performance comparison of WT, HHT and LMD is given in Fig. 1. It can be observed from Fig. 1(b), Fig. 1(c) and Fig. 1(d) that time-frequency feature can be extracted based on wavelet, EMD and LMD, respectively. However, the frequency resolution of wavelet is too bad and the two end effects of EMD are much serious. Compared with wavelet and EMD, LMD method can decompose the original signal more accurately in resolution capabilities and closer to the truth. The AM-FM component is a horizontal line with a periodically changed magnitude, the carrier frequency 40 Hz and modulated frequency 5 Hz can easily be identified from the first horizontal line in Fig. 1(d). In addition, the harmonic frequency 15 Hz and 5 Hz can also be extracted. Furthermore, Fig. 2 shows that the decomposition result of x(t) based on LMD. It clearly reflects the four features: PF1 represents the AM-FM signal, PF2 and PF3 represent the two harmonic signals respectively. The final components u(t) is corresponding to the trend signal d(t). The above result indicates that LMD can extract the features of non-stationary signal comprehensively.
Fig. 2Decomposition result of x(t) based on LMD
3. Algorithm and performance of LZC
LZC analysis is based on a coarse-graining of the measurements. Before the LZC measure is calculated, the time series must be transformed into a finite symbol sequence. Generally, an arbitrary time series {x(i)|i=1,2,3,…,n} is converted into a binary series. By comparison with the threshold, x(i) are converted into a 0-1 series {S(i)|i=1,2,3,…,n} as follows [11]:
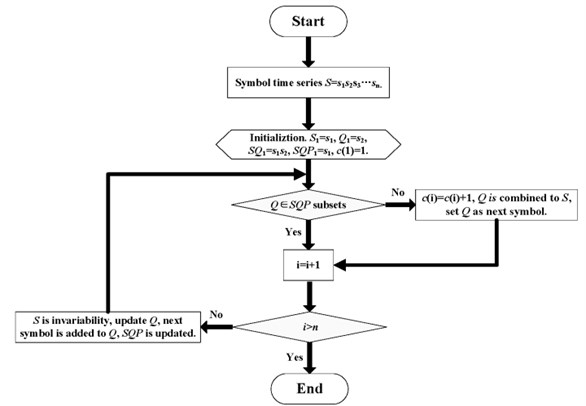
where xave is the mean of time series of x(i). Then, the LZC measure can be estimated by using the following algorithm as shown in Fig. 3.
Above algorithm is repeated until Q is the last character. The measure of complexity is c(n). In order to obtain a complexity measure which is independent of the series length, c(n) must be normalized. If the length of the sequence is n and the number of different symbols in the symbol set is 2, it has been proved that the upper bound of c(n) is given by:
and c(n) can be normalized via b(n):
where the normalized complexity index C is called Lempel-Ziv complexity.
Fig. 3The principle diagram of LZC
Obviously, Eq. (18) can be established only if the sample length n is large enough. The literature has given the experience valve n≥ 3600 [12]. The complexity index C presents the random degree of time series. For the completely random time series, C is close to 1. On the other hand, the periodic time series is close to 0. In practice, the vibration signals of reciprocating compressor vary with each fault states randomly, so the LZC can be extracted as a useful measure for machine health condition feature.
Vibration signals of reciprocating compressor are usually nonlinear, which are difficult to establish the nonlinear dynamics model for system failure. Therefor the complexity index C of signal can not be effectively obtained. To identify the effectiveness of LZC method, the typical nonlinear dynamical system are taken as an example to investigate the performance of LZC.
Consider the following Logistic map [13]:
where xn∈ [0, 1], λ∈[2.8, 4], λ is the control parameters, the step size is 0.01. The sample length of nonlinear time series is N= 5000.
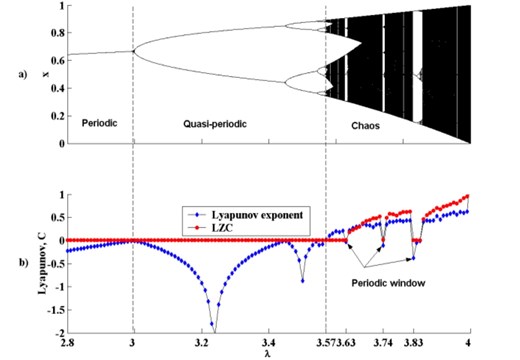
According to the LZC algorithm, the complexity index C of Logistic map with different parameters λ can be calculated. The result is shown in Fig. 4.
Observe Fig. 4(a) and Fig. 4(b), it indicates the dynamical behaviour of logistic map with different control parameters λ. The trends of lyapunov exponent and the complexity index C are much synchronous. When 2.8≤λ<3.57, lyapunov exponent is less than zero and it shows that Logistic system enters in periodic or quasi-periodic region. Moreover, most values of LZC are close to zero. When 3.57<λ≤4, lyapunov exponent is greater than zero and it indicates that the system enters chaos region. Meanwhile, the complexity index C tends to be around 0.5. During this region, lyapunov exponent less than zero including λ= 3.63, λ= 3.74 and λ= 3.83 are called periodic windows. In these regions, the complexity index C is still close to zero.
In summary, LZC can be used as indentifing the dynamical behaviour of nonlinear system effectively. The analysis results are stable and reliable when the number of samples increase.Therefore, the LZC value of different system states can be compared together without any prior knowledge about fault mechanism.
Fig. 4The Logistic map with different parameters λ: a) bifurcation diagram; b) comparison of lyapunov exponent and LZC
4. Feature extraction based on integration of LMD and LZC
According to the above instruction of LMD and LZC, non-stationary signal can be easily decomposed into stationary one by the LMD method, and nonlinear signal can be measured with a stable feature by the LZC method. Considering the non-stationarity and nonlinearity of gas valve signal, an integration approach based on LMD and LZC is proposed for improvement of diagnosis accuracy. The integration of diagnosis methods can be presented as shown Fig. 5.
Fig. 5Block diagram of the integration method based on LMD and LZC

In Fig. 5, the original gas valve signals is firstly decomposed into a set of product functions PF1, PF2,…, PFn by the LMD method, each of which is stationary signal. Secondly, the main PF components PF1, PF2,…, PFm are selected by the MI method. The definition of MI can be given as follow [13]:
where p(x), p(y) and p(x,y) are the probability density function of two random variables X, Y and the joint probability distribution of (X, Y).
MI measures the correlation degree of two signal. When they are absolute, MI value is 0. When they are fully the same, the value is 1. Then, the LZC of each main PF components is computed to form the feature vector C=[c1,c2,…,cm]. Finally, the BP neural networks is applied to diagnose the faults of reciprocating compressor gas valve based on the feature vetors above.
5. Application in fault diagnosis of reciprocating compressor gas valves
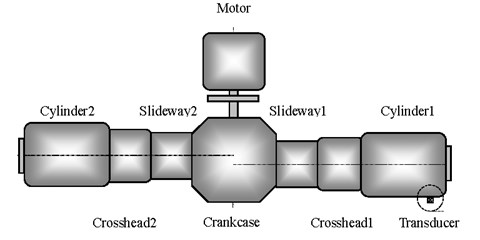
In order to verify the effectiveness of this newly proposed approach, some experiments were carried out with four types of reciprocating compressor gas valves including normal valve, gap valve, fractured valve and bad spring valve. Vibration signals were collected by vibration acceleration transducers fixed on gas valve cover. Sample frequency is 50000 Hz and sample time is 0.2 s [14, 15]. Fig. 6 shows experimental equipment of reciprocating compressor. And the components and interconnection of the test-bed installation is shown in Fig. 7. The components include the motor, the rotor-bearing system, the cylinder, the crosshead, the slideway and the crankcase.
Fig. 6Experimental equipment of reciprocating compressor
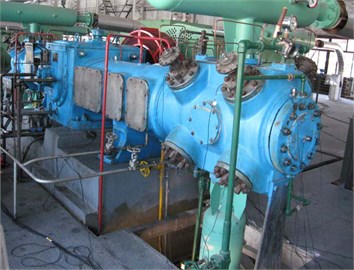
Fig. 7Structure sketch of reciprocating compressor test-bed
Time waveforms of vibration signal in four gas valve states are shown in Fig. 8. A total of 200 samples are taken for each gas valve state, of which 100 are selected as the learning data for training and the other 100 samples are taken as the testing data for diagnosing.
Fig. 8Time waveforms of gas valve in four states
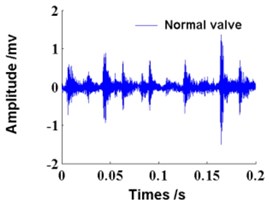
a) Normal valve
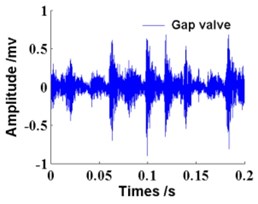
b) Gap valve
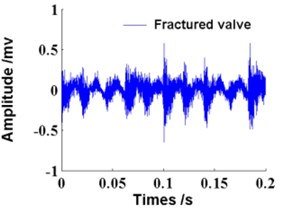
c) Fractured valve
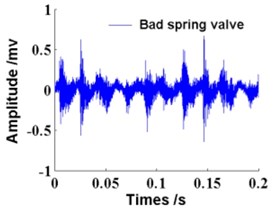
d) Bad spring valve
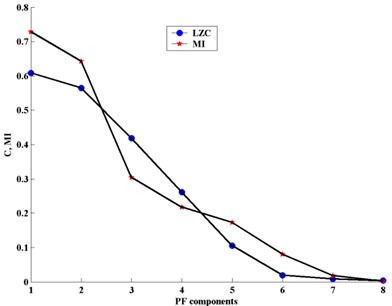
Taking the gap valve signal as an example, LMD is first used to decompose the sample signals, and then the decompostion result in gap valve state can be obtained as shown in Fig. 9. Moreover, Fig. 10 reflects the MI and LZC of each PF component. Both MI and LZC are much synchronous and decreasing with the decomposition layers. Obviously, the main information is included in the first five PF components which represent the high frequency bands of the gas valve signal. So the feature vector C=[c1,c2,c3,c4,c5] of the first five PF components are then obtained using LZC features, respectively. In addition, the wavelet energy feature and the HHT energy feature are used to verify the improvement of diagnosis accuracy for the proposed integration approach.
Fig. 9Decomposition result in gap valve states based on LMD
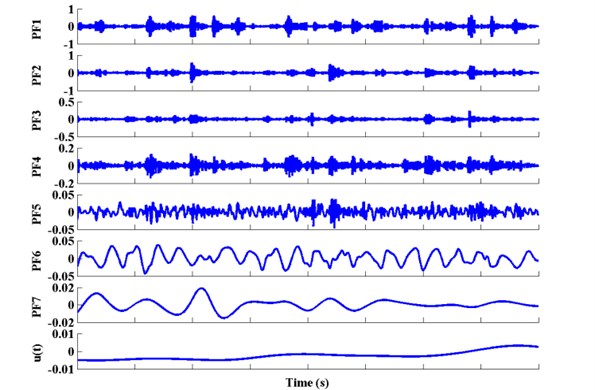
Fig. 10Comparison of MI and LZC for each PF component in gap valve state
The desirable output is vector [1, 0, 0, 0] for the neural network of training and learning when the samples of normal valve state is input. The desirable output are vectors [0, 1, 0, 0], [0, 0, 1, 0] and [0, 0, 0, 1] when fault samples of gap valve, fractured valve and bad spring valve are input respectively. The input layer node number of neural network is 15, while its output layer node number is 4. BP neural network adopts a hidden layer with 8 nodes. In order to verify the effectiveness of the proposed approach, energy features extracted by WT, HHT and LMD are also diagnosed by BP neural network for above gas valve samples. The diagnosis results are given in Table 1, it can be seen from the table that different methods have different accuracies, but the accuracy achievable through integration of LMD and LZC is the highest. The dignosis accuracy are 91.4 %, 93.1 %, 92.6 % and 94.5 % for four gas valve states, respectively. While the accuracies achievable through WT, HHT and LMD are respectively improved in turn. Therefor, it is testified that the integration of LMD and LZC can be used to effectively improve fault diagnosis accuracy of reciprocating compressor gas valve.
Table 1Fault diagnosis results of reciprocating compressor gas valve
Gas valve states | Diagnosis accuracy (%) | ||||
No. | Name | By WT | By HHT | By LMD | By integration of LMD and LZC |
1 | Normal | 82.4 | 83.7 | 85.3 | 91.4 |
2 | Gap | 84.8 | 85.1 | 88.7 | 93.1 |
3 | Fractured | 83.5 | 84.2 | 86.5 | 92.6 |
4 | Bad spring | 86.1 | 87.3 | 90.2 | 94.5 |
6. Conclusions
An integration approach based on LMD and LZC is proposed for the improvement of diagnosis accuracy for reciprocating compressor gas valve. LMD method can effectively alleviate the non-stationarity of signal. The stable and reliable LZC feature can be used for indentifying the dynamical behavior of nonlinear system without any prior knowledge about fault mechanism. In this study, the feature vectors are established by integrating LMD and LZC method, wavelet energy, HHT energy and LMD energy, respectively. The BP neural networks is applied to diagnose the faults of reciprocating compressor gas valve based on the feature vetors above. Experimental results indicate that the fault features of gas valve can be extracted by the integration of LMD and LZC. It is therefore concluded that the proposed approach is one of the ways to achieve more accurate diagnosis of reciprocating compressor gas valve.
References
-
Ma J., Jiang Z. N., Gao J. J. Feature extraction method based on chaotic fractal theory and its application in fault diagnosis of gas valves. Journal of Vibration and Shock, Vol. 31, Issue 19, 2012, p. 26-30.
-
Kankar P. K., Sharma S. C., Harsha S. P. Rolling element bearing fault diagnosis using autocorrelation and continuous wavelet transform. Journal of Vibration and Control, Vol. 7, Issue 14, 2011, p. 2081-2094.
-
Wu T. Y., Chen J. C., Wang C. C. Characterization of gear faults in variable rotating speed using Hilbert-Huang Transform and instantaneous dimensionless frequency normalization. Mechanical Systems and Signal Processing, Vol. 18, Issue 30, 2012, p. 103-122.
-
Wu T. Y., Hong H. C., Chung Y. L. A looseness identification approach for rotating machinery based on post-processing of ensemble empirical mode decomposition and autoregressive modeling. Journal of Vibration and Control, Vol. 18, Issue 6, 2012, p. 796-807.
-
Qin S. R., Zhong Y. M. A new envelope algorithm of Hilbert–Huang transform. Mechanical Systems and Signal Processing, Vol. 20, Issue 8, 2006, p. 1941-1952.
-
Smith J. S. The local mean decomposition and its application to EEG perception data. Journal of the Royal Society Interface, Vol. 2, Issue 5, 2005, p. 443-454.
-
Long J. Q., Zhou S. J., Yu P. Experimental investigation of vibration and noise control of reciprocating compressors. Advanced Materials Research, Vol. 443, 2012, p. 837-842.
-
Lempel A., Ziv J. On the complexity of finite sequences. IEEE Transactions on Information Theory, Vol. 22, Issue 1, 1976, p. 75-81.
-
Tang Y. F., Liu S. L., Jiang R. H., Liu Y. H. Correlation between detrended fluctuation analysis and the Lempel-Ziv complexity in nonlinear time series analysis. Chinese Physics B, Vol. 22, Issue 3, 2012, p. 030504.1-030504.9.
-
Wang Y. X., He Z. J., Xiang J. W., Zi Y. Y. Application of local mean decomposition to the surveillance and diagnostics of low-speed helical gearbox. Mechanism and Machine Theory, Vol. 47, Issue 1, 2012, p. 62-73.
-
Hong H. B., Liang M. Fault severity assessment for rolling element bearings using the Lempel-Ziv complexity and continuous wavelet transform. Journal of Sound and Vibration, Vol. 320, Issue 1, 2009, p. 452-468.
-
Hou W., Feng G. L., Dong W. J. Investigation about the Lorenz model and Logistic equation based on the complexity. Acta Physica Sinica, Vol. 54, Issue 8, 2005, p. 3940-3946.
-
Garvey S. D., Penny J. E. T., Friswell M. I. Quantifying the correlation between measured and computed mode shapes. Journal of Vibration and control, Vol. 2, Issue 2, 1996, p. 123-144.
-
Tang Y. F., Liu S. L., Liu Y. H., Jiang R. H. Fault diagnosis based on nonlinear complexity measure for reciprocating compressor. Journal of Mechanical Engineering, Vol. 48, Issue 3, 1976, p. 102-107.
-
Tang Y. F., Liu S. L. Time-frequency feature extraction from multiple impulse source signal of reciprocating compressor based on local frequency. Journal of Vibroengineering, Vol. 15, Issue 2, 2013, p. 574-587.
About this article
This work in this is supported by National Natural Science Foundation of China (Grant No. 51175316) and Heilongjiang Province Natural Science Foundation of China (Grant No. QC2014C045).
