Abstract
Aircraft shimmy, a dynamic instability phenomenon of the landing gear has been a problem for over half a century. It is important to predict and control nose landing gear shimmy effectively in aircraft design phase. Simulation with typical cases is a better way compared to the tests on real aircraft to investigate early stage design and give modification suggestions at a reasonable cost .In this paper, the simulation for a certain type of aircraft is presented based on actual data. In the rigid-flexible coupling model of aircraft, non-linear factors are considered, such as airframe flexibility, steering clearance and tire parameters. The model is checked with test results of static and modal experiments and proved with sufficient accuracy. Figures of stable region are presented, formed by taxing speed and critical anti-shimmy damping coefficient. Accordingly, details of shimmy criterion are discussed and effects of factors mentioned above are studied. The result shows that self-alignment torque coefficient, relaxation length of tire, and steering clearance of nose landing gear affect critical damping coefficient significantly.
1. Introduction
Vibration in ground maneuver, especially shimmy occasion, is always an important safety problem for civil aircraft [1]. This safety initiative has spurred an increasing interest in improving landing gear design to minimize shimmy [2-4]. Modern aircraft tends to use slender fuselages that frequently arise from the stretching of existing aircraft, and new light-weight materials that influence the vibrational properties of fuselage and wings [5]. Therefore, with the increasingly flexible structural design, shimmy of aircraft is still a problem to be studied.
The mechanism of shimmy is so complex that numerous non-linear factors, such as tires and clearance of structures, might contribute to shimmy differently [6-9]. Linear analysis based on custom program is widely used in traditional methods, with which the stability is evaluated by the distribution of equation roots in complex plane [1] which cannot reveal the effects of coupling non-linear factors as well as motivate the dynamics essence of shimmy [10]. Additionally, numerical methods are developed to explore the non-linear shimmy system [11]. Scholars such as P. D. Khapane and Matthew S. Schmidt started using commercial software, such as CATDADS and SIMPACK, to research into aircraft ground maneuvers dynamics [12-16].
In this paper, a methodological research is introduced based on shimmy problem of certain type of airliner. A multi-body dynamics model was established and then examined on the platform of the commercial software named LMS Virtual lab (VL), with actual data considering the flexibility of Nose Landing Gear (NLG) and airframe considered. The criterion of shimmy and effects of nonlinear parameters were studied. Also, the influence of steering clearance was studied on typical parameters of shimmy oscillation.
2. Modeling landing gear system
In the section, a typical model of shimmy analysis is developed based on the data of some type of airliner as well as its ground test environment. Only key steps are introduced and more details were presented in Reference [17].
2.1. Mathematical theories in modeling
Obviously, a landing gear is a typical multi-body system. Theories of modeling such a system in VL are based on multi-body system dynamics.
In shimmy analysis, the flexibility of landing gear components is an important factor, or even the premise of shimmy occasion. Therefore, the simulation of a dynamic system containing various flexible parts is to be explained.
2.1.1. Multi-rigid-body system dynamics theory
In VL, with Lagrange multiplier method applied, kinetic equations of a multi-body system are given as:
where is Jacobian matrix of constraint equations, is mass matrix, is Lagrange multiplier, is acceleration, is external force, and is second derivative term in acceleration equation.
The motion of each rigid body is described by seven generalized coordinates, . Among them, euler quaternion, , is applied to describe attitude of each body to avoid singular matrix. Also, system kinetic equations are highly sparse differential-algebraic ones because of dependent coordinates, and the efficient solving method of sparse matrix is suitable for kinetic equations [18].
2.1.2. Modal synthesis of substructure
Modal synthesis of substructure (MSS) is applied to deal with the flexibility of system component. The whole system was divided into several substructures firstly. Then each substructure with Finite Element Method (FEM) was analyzed. Craig-Bampton Method, used as a typical application of MSS, is introduced as follows. Kinetic equation of each flexible component is given as:
where is mass matrix of substructure, is damp matrix, is stiffness matrix, is external force matrix, is physical coordinate matrix, and are independent generalized coordinate matrices with or without correction in Craig-Bampton method analysis.
According to interface connection conditions, dependent coordinates are eliminated among the whole system. A set of independent coordinates, formed by substructures coordinates, is sufficient to describe the motion of the whole dynamic system. During the calculation, explicit algorithm is applied to solve the force Jacobian matrix in order to accelerate the computation. Backward Differentiation Formulae method (BDF) is prior in integration and Prediction-Correction method (PECE) is applied when calculation doesn’t converge [18].
2.2. Landing gear as a multibody system
The sketch and schematic of NLG simulated are shown in Figure 1 and Figure 2 as a multi-body system. In VL, this system is represented by body elements such as main fitting, the shock tube, cuff and torque links, respectively. The shock absorbers (oleo) are located between the shock tube and main fitting. All landing gears have one translational degree and one rotational degree of freedom for the shock absorber, which is simulated by the cylindrical joint in rigid modeling process. The other joints are applied as the actual connections.
Fig. 1Sketch of NLG
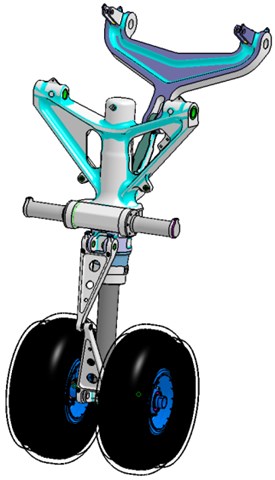
Fig. 2Schematic of NLG
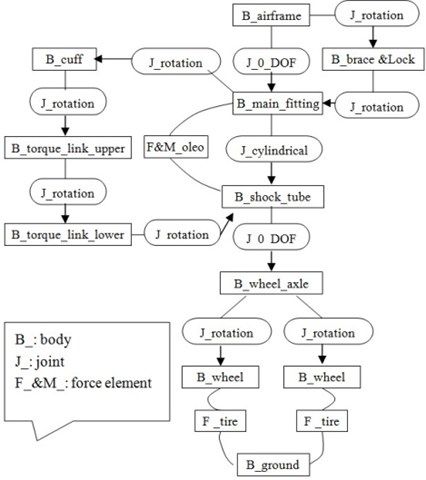
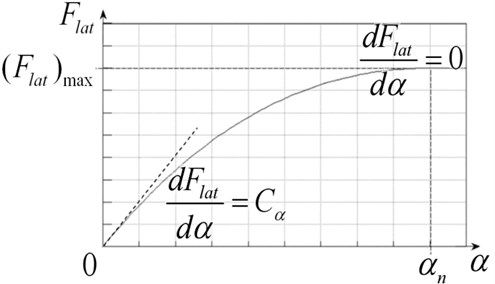
Fig. 3The relationship of tyre lateral force and slip angle
There exists one difference with modeling of the main landing gears (MLG). There is no cuff in the system and steering freedom of MLG is applied with the special device between upper and lower torque links. Besides of the rotational degree of freedom, there is a relatively small distance allowed in the direction of the rotation axis at the so-called connecting point of two torque links which is simulated with the “bracket joint”. In VL, “bracket joint” also allows definition of each DOF constrained or not, of which 1st to 3rd DOF means translational ones and 4th to 6th means rotational ones.
With the original CATIA models of the aircraft landing gears, it is accurate enough to model the landing gear system and leads to no error in mapping landing gears.
2.3. Tyre model
It is acknowledged that tyre model plays an important part in shimmy. The tyre model used in this study is based on Moreland’s point contact theory [3]. Lateral, normal and longitudinal forces of tyre are taken into consideration. The most interesting lateral force [8], is taken as an example, to introduce how forces are calculated in the tyre model.
Lateral force is computed as a function of normal force and slip angle analogous to the longitudinal force computation with rotational slip. It is approximated by a cubic polynomial determined from the following boundary conditions:
When:
where, is the slip angle, is the saturated slip angle, is the force in the lateral direction, is the maximum lateral side force, and is the value known as Cornering Stiffness.
This relationship can be seen in Figure 3.
Slip angle is defined as the angle between the tire center heading vector and the tire velocity vector projected in the terrain tangent plane. Since the slip angle is always acute, the sign of the slip angle is dependent on the sign of the lateral velocity component of tire center. This definition alleviates the need for logic to account for a change in direction of the tire. Thus, the slip angle is:
where is the forward velocity of vehicle, is the lateral velocity component of tire center, and is a small number to prevent division by zero when vehicle comes to rests, equaling to gravity/400 (about an inch/sec). The scale factor helps prevent stiffness of the equations at small lateral velocity.
The saturated slip angle is approximated by:
The maximum lateral force is the nominal friction coefficient times the normal force expressed as:
where is the nominal friction coefficient.
Due to limited space, normal and longitudinal forces are not introduced in the paper.
2.4. Shimmy damper
Shimmy damper is widely used in controlling shimmy physically [1, 6].
Damping moment is applied between the main fitting and cuff to avoid shimmy vibration in the NLG model. It is assumed that damping moment is directly proportional to the relative rotational velocity, or the square [6] of the relative rotational velocity of the main fitting and shock tube in shimmy analysis:
or
where is the anti-swing damping moment, is the relative rotational velocity and is damping coefficient.
The relative coefficient of damping is called linear coefficient and squared coefficient in two conditions. Each damping moment is applied separately in different simulation, and figures of typical physical parameters of shimmy are given to be studied.
There exists steering degree of freedom in MLG, that there allows a small translational distance along the direction of rotation axis at the “connecting point” between upper and lower torque links. The inner strut is described in Figure 4. Likewise, a shimmy damping () and spring force () is applied instead of moment, as is shown in Figure 5. The damping part varies with the velocity of the distance, presenting a smooth curve, while spring part varies with the distance, presenting a piecewise linear curve.
Fig. 4Schematic diagram of inner trut allowing MLG steering device
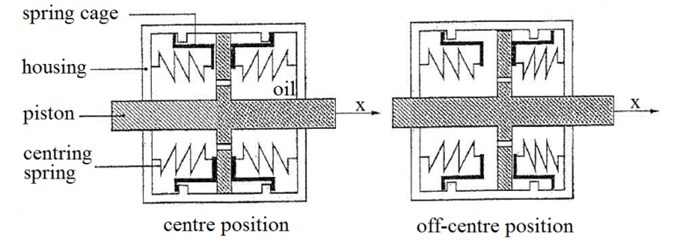
Fig. 5Curves of spring and damper force in MLG turning
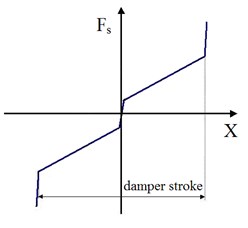
(a) Spring force
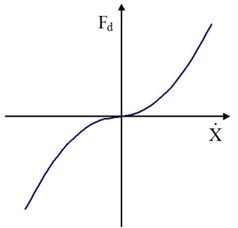
(b) Damping force
2.5. Modeling flexible landing gears and airframe
The difficulty in modeling flexible NLG is how to describe the kinematic relation of main fitting and shock tube effectively and succinctly. Herein, the coincidence of some point in one part’s axis and axis of the other part instead of the contact are considered. In other words, vertex top of piston is restricted along the axis of mainstay, and similarly vertex bottom of mainstay is restricted along the axis of piston. The approach is realistic, that non-axial forces of shock observer applied are centralized at bearings installed on the top of shock tube and bottom of mainstay. The two axes formed by fold lines of connecting points are no longer straight.
Specific steps are described as following. Two sets of hard points are defined in fem models of both mainstay and piston along the axes, and then each set of points are connected into a fold line. In the whole simulation, the hard point at the bottom of the main fitting is restricted along the fold line defined in the tube, and the hard point at the top of the tube is restricted along the fold line defined in the main fitting. With the stroke changing, non-axial forces are transferred from the hard point at the bottom of the mainstay to the inner side of the piston through the fold line defined in piston. It is important that points defined in the axes are connected to the mesh nodes in the surfaces by means of Rbe3 element, therefore no added stiffness is added [18] in modeling the shock observer. FEM models of the main fitting and shock tube defined above are shown in Figure 6.
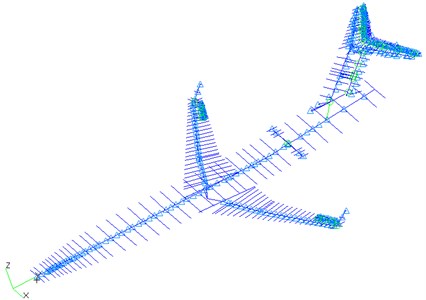
The fem model of airframe given by aircraft manufacture describes the beam and rod elements of the airframe, shown in Figure 7.
It is noted that one weight is added at the center of aircraft gravity to maintain aircraft mass and moment of inertia, for the FEM model given merely describes the airframe.
Fig. 6FEM models of flexible main fitting and shock tube
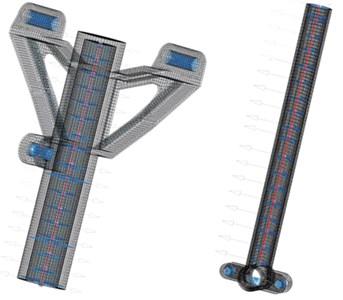
Fig. 7FEM model of airframe
2.6. Steering clearance
Clearance is one of the most important non-linear parameters in aircraft shimmy analysis [9, 20-21]. In the section, clearance of steering freedom of NLG is considered into modeling. Other clearances are still in progress and beyond the scope of this study.
The steering clearance is defined as following: damping moment is enabled if torsion angle is bigger than , and is disabled if it is smaller than . The certain value is the just steering clearance in the article. The damping moment applied is described as followings:
where is damping moment, is torsion angle, is damping coefficient, and is steering rotational velocity. is unit step function.
2.7. Checking NLG model
In the work, data of actual experiments provided by landing gears manufacture are used to check the model.
2.7.1. Comparison of static experiment
Actual static experiment follows these steps:
(a) Hang NLG off the ground at the connecting points of NLG and airframe.
(b) Then deflate gas off shock observer totally, and inject proper hydraulic fluid so as to get to the appointed strokes.
(c) Finally, apply a constant load at the axle of NLG in some direction.
(d) After NLG is balanced, displacement of the axle center in each direction is obtained with the help of displacement sensor.
Based on the model of NLG, the same boundary conditions are applied in simulation as in actual static experiment. Simulation results are compared with actual test results to check the model.
There exist displacements in different directions with stroke equaling to 155 mm, 282 mm and 345 mm. Data of 345 mm is chosen, for stroke in balance is measured as 346 mm when aircraft slides.
Table 1Comparison of simulation and test results of static experiment
Simulation result / (mm) | Test result / (mm) | Error / (%) | |
Lateral displacement | 9.0 | 9.3 | –3.23 |
Longitudinal displacement | 17.3 | 17.9 | –3.36 |
As shown in Table 1, errors in lateral and longitudinal displacement of simulation are only about –3.23 % and –3.36 %, which proves the sufficient precision of modeling.
2.7.2. Comparison of modal experiment
Similarly, same or similar boundary conditions are the key point with actual modal experiment.
Actual experiment follows these steps.
(a) Hang NLG off the ground at the connecting points of NLG and airframe, with accelerometers fixed inside of wheel axle.
(b) Then deflate gas off shock observer totally, and inject proper hydraulic fluid to get to the appointed strokes.
(c) Finally, apply external excitation on NLG, and modals of NLG are obtained based on response obtained from the accelerometers.
In the simulation, boundary conditions satisfying appointed strokes are different from actual experiment, because it is convenient to apply a force in the direction up of the shock observer at the center of the wheel axle without adding any devices which may affect the modals of NLG. The method is closer to reality due to invariable performance of shock observer.
After boundary conditions applied, run calculation of “static analysis type” with “linearization element” enabled in VL. This function is to run the following steps semi-automatically [18].
(a) Firstly, calculate the time when the whole NLG system gets statically balanced and the balanced state.
(b) And then linearize the dynamic equations of system to get the state equations and complex modals of the system.
(c) Finally, compare the shapes and frequencies of modals with test result to check the model.
As shown in Figure 8, it is easy to recognize different modals of dynamics system. Simulation and test results are listed in Table 2 for comparison. Frequencies of all modals got in simulation are more than test results of all strokes to different extent, except for the frequency of 1st longitudinal modal with stroke equaling to 200 mm. Errors are all less than 10 %, which demonstrates the accuracy of the modeling. The error may result from different boundary conditions between the simulation and actual experiment, as well as the omission of non-bearing structures such as lightening device and extending-retracting mechanism.
The two experiments prove the sufficient precision of the NLG modeling to be used in shimmy analysis.
Fig. 8Animation of landing gear modal
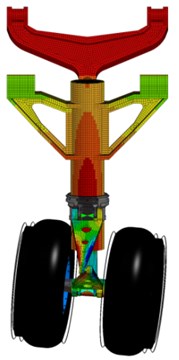
(a) 1st Torsion modal
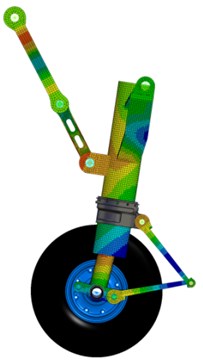
(b) 1st Longitudinal modal
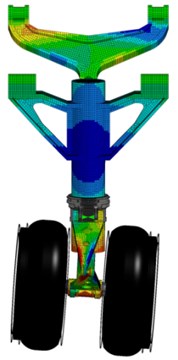
(c) 1st Lateral modal
Table 2Comparison of simulation and test results of modal experiment
Stroke (mm) | 0 | 200 | 350 | |
Frequency of 1st lateral modal (Hz) | Simulation | 32.45 | 41.90 | 49.16 |
Test | 29.62 | 38.75 | 47.86 | |
Error (%) | +9.55 | +8.13 | +2.72 | |
Frequency of 1st longitudinal modal (Hz) | Simulation | 27.83 | 33.27 | 38.84 |
Test | 25.51 | 33.31 | 37.97 | |
Error (%) | +9.09 | –0.12 | +2.29 | |
Frequency of 1st torsion modal (Hz) | Simulation | 48.45 | 51.09 | 54.63 |
Test | 48.03 | 49.91 | 53.17 | |
Error (%) | +0.87 | +2.36 | +2.75 | |
2.8. Road and excitation
According to the requirement of actual shimmy experiment, aircraft is set to travel along the runway at constant speeds, and to cross the appointed barrier fixed to the runway so that the initial excitation is applied to create an initial torsion angle of NLG.
Fig. 9Shape of the barrier
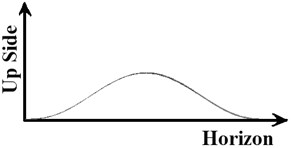
(a) Side view
(b) Top view
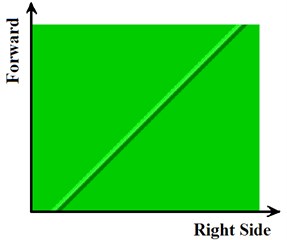
As shown in Figure 9(a), the cross section of the barrier is in the shape of cosine expression. The height of the barrier is described as:
where is the height, is width of the cosine expression, equaling to 150 mm, and is height coefficient and can be verified to change the height of the barrier according to different cases. is the coordinate along the longitudinal direction.
As shown in Figure 9 (b), the pointed barrier is fixed on the runway with the angle of 45° to the center line. To avoid double excitations applied to both tires, only the left tire of NLG is set to cross the barrier.
3. Criterion of shimmy
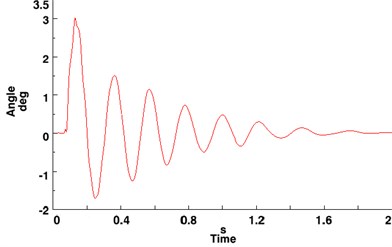
An explicit and unambiguous criterion is needed to distinguish stable cases from others in shimmy vibration. Based on references [22], the critical condition of shimmy is defined as: the amplitude after three vibration periods since initial excitation applied, is one forth of the initial amplitude caused by initial excitation. The anti-shimmy damping moment and coefficient are defined as the critical damping moment and critical damping coefficient.
3.1. Criterion for sustaining oscillation
Let’s see how the rule works with linear damping moment applied in simulation and without steering clearance considered.
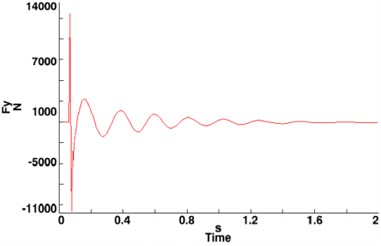
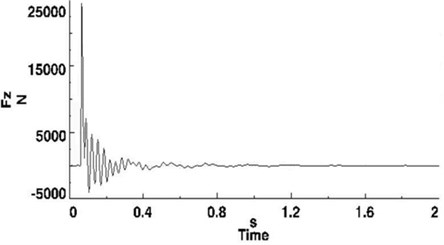
The curve of NLG torsion angles changes with time and presents a sustaining course of attenuation vibration until total dissipation since the initial excitation, as well as those of NLG tire lateral and vertical forces, as shown in Figure 10. In other words, the effect of excitation is reduced with time.
Fig. 10Curves of typical parameters with linear damper applied and no steering clearance
(a) Torsion angle of NLG
(b) Lateral force of NLG tire
(c) Vertical force of NLG tire
More cases were simulated to test effect of initial excitation defined above at different speeds. The operation is to vary height coefficient and linear damping coefficient to get critical damping coefficient defined above with different initial amplitudes caused by initial excitation, which is called “initial amplitude” below for short.
Curves are shown in Figure 11, formed by forward speed and critical damping coefficient of different initial amplitudes. Area above the curves is stable for shimmy, whereas area below is not. With initial amplitude increasing from 2° to 6°, critical damping coefficient changes little at all speeds. The difference is only 1.58 % on average and no more than 3 % except the maximum is 3.03 % at all speeds.
Fig. 11Linear damping coefficient of different initial amplitudes without steering clearance
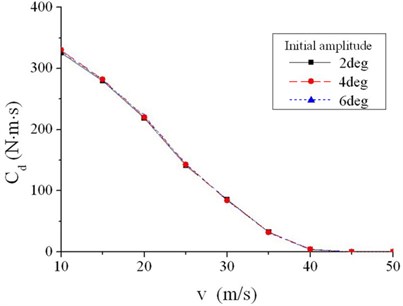
Fig. 12Squared damping coefficient of different initial amplitudes without steering clearance
In conclusion, the effect of initial amplitude defined in references [22] is little and can be neglected in shimmy analysis. Any value between 2° to 6° is acceptable. However, the actual value is not allowed to be too large, and 3° is chosen as the standard initial amplitude based on suggestions of files given by aircraft manufacture.
It is also summarized from Figure 11, with forward speed increasing from 10 m/s, critical damping coefficient decreases gradually. When the aircraft runs at a speed above 42 m/s, it is safe and away from shimmy even without any anti-shimmy damping moment applied.
3.2. Criterion for quasi-undamped oscillation
The same work was done with squared damping moment applied instead, and also no steering clearance is considered.
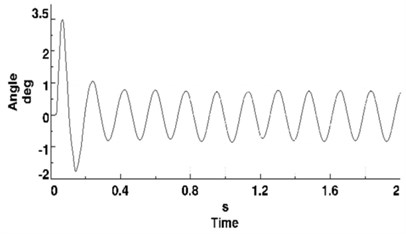
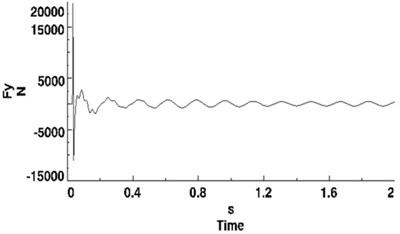
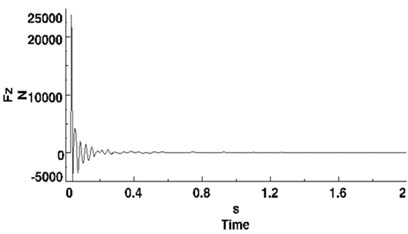
Except for the figure of NLG vertical tire force, curves of other parameters present a different pattern, as shown in Figure 13. An quasi-undamped oscillation appears after transitory attenuation since initial excitation applied. Even the 10th amplitude after initial excitation is 0.71°, almost the same as the 3rd one 0.75°.
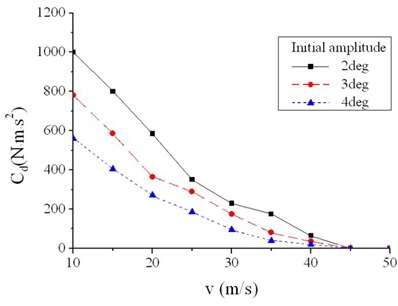
More cases show more differences with squared damper from linear ones. Effect of initial amplitude defined in reference [22] turns out to be significant to critical damping coefficient when squared damper applied as shown in Figure 12. The smaller initial amplitude is, the more damping coefficient is needed. With initial amplitude increasing from 2° to 4°, critical damping coefficient decreases by 55.8 % on average, with the maximum 44.0 % and minimum 69.2 %. Therefore, it is necessary to give standard value of initial amplitude in analysis when squared damper applied.
Divert attention back to quasi-undamped oscillation shown in Figure 13(a). With the same damping coefficient, do different initial amplitudes lead to quasi-undamped oscillation of different amplitudes?
Take the condition at a forward speed equaling to 10 m/s as an example. The initial amplitude varies from 1° to 4° with the same damping coefficient, and “stable amplitudes” for each case are listed in Table 3. The “stable amplitude” given is the average of the 8th, 9th and 10th amplitudes after initial one. From Table 3, the relative stable amplitudes are all little less than 0.75°, and the max difference between each other is only 0.02°. It is reasonable to consider that every critical anti-swing damping coefficient coincides with the only amplitude of quasi-undamped oscillation with squared damper applied and the stable amplitude is almost the same as the 3rd amplitude defined in the critical case, 1/4 of initial amplitude. Therefore, the initial excitation is not necessary, and critical cases can be defined by the way of stable amplitude instead, which is much simpler in simulation.
Fig. 13Curves of typical parameters with squared damper applied and no steering clearance
(a) Torsion angle of NLG
(b) Lateral force of NLG tire
(c) Vertical force of NLG tire
Table 3Stable amplitudes caused by different initial amplitudes
Initial amplitude (deg) | 1 | 2 | 3 | 4 |
Stable amplitude (deg) | 0.70 | 0.71 | 0.71 | 0.72 |
However, critical damping coefficient presents a similar pattern with the forward speed changing. When the forward speed increases from 5 m/s, critical damping coefficient decreases gradually. Also, when the aircraft runs at a speed above 42 m/s, it is safe and away from shimmy even without any anti-swing damping applied.
The same work was done with steering clearance considered, linear or squared damping moment applied. Similar pattern appears as Figure 13. Even with linear damper applied, critical damping coefficient varies with initial amplitude once steering clearance is considered. Also, the modified criterion of shimmy based on quasi-stable amplitude is suitable for these conditions.
3.3. Comparison of linear and squared damper
Compare figures of liner and squared damping coefficient shown in Figure 11 and 12. Both values are not comparable due to different dimension. However the patterns of the two figures are identical with forward speed changing, which indicates that there is some comparability with linear and squared damper and similar conclusion can be obtained in shimmy analysis.
Therefore, analysis below is only based on simulation with squared anti-swing damper applied. Conditions with initial and the 3rd amplitude equaling to 3° and 0.75°, or stable amplitude about 0.71°, are defined as the standard critical conditions of shimmy if no note is made.
4. Effect of parameters
With the shimmy analysis model developed, it is accessible to study on effect of different parameters.
4.1. Effect of tire parameters
Parameters of tire play an important part in shimmy analysis [1, 6]. Among various parameters, self-aligning torque and relaxation length are primary parameters in vehicle shimmy analysis.
In VL, self-aligning torque is produced about the tire vertical axis using one coefficient and the lateral force acting at the tire/road interface. The magnitude of the aligning torque is the product of the coefficient and the lateral force itself [23]. The coefficient named as self-aligning torque coefficient is given as a typical parameter of tire force which unit is “distance”. Accordingly, the coefficient can be understood as “self-aligning length”.
The relaxation length is also defined as a typical parameter in Complex Tire Force Model. Its value, combined with the fore/aft velocity, determines the time constant of a first-order equation, which is used to attenuate response of the lateral force and self-aligning torque [23]. Similarly, it is also studied in the research.
Therefore, self-aligning torque coefficient and relaxation length are studied to weigh the effects to critical damping coefficient and no steering clearance is considered in the section.
4.1.1. Effect of self-aligning torque on critical damping coefficient
Based on data of the actual tire used in NLG, the self-aligning torque coefficient is calculated as 122.64 mm. Zoom the value in and out by 10 % and 20 % to study the effect on critical damping coefficient as shown in Figure 14.
Fig. 14Critical damping coefficient of different self-aligning torque coefficients
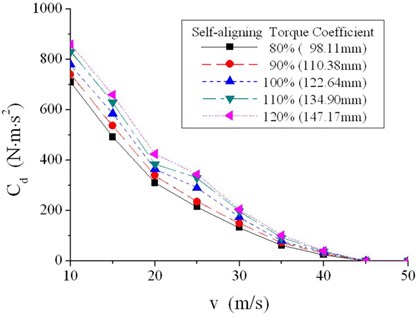
Table 4Ratios of critical damping coefficient with zoomed self-aligning torque coefficient and original one
(m/s) | 80 % | 90 % | 100 % | 110 % | 120 % |
10 | 0.91 | 0.94 | 1 | 1.06 | 1.1 |
15 | 0.84 | 0.91 | 1 | 1.08 | 1.13 |
20 | 0.85 | 0.93 | 1 | 1.05 | 1.16 |
25 | 0.74 | 0.81 | 1 | 1.14 | 1.19 |
30 | 0.76 | 0.86 | 1 | 1.14 | 1.18 |
35 | 0.79 | 0.91 | 1 | 1.15 | 1.29 |
40 | 0.71 | 0.89 | 1 | 1.09 | 1.17 |
Average | 0.8 | 0.9 | 1 | 1.1 | 1.17 |
Ratios of critical damping coefficient are listed in Table 4, with zoomed self-aligning torque coefficient and original one, at all speeds for comparison.
It can be concluded from Figure 14 and Table 4 that the variation of self-aligning torque coefficient leads to the same variation of critical damping coefficient at all forward speeds. Critical damping coefficient tends to be directly proportional to self-aligning torque coefficient, based on the average of critical coefficient at all speeds.
4.1.2. Effect of relaxation length on critical damping coefficient
Similarly, the relaxation length is calculated as 243.42 mm based on original data. Zoom the value in and out by 10 % and 20 % separately to study the effect on critical damping coefficient, as shown in Figure 15.
Ratios of critical damping coefficient are listed in Table 5, with zoomed relaxation length and original one, at all speeds for comparison.
It can be concluded from Figure 15 and Table 5 that the variation of relaxation length leads to the same variation of critical coefficient at all forward speeds. Difference about 10 % in relaxation length leads to 15 % change in critical damping coefficient, based on the average of critical coefficient at all speeds.
In summary, self-aligning torque coefficient and relaxation length of tire influence critical damping coefficient significantly, and within the range of ±20%, critical coefficient tends to be directly proportional to self-aligning torque coefficient, and the effect of relaxation length tends to be more.
Fig. 15Critical damping coefficient of different relaxation lengths
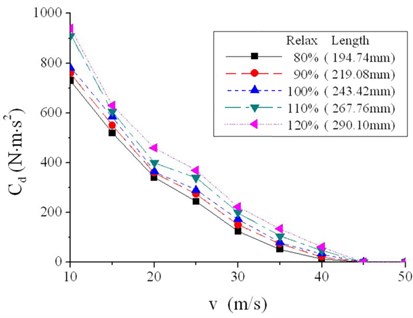
Table 5Ratios of critical damping coefficient with zoomed relaxation lengths and original one
(m/s) | 80 % | 90 % | 100 % | 110 % | 120 % |
10 | 0.94 | 0.97 | 1 | 1.17 | 1.21 |
15 | 0.89 | 0.94 | 1 | 1.03 | 1.08 |
20 | 0.93 | 0.99 | 1 | 1.1 | 1.26 |
25 | 0.84 | 0.95 | 1 | 1.17 | 1.28 |
30 | 0.72 | 0.86 | 1 | 1.15 | 1.28 |
35 | 0.65 | 0.94 | 1 | 1.31 | 1.38 |
40 | 0.37 | 0.63 | 1 | 1.37 | 1.77 |
Average | 0.76 | 0.9 | 1 | 1.19 | 1.37 |
Fig. 16Critical damping coefficient considering different steering clearances
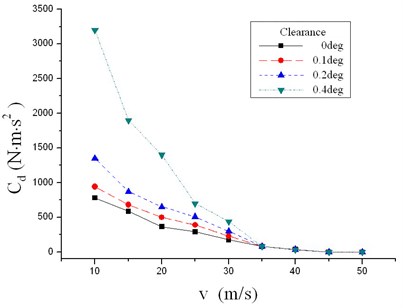
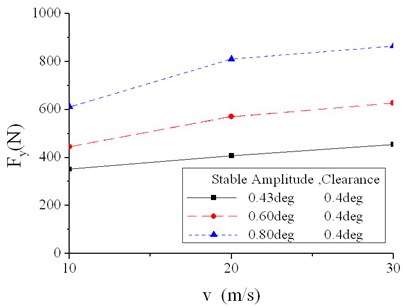
Fig. 17Stable amplitude of lateral tire force in different conditions (1)
4.2. Effect of clearance
Clearance is one of the most non-linear parameters in aircraft shimmy analysis. In this section, clearance of the steering freedom is considered in the model. The definition is given in Section “Steering clearance”.
The critical squared damping coefficient is obtained which keeps amplitudes after 3 vibration periods less than 0.75° after the initial one equaling to 3°. Also, effects of some other parameters are analyzed, such as lateral and vertical forces of NLG tire which crossed the pointed barrier.
4.2.1. Effect on critical damping coefficient
Curves of critical damping coefficients considering different steering clearances are shown in Figure 16. It is obvious that the critical damping coefficient increases sharply with the growing of steering clearance at all speeds. The closer to “the max-damping speed”, the sharper the curve is. At the speed of 10 m/s, the critical damping coefficient with a clearance of 0.4° is about 4 times of the value with no clearance considered. Also, zero damping speed doesn’t change much.
4.2.2. Effect on tire force
4.2.2.1. Effect on lateral force of NLG tire
As shown in Figure 13(b), lateral forces of NLG tire present the pattern that quasi- undamped oscillation appears after transitory attenuation. The method dealing with quasi- stable amplitude of torsion angle mentioned above is also used to study lateral force of the tire. Similarly, quasi-stable amplitude of lateral force is considered as the standard parameter.
Take conditions with a clearance equaling to 0.4° as an example, stable amplitude of lateral force increases as forward speed grows, with the same clearance and stable amplitude of torsion angle applied, as shown in Figure 17. Vary forward speed from 10 m/s to 30 m/s, and stable amplitude of lateral force increases by 37.2 % on average, differing from 29.3 % to 41.3 %. Also, stable amplitude of lateral force increases with stable amplitude of torsion angle. Change stable amplitude of torsion angle from 0.43° to 0.8°, and stable amplitude of lateral force increases by 87.8 % on average, differing from 74.4 % to 98.5 %.
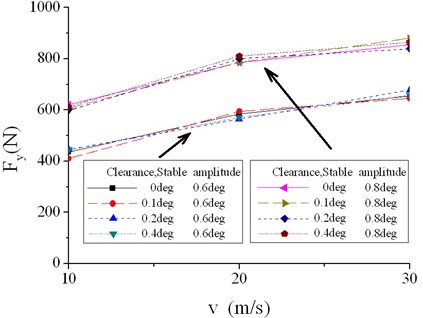
Similarly, in terms of stable angles equaling to 0.6° and 0.8°, stable amplitude of lateral force changes little with different clearances, as shown in Figure 18. Vary steering clearance from 0° to 0.4°, the difference is no more than 7.9 %.
In summary, lateral force of tire has no relation with clearance but changes with forward speed and stable amplitude of torsion angle.
Fig. 18Stable amplitude of lateral tire force in different conditions (2)
4.2.2.2. Effect on vertical force of NLG tire
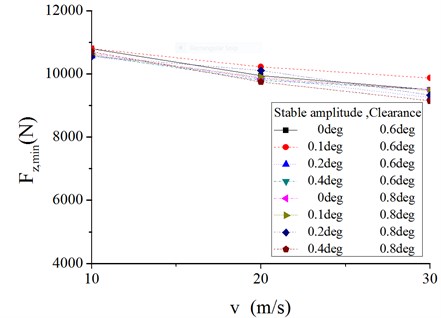
Different from lateral force, curves of vertical force shown in Figure 13(c) present a pattern of continuous attenuation vibration even after 10 vibration periods. Keep the same anti-shimmy damping moment and height of barrier, and the maximum and minimum of vertical force caused by initial excitation are selected as to study the effect of steering clearance on vertical force of NLG.
Take conditions with a clearance equaling to 0.4° as an example, the maximum vertical force increases and the minimum decreases with the increase of forward speed as shown in Figure 19. The change with stable amplitude can be neglected. Vary forward speed from 10 m/s to 30 m/s, and max vertical force increases by 12.7 % on average, differing from 10.3 % to 14.1 %, and min vertical force decreases by 10.8 % on average, differing from 7.6 % to 14.5 %. Vary stable amplitude of torsion angle from 0.43° to 0.8°, differences of the max vertical force is merely 1.7 % and the minimum is 6.0 %.
Fig. 19Maximum and minimum of vertical tire force in different conditions (1)
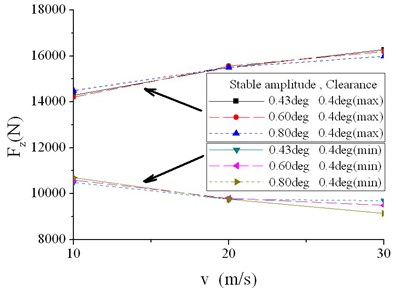
Fig. 20Maximum and minimum of vertical tire force in different conditions (2)
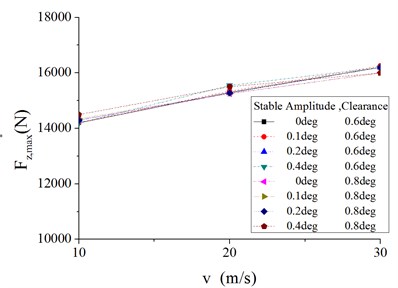
In terms of stable amplitude of torsion angle equaling to 0.6° and 0.8°, maximum and minimum vertical tire force change little with steering clearance, as shown in Figure 20 and 21. Vary steering clearance from 0° to 0.4°, difference of the max vertical force is 2.8 % on average and no more than 7.3 % while difference of the minimum is 1.2 % on average and no more than 2.1 %.
In summary, vertical tire force has no relation with clearance but only changes with forward speed and stable amplitude of angle.
Fig. 21Maximum and minimum of vertical tire force in different conditions (3)
5. Conclusion
1) A non-linear shimmy model with sufficient accuracy is developed based on some type of airliner and used to parameters analysis.
2) Critical anti-shimmy damping coefficient decreases with the forward speed increasing at a mid or high speed (above 10 m/s), and there exits a critical speed, above which no damper is needed to keep shimmy stable, linear or squared damping applied.
3) Based on the definition given by reference [22], value of initial excitation is dispensable to criterion of shimmy with linear damper and no steering clearance applied. However, value of initial excitation is indispensable as long as steering clearance considered or with squared damper applied.
4) Critical anti-shimmy damping coefficient tends to be directly proportional to self-aligning torque coefficient, and effect of relaxation length on critical damping coefficient is more significant.
5) Steering clearance influences critical damping coefficient sharply, and influences lateral force of tire significantly and influences vertical force of tire little. And forward speed has some connection with both lateral and vertical force of tire.
References
-
Jocelyn Pritchard An overview of landing gear dynamics. NASA/TM-1999-209143, 1999.
-
Sura N. K., Suryanarayan S. Closed-form analytical solution for the shimmy instability of nose-wheel landing gears. J. Aircr., Vol. 44, Issue 6, 2007, p. 1985-1990.
-
Coetzee E. Shimmy in aircraft landing gear. Tech. Report No. 56/2006, 2006.
-
Thota P., Krauskopf B., Lowenberg M. Shimmy in a nonlinear model of an aircraft nose landing gear with non-zero rake angle. Proceedings of ENOC-2008, Russia.
-
W. R. Krüger Integrated design process for the development of semi-active landing gears for transport aircraft. Diss, 2001.
-
Zhu Depei Shimmy theory and anti-shimmy measure. National Defense Industry Press, Beijing, 1984.
-
Yadav D., Singh C. V. K. Landing response of aircraft with optimal anti-skid braking. Journal of Sound and Vibration, Vol. 181, Issue 3, 1995, p. 401.
-
Sura Niranjan K. Lateral response of nose-wheel landing gear system to ground-induced excitation. Journal of aircraft, Vol. 44, Issue 6, 2007, p. 1995-2005.
-
Wang Haitao An investigation of an active landing gear system to reduce aircraft vibrations caused by landing impacts and runway excitations. Journal of Sound and Vibration, Vol. 317, Issue 1-2, 2008, p. 50-66.
-
Wang Xuejun, Qiao Xin The stability analysis of the nonlinear shimmy. Journal of Nanjing Aeronautical Institute, Vol. 24, 1992, p. 9-18.
-
Gerhard Somieski Shimmy analysis of a simple aircraft nose landing gear model using different mathematical methods. Aerospace Science and Technology, Vol. 8, 1997, p. 545-555.
-
P. D. Khapane Flexible aircraft II AP6-final internal report of the German national aerospace program. DLR, Institute of Aeroelasticity – Oberpfaffenhofen, 2002.
-
P. D. Khapane Simulation of asymmetric landing typical and ground maneuvers for large transport aircraft. Aerospace Sci. Technol., Vol. 7, 2003, p. 611-619.
-
Matthew S. Schmidt, Chris Paulson CAD embedded CAE tools for aircraft designers as applied to landing gear. AIAA, A97-37224, 1997, p. 333-340.
-
P. D. Khapane Simulation of aircraft landing gear dynamics using flexible multibody dynamics methods in SIMPACK. ICAS, Yokohama, Japan, 2004.
-
P. D. Khapane Gear walk instability studies using flexible multibody dynamics simulation methods in SIMPACK. Aerospace Sci. Technol., Vol. 10, 2006, p. 19-25.
-
Feng Fei, Chang Zheng, Nie Hong, Zhang Ming, Peng Yiming Analysis of influence of aircraft flexibility on nose landing gear shimmy. Acta Aeronautica et Astronautica Sinica, Vol. 32, Issue 12, 2011, p. 2227-2235.
-
Wan Xiaofeng LMS virtual lab motion approach and enhance. Northwestern Polytechnical University Press, Xi’an, 2010.
-
Patran MSC. Nastran Preference Guide 3, 2002.
-
Lu Jianwei, Gu Jue, Wang Qidong Influence analysis of movement pair clearance on nonlinear dynamic behavior of vehicle shimmy system. Chinese Journal of Mechanical Englneering, Vol. 44, Issue 8, 2008, p. 169-173.
-
Lu Jianwei, Gu Jue, Liu Mengjun Modeling of the vehicle shimmy system with consideration of clearance of the steering linkage mechanism. Meccanica, Vol. 45, 2010, p. 53-61.
-
Design requirement of Anti-shimmy for nose landing gear of aircraft. The Commission of Science, Technology and Industry for National Defense, GJB 5097-2002, China, 2002.
-
LMS Virtual Lab Online Help. Rev 8B, 11-11-2008.
About this article
The authors are grateful to Mrs. Wan Xiaofeng and Dr. Chen Xi for their help and constructive remarks. Their expertise with multibody dynamics modeling and writing skills made the work presented possible. This study was funded by the National Natural Science Foundation of China (Grant Nos: 51075203 and 51105197) and the Priority Academic Program Development of Jiangsu Higher Education Institutions.
