Abstract
Nowadays there is a growing development of urban tram and underground networks with the aim of improving resident’s mobility and reducing the environmental impact. Among the issues related to this fact one finds the vibration generated by the vehicles and transmitted through the track and the ground. This may cause an important impact for both residents and structures. In order to study this phenomenon, a comprehensive campaign of measurements has been carried out in certain sections of the tram network in Alicante (Spain). In addition, an analytical model has been developed and calibrated with part of the data obtained. Using both experimental measures and the computer model vibration within the track is analyzed. Special attention is paid to the alleviation capability of the different materials and typologies present in the track. From this study, a strong relation between the Young Modulus and the frequency range alleviated by each material is obtained, and more rigid typologies are shown to be more efficient for low frequency vibrations which are the ones potentially disturbing for humans.
1. Introduction
Over the last years, many countries have promoted the development of tram and underground networks in order to improve the residents’ mobility as well as for sustainability purposes.
However, despite the advantages of these urban transport networks, there are some associated issues that may affect both the passengers and the residents. With regard to the later, vibration induced by the vehicles arises as one of the main causes of discomfort for the environment, as a source of either disturbing noise or vibration for the structures nearby.
For this reason it is necessary to study and gain a better understanding of the vibration induced by the tram and transmitted to the nearby structures in order to develop strategies to alleviate their non-desired effects.
Within this context, the paper aims to analyze the vibration phenomenon in certain sections of the Alicante’s tram network. Particular attention is paid to the mitigation efficiency of the materials and typologies those sections are made of. Therefore, the paper is focused in the generation and transmission of vibrations within the track infrastructure rather than in their propagation to the environment.
In order to fulfil this objective, a comprehensive campaign of measurements has been carried out. Additionally, an analytical model has been developed and used to complement the measurements. Therefore, the phenomenon is studied using both experimental data and computer modeling so as to achieve a deeper understanding.
All this process is explained within the paper as follows: First of all a concise literature review is presented to summarize the works previously made in both the vibration analytical modeling and the study of materials and strategies for vibration mitigation. Then, the model equations are explained as well as their resolution through the Fourier Transform. In the third place, the methodology used for data gathering is detailed. Finally a complete discussion of the results is given, providing a set of conclusions and recommendations for further studies.
2. Literature review
2.1. Materials and typologies for mitigation
Considering the study of materials and track systems used to alleviate vibrations, there is a fair amount of literature regarding the theoretical study of vibration and dynamics in railway tracks. However the study of slab tracks for trams has been less well studied, so this paper will focus on it.
As an example of this, the works of Grassie ([1] and [2]) deal with the dynamic modeling of both track and rolling stock. Many more recent studies related to train-induced vibration still focus on purely theoretical aspects (Gupta et al. [3], Celebi [4], Wen et al. [5]) or aim specifically at the ground and pay no attention to the track infrastructure and the influence that their elements may have in the wave transmission (Auersch [6], Metrikine and Vrouwenvelder [7]).
There are more practical studies but these tend to focus on noise-related issues. Noise is certainly a vibration phenomenon based on the same principles and with the same origin within the railway context, but it has different characteristics compared to the wave transmission through the track and the ground and thus it requires a different approach. Some examples of this are the papers made by Van Lier [8] and Thompson et al. [9] where some track elements are analyzed considering specifically their noise alleviation features.
Thompson [10] analyses in depth the vibration phenomenon and their isolation in the railway infrastructure, from a theoretical point of view.
Other studies which focus on the mitigation of vibration within the railway infrastructure tend to analyze a specific element rather than a set of elements or materials. Examples of this can be found in Ahmad et al. [11] and Yuan et al. [12].
It can be applied to the study of vibrations induced by lower speed vehicles, but it does not present experimental validation.
Finally, almost all the literature reviewed studies conventional railways on ballasted tracks. Comparatively there is much less work made on slab tracks or other similar track typologies which are rather common in urban environments. The work of Markine et al. [13] is one of the few examples found, although it focuses on slab track design for high speed lines.
In conclusion, although the study of track systems to alleviate vibrations has been widely published, this paper intends to analyze vibrations in a more specific case of track typologies found in a tram network using both a computer model and experimental data.
2.2. Analytical model
In the context of the vibration modeling, many authors have chosen analytical models over the last years because, despite being less adaptable than the numerical ones, they are more consistent and provide a continuous solution within the range of study.
In the field of railway modeling, it is a common assumption to consider the rail as a beam resting on either discrete supports (sleepers) or a continuous support modeled as a visco-elastic layer whose vibration behavior is ruled by the wave equation. Çalim [14] develops this hypothesis, which is applied to railway modeling in the works of Metrikine and Vrouwenvelder [7], Schevenels et al. [15], and Muscolino and Palmeri [16]. X. Sheng et al. [17] presents a model for the calculation of the vibrational response of a layered ground subject to a harmonic load.
A key factor of the analytical formulation of the wave equation is the method used to solve it. A common procedure is to apply an integral transform so as to simplify the equation, such as the Laplace Transform (Calim [14]) or the Wavelet Transform (Koziol et al., [18], Florez et al., [19]). However, the most common method is to shift the phenomenon from the time to the frequency domain by means of the Fourier Transform, thus allowing the study of the vibration frequency spectrum. This procedure is shown in Koziol et al. [18], Liao et al. [20] and Metrikine and Vrouwenvelder [7], and is the one chosen for the mathematical model applied in the paper.
3. Metodology
In this section the methodology applied in the paper for both the model and the data gathering is detailed.
3.1. Cross sections studied
As explained before, the aim of this paper is to analyze the vibration generated by a tram, focusing particularly on the alleviation of the wave depending on the materials the track is made of, as well as its structural typology.
In order to do this, three sections of the tram network in Alicante (Spain) are studied. Those sections were built by GTP (Ente Gestor de la Red de Transporte y de Puertos de la Generalitat Valenciana) and are operated by FGV (Ferrocarriles de la Generalitat Valenciana).
The sections are shown below:
- Section A (Fig. 1): Slab track. Phoenix 37N rails embedded in an elastomer developed by Edilon Sedra. There is no pad between the rail and the concrete. The characteristics of the different materials are shown in Table 1.
Fig. 1Cross section A (dimensions in meters)
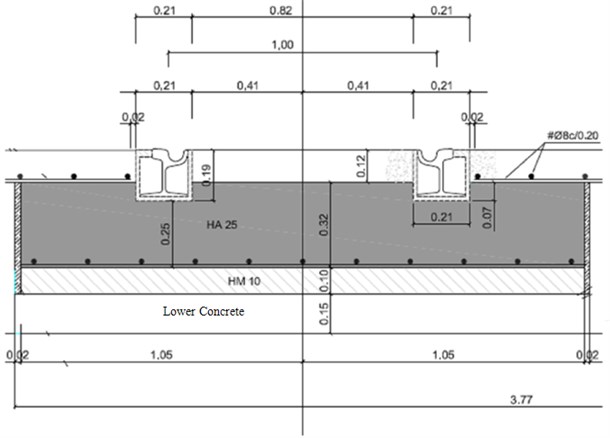
Table 1Characteristics of the materials in section A
Phoenix 37N Rail | 210000 MPa |
0.3 | |
7830 kg/m3 | |
0.0079 m2 | |
3.68E-5 m4 | |
Upper concrete layer | 30000 MPa |
0.2 | |
2400 kg/m3 | |
Edilon Elastomer | 8 MPa |
0.48 | |
900 kg/m3 | |
Lower concrete layer | 30000 MPa |
0.2 | |
2400 kg/m3 |
- Section B: This section has the same typology shown in section A, but in this case the elastomer the rail is embedded in is a different material developed by the School of Industrial Engineering of the Universidad Politécnica de Valencia (UPV). The characteristics of the materials are detailed in Table 2.
Table 2Characteristics of the materials in section B
Phoenix 37N Rail | 210000 MPa |
0.3 | |
7830 kg/m3 | |
0.0079 m2 | |
3.68E-5 m4 | |
Upper concrete layer | 30000 MPa |
0.2 | |
2400 kg/m3 | |
UPV Elastomer | 3400 MPa |
0.4 | |
1000 kg/m3 | |
Lower concrete layer | 30000 MPa |
0.2 | |
2400 kg/m3 |
Fig. 2Cross section C (dimensions in meters)
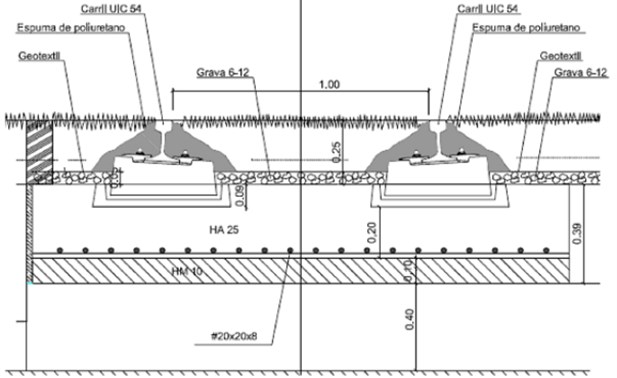
Table 3Characteristics of the materials in section C
UIC 54 Rail | 210000 MPa |
0.3 | |
7830 kg/m3 | |
0.0069 m2 | |
2.34E-5 m4 | |
Upper vegetal layer | 15 MPa |
0.3 | |
1500 kg/m3 | |
Dutch concrete plug | 30000 MPa |
0.2 | |
2400 kg/m3 | |
Lower concrete layer | 30000 MPa |
0.2 | |
2400 kg/m3 |
- Section C (Fig. 2): Green track. UIC 54 rails resting on a Dutch plug (with a pad in between) and embedded in a layer of vegetal soil. The rail is water-isolated by polyurethane foam. The whole track rests on a concrete layer with a geo-textile placed in the interface to ensure proper drainage. Once again the characteristics of the materials are shown in Table 3.
3.2. Mathematical model
The model used in this article is based on the analytical model presented by Koziol et al. [18], Salvador et al. [21] and particularly Real et al. [22]. For this reason, in this section of the paper only the main features of the model are shown. For more details about the formulation, the reader may check the authors aforementioned.
The model covers a 2D domain formed by the track and the ground underneath. The two dimensions are (depth) and (horizontal and parallel to the track).The dimension (perpendicular to the track) is not considered. The model provides the vertical and horizontal displacements caused by the passing of a moving load, as well as the stresses induced in the ground. This model it has been chosen because the displacements in direction of the rail are constrained by sleepers. Train moves in direction and the main stresses are generated in dimension, due to train loads. So a 2D model represents properly the vibration phenomenon.
Figure 3 is a schematic picture of the domain the model works on and the considered axis. The characteristics of each layer are modified according to the actual typology which is modeled in each step. However, for every case these layers are assumed to be made of a visco-elastic, homogeneous and isotropic material. The third layer has an infinite depth, thus forming a Boussinesq half-space, to simulate that the wave is not affected by any interaction in this direction. That is also used to define some boundary conditions, expressed as equations, to formulate the model.
Fig. 3Geometry of the problem
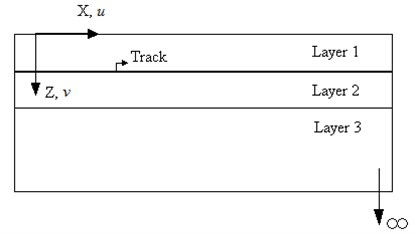
The rail is modelled as a beam of negligible thickness placed between the first and second layer, to simulate the fact that the rail is embedded. Its mechanical behavior is ruled by the Timoshenko beam theory according to the following system of equations:
where is the shear modulus, is the vertical displacement and is the angular displacement.
For sections A and B, the first layer is the upper concrete layer and the second layer represents the elastomer, which is different for each section (has different mechanical characteristics for each section). At the interface of the two layers is located the rail. The third layer represents the concrete slab where the rail and elastomer are resting on.
For section C the beam representing the rail is also situated between the first and second layer, being the first the surface vegetal soil and the second the concrete plug. The third layer represents the concrete slab where the concrete plug is resting on.
The mechanical behavior of the track and the ground (i.e. the three layers of material) is defined by the wave equation, expressed as a vector equation:
where is the displacement vector , and is density of materials that compose each layer. and are damping parameters which regulate the damping behavior of the railway section modeled. and are Lamé paramters. and must be calibrated using experimental data:
As for the loads, in order to introduce the full effect of the tram, a set of point loads (one per axle) moving at a constant speed is defined. The load input producer is the same that has been exposed in [23].
Finally, boundary conditions are defined (6). According to Metrikine and Vrouwenvelder [7], it is not necessary to define initial conditions as only the stationary solution of the wave equation (2) is to be obtained. (Note that in the next equations sub-indexes 1, 2 and 3 refer to the first, second and third ground layers respectively.)
The development of the solution is the same that has been explained in [22] and [23].
3.3. Data gathering
A comprehensive campaign of measurements is made to obtain experimental data for both model calibration and analysis of the vibration phenomenon. The sensors used are triaxial accelerometers FastTracer developed by Sequoia. Their technical features are shown in Table 4.
Accelerometers are placed on the surface of the track at fixed distances from the rail to register the acceleration induced by the passing of the tram. Two sensors are placed in each section, fixed to the track surface (either concrete or vegetal soil). One is located at 20 cm from the rail (‘closer sensor’) and a second one at 120 cm (‘farther sensor’), except in the case of section C where the later is placed at 280 cm due to space constraints (Figure 4). The accelerometers are fixed with magnets to steel plates which are in turn screwed to the surface.
Table 4Accelerometers technical features
Scope | ±2g |
Bandwidth (Hz) | 0-2500 |
Resolution (m/s2) | 0,017 |
Noise (m/s2) | 0,055 |
Sampling rate (Hz) | 8192 |
Fig. 4Sensor location in sections A, B and C

Additionally, FGV provided velocity data for all the trams.
Each section is monitored during a whole day, measuring surface acceleration in both sensors for every tram which passes through the section. This yields a total amount of about 64 data sets per section (32 per sensor) which are stored in a laptop using a monitoring software package: FTAnalyzer (Sequoia IT, Moncalieri, Italy).
Sampling frequency reaches up to 8192 samples per second, this allows analyzing a frequency spectrum from 0 to 4096 Hz. Even if a complete spectrum is obtained and studied, this paper focuses on frequencies below about 150-200 Hz, which is the frequency range of interest to study vibration problems.
These data files are then exported to Wolfram Mathematica 7 (Wolfram Research Inc., Champaign, USA) for post processing. Frequency spectra are obtained for each data set applying the Fourier Transform to the acceleration measurements and the signal is filtered to remove any disturbance. In this way, up to 64 clean accelerogram and spectra graphs are obtained for each section, which are then used for calibration and analysis of the phenomenon.
Track and wheel irregularities are not measured because it is not necessary its identification. It is only needed to know the effect of loads caused by those irregularities on the track to obtain the harmonic loads using a quarter car secondary model (Melis M. [25]). That effect is considered within the acceleration measurements.
3.4. Model calibration
A qualitative calibration of the model is carried out for each section using the vibration measurements taken by the closer sensor in the tram network. The distance between sensor and rail is enough small to be neglected and assume that the accelerations registered by the closer sensor are the accelerations of the rail.
There are three parameters to be calibrated for each section, as exposed in Table 5.
Table 5Model parameters
Track spring constant | |
, | Damping coefficients for the j-th |
The first parameter represents the equivalent spring constant of the whole track (including contact spring) used in the quarter car secondary model (See Real et al. [22] and Real et al. [23]) and affects the magnitude of the harmonic forces caused by the vehicle, thus increasing or decreasing the peaks of acceleration.
The second and third parameters define the damping of the vibration associated to each material and affect the form of the wave generated. As there is only surface data available, they are only calibrated for the first layer of each section, but the results can be extrapolated to the other layers as these damping parameters are related to the mechanical characteristics of the material the layer is made of.
Measured and modeled accelerations are compared and the parameters are modified by trial error, until both accelerogram registries are close enough to each other, according to the following criteria:
- Magnitude of the maximum and minimum peaks.
- Time between peaks.
- Time the signal takes to grow up to the first peak.
- Time of attenuation after the last peak.
Once these criteria are met, the model is considered to be calibrated and it can be used to analyze the phenomenon together with the experimental data.
Calibration is made comparing measurements and predictions in the time domain, but results will be interpreted in both frequency and time domain, because frequency spectra are studied to confirm the vibration alleviation for each section.
4. Results and discussion
4.1. Calibration
The model has been adapted to the three different track typologies and its parameters have been calibrated using some of the data gathered during the measurement campaign according to the criteria explained before. The results from this process are shown in the figures (5), (6), (7) and Table 6.
Table 6Calibrated parameters
Section A | Section B | Section C | |
41E8 | 41E8 | 20E8 | |
45E6 | 45E6 | 5E5 | |
Irrelevant | Irrelevant | Irrelevant |
Fig. 5Model calibration for section A (model in red, data in green)
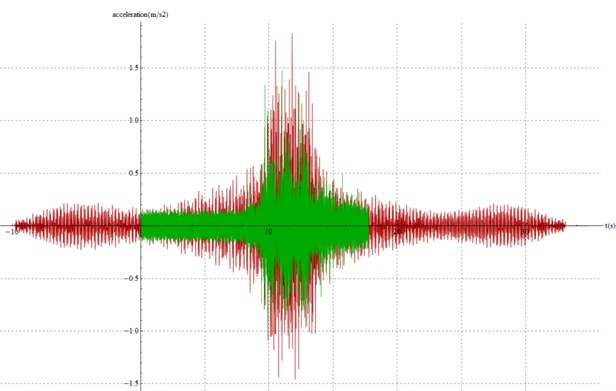
Fig. 6Model calibration for section B (model in red, data in green)
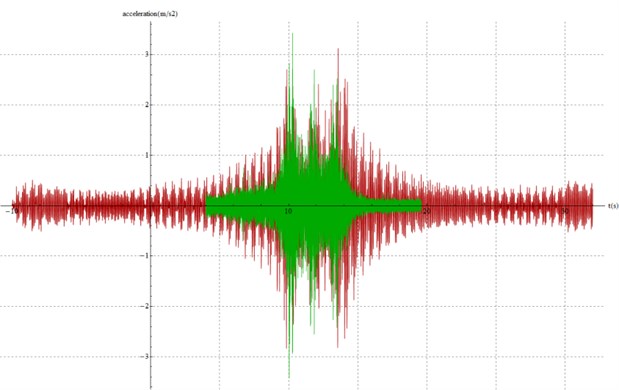
Fig. 7Model calibration for section C (model in red, data in green)
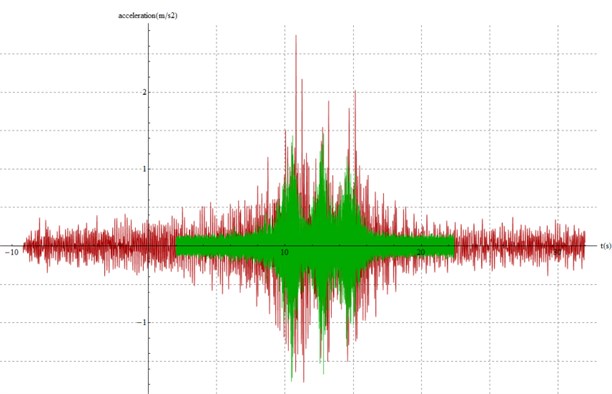
The figures show a good agreement between modeled and measured accelerations. Peaks are properly reproduced, as well as the time between peaks and the time of growth and decay. Therefore, all the calibration criteria are fulfilled and the model is calibrated for the three sections.
It is worth noting that, of all the parameters needing calibration, the damping coefficient has no significant influence in the modeled acceleration. Therefore, its value is not relevant, but has been set in all cases as 40E3 to avoid numerical instability.
4.2. Measurements
One of the key factors to be considered when studying the vibration induced by the passing of a tram is the vehicle velocity. It is clear that greater velocity implies greater dynamic loads and thus higher peaks of acceleration in the ground. Therefore, velocity must be known before comparing different acceleration registries.
Mean velocity in each section is shown in Table 7 (data provided by FGV).
From the table it is clear that the mean velocity is quite similar between A and B as the difference is only 4 km/h. Between A and C it is higher (about 8 km/h) but still reasonable. The registries provided by FGV also show that the differences between sections are low when comparing tram by tram, a fact which is confirmed by the small standard deviation for all sections. Therefore, it can be assumed that the comparisons made between sections are not biased by huge differences of speed.
Table 7Mean velocity and Standard Deviation
Section | Mean Velocity (km/h) | Standard Deviation (km/h) |
A | 28.41 | 2.64 |
B | 23.76 | 2.22 |
C | 20.76 | 2.08 |
In order to assess the average performance of the two different elastomers placed in sections A and B, the peaks of acceleration registered along a day in the sensor closer to the track are compared (Figure 8). This comparison shows a quite similar behavior between both sections, although a certain reduction of the acceleration may be pointed out in section A. Considering that the structural typology is exactly the same for both sections except for the elastomer, one can conclude that the elastomer provided by EDILON is slightly better than the one developed by the UPV.
Fig. 8Acceleration peaks in the closer sensor (A in green, B in black)
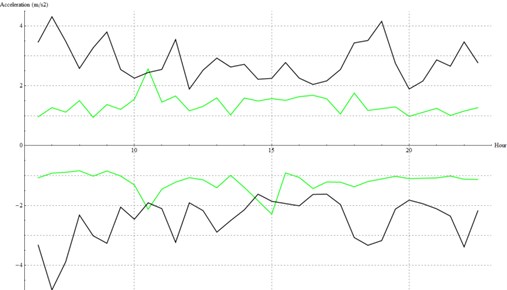
This conclusion is backed up when comparing the registries taken in both sections for exactly the same tram passing with the same velocity (Figure 9).
Fig. 9Maximum acceleration at sections A and B for the 4202 tram
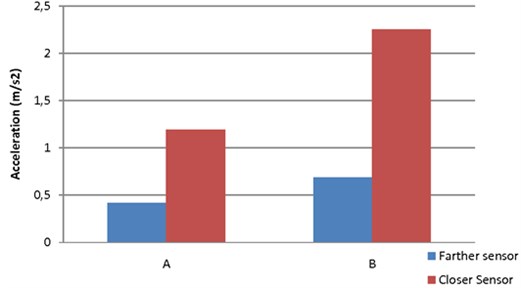
This figure endorses the appreciation of a higher acceleration peak in section B close to the track. However, the difference is notably smaller when comparing the acceleration peak registered by the farther sensor. Therefore, it can be concluded that the EDILON elastomer absorbs part of the vibration more efficiently than the UPV elastomer, and then the vibration is almost equally alleviated by the concrete layer in both sections at a certain distance.
If the frequency spectrum of the vibration is considered, the EDILON elastomer seems to alleviate high frequency vibrations better than the UPV one, while the low frequency peaks are not notably affected by any of them but are likewise mitigated by the rigid concrete layer present in both sections. As the main difference between the elastomers is their Young Modulus (8 MPa vs. 3400 MPa), this mechanical parameter seems to have an important influence in the behavior against vibration.
Sections A and B can be compared to section C to assess the performance of the green track typology against the concrete slab track. Figures 10 and 11 show the maximum and minimum peaks registered by the closer and farther sensor respectively at sections B and C.
Fig. 10Acceleration peaks in the closer sensor (B in black, C in dashed grey)
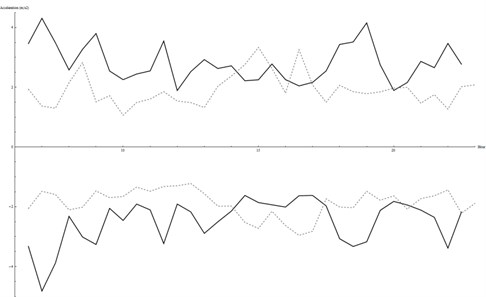
Fig. 11Acceleration peaks in the farther sensor (B in black, C in dashed grey)
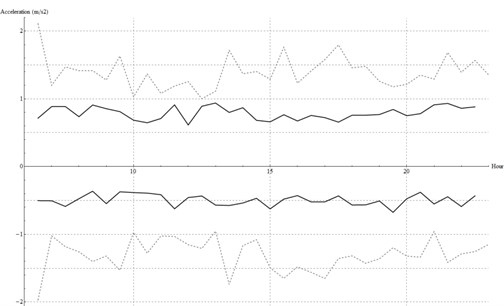
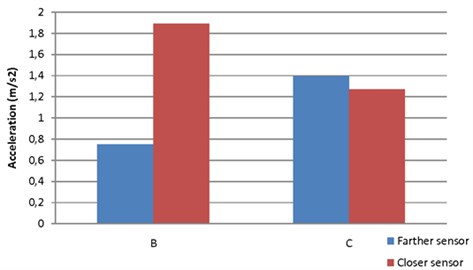
As the figures show, the peak of vibration close to the track is higher in section B (section C is higher only at certain hours). However, the farther sensor shows a noticeably lower level of vibration in section B compared to that in C. This means that similar or even greater levels of vibration at short distance from the rail are alleviated to a greater extend at long distance in section B. This observation is endorsed by the fact that the distance between the rail and the farther sensor is bigger in section C (280 vs. 120 cm.). This trend is also shown in Figure 12, where a comparison between registries taken for the same tram passing at the same velocity is exposed.
Therefore, the concrete slab seems to be more efficient that the vegetal layer, especially at low frequencies as explained before. This is of particular interest as low frequencies are the ones perceived by humans (specifically those under 80 Hz as found in Thompson [10] and the ISO 2631-2 [26]) and thus the most disturbing for residents near the track.
Fig. 12Maximum acceleration at sections B and C for the 4203 tram
4.3. Modeling
The model, once calibrated, allows analyzing certain aspects of the vibration phenomenon not covered by the data gathered. Within these aspects are the study of the influence that certain materials or mechanical parameters may have in the phenomenon, and the modeling of vibration under the surface where no actual data is available.
First of all, a deeper study of the elastomers is carried out. Figure 13 and 14 show the modeled accelerogram at 0.25 m under the surface (i.e. in the elastomer layer, to avoid interactions with the concrete layers) in sections A and B.
The model confirms the behavior observed in the data. The peak of acceleration is slightly lower in section A (EDILON elastomer) compared to section B (UPV elastomer). Moreover, a lower stiffness leads to a shorter wave with a much lower time of growth and decay. Peaks are also clearer in Figure 13.
All this leads to two considerations: On the one hand, more flexible materials seem to be affected by the vibration for a shorter period of time (i.e. they do not vibrate until the tram passes right over them). This is likely due to a poorer transmission of the wave rather than a higher alleviation capability.
Fig. 13Acceleration modelled at 0.25 m under the surface, Section A
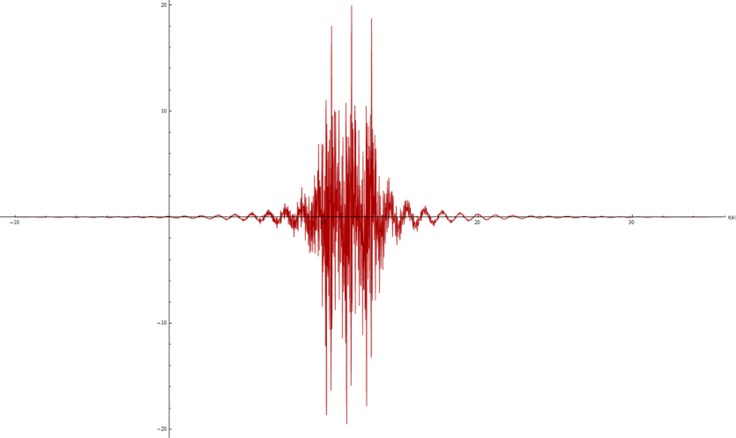
Fig. 14Acceleration modelled at 0.25 m under the surface, Section B
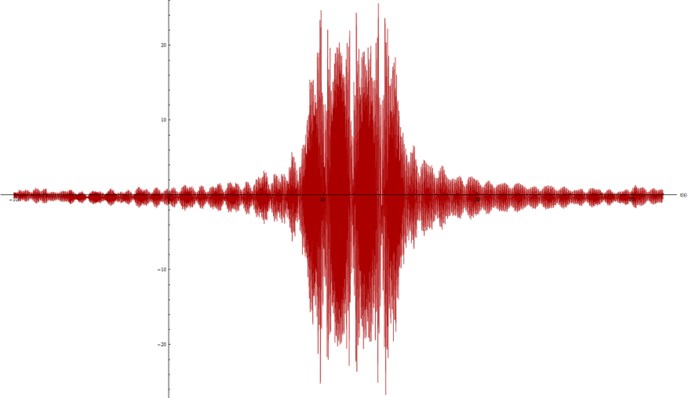
Fig. 15Acceleration spectra at 0.25 m under the surface, Section A
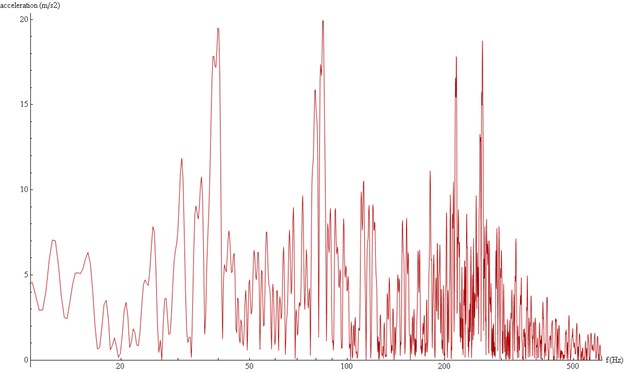
Fig. 16Acceleration spectra at 0.25 m under the surface, Section B
On the other hand, more flexibility seems to cause higher reduction of acceleration peaks. However, as explained before, frequency is a key issue to be considered before reaching such a conclusion.
Figure 15 and 16 show the spectra modeled in 1/3 octave frequency bands, at the same depth as the accelerograms shown in Figures 13 and 14. There are clear differences in both the magnitude of the higher peaks and the frequency range covered by each spectrum: In section A the peaks are lower and are concentrated in the low range (under 300 Hz). There is almost no signal (i.e. no energy) over 800 Hz. Meanwhile, in section B, peaks are higher and very clear in high frequency range.
All this confirms that a material with lower stiffness does alleviate acceleration peaks efficiently, but only in the high frequency range. This explains the observations made for Figure 13, Although the more flexible elastomer seems to reduce the overall acceleration peak, this is a selective mitigation which only affects the high frequency range of the wave, while the low frequency range is alleviated only in small percentage by both elastomers. Therefore, a more flexible elastomer (the EDILON in this case) is a better choice if high frequency vibration is to be mitigated, but there is no practical difference between elastomers for low frequency vibration.
In order to further expand the study of this relation between elasticity and mitigation, the behavior of the concrete layer in section A is analyzed.
Figure 17 and 18 show the accelerogram modeled at the surface for different values of the Young Modulus (3e10 Pa. in Figure 17; 3e8 Pa. in Figure 18).
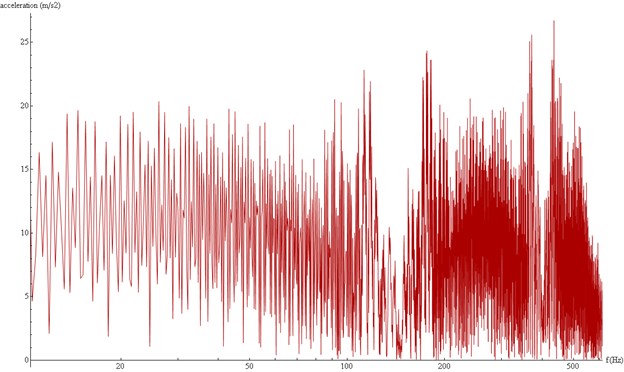
These figures show again that a lower stiffness leads to a shorter wave, as the total time decreases from 40 seconds to only 14 seconds. However, in this case the peaks are much higher for the lower value of the Young Modulus. This may seem a contradiction with the behavior observed before, but again it is explained when observing in Figures 19 and 20 the 1/3 octave band frequency spectrum.
As shown before, the more rigid concrete does not alleviate the high frequency range as much as the more flexible one, but it does mitigate the low frequency range to a much greater extent. All this allows confirming the close relation between the material stiffness and its alleviation capability.
Fig. 17Modelled accelerations at the surface, E= 3e10 Pa
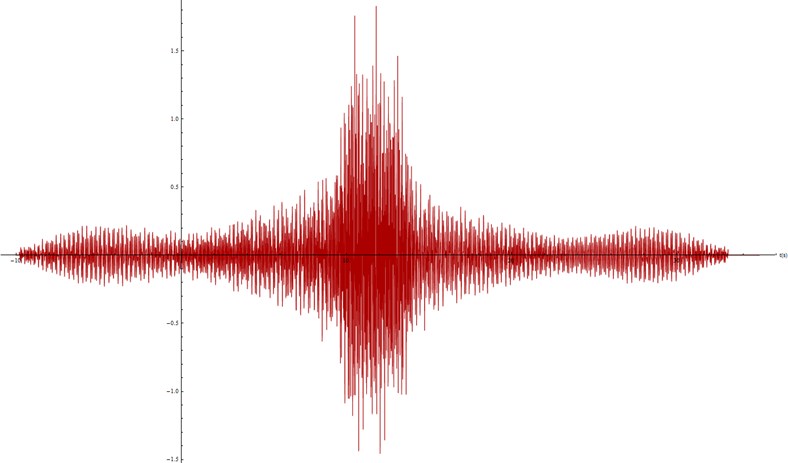
Fig. 18Modelled accelerations at the surface, E= 3e8 Pa
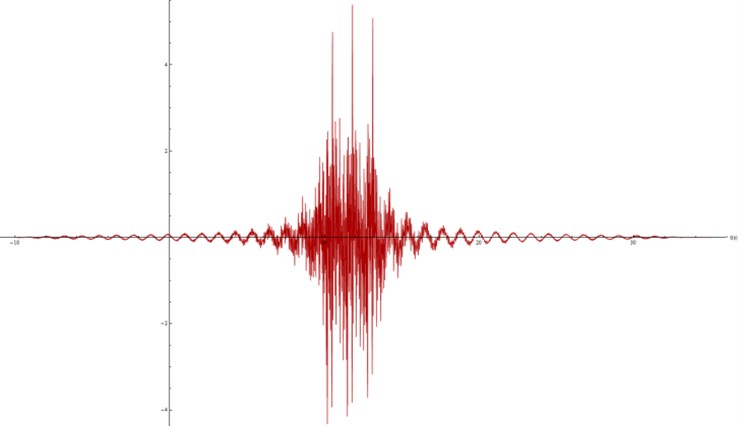
Fig. 19Acceleration spectra modelled at the surface, E= 3e10 Pa
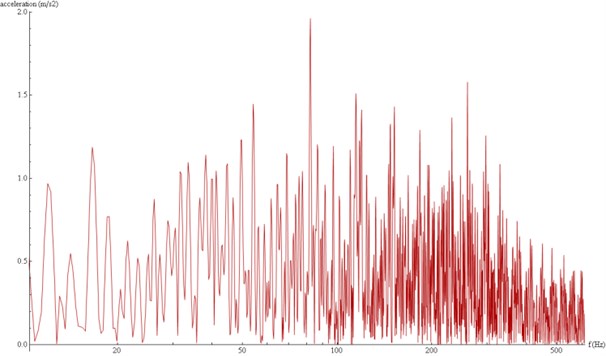
Fig. 20Acceleration spectra modelled at the surface, E= 3e8 Pa
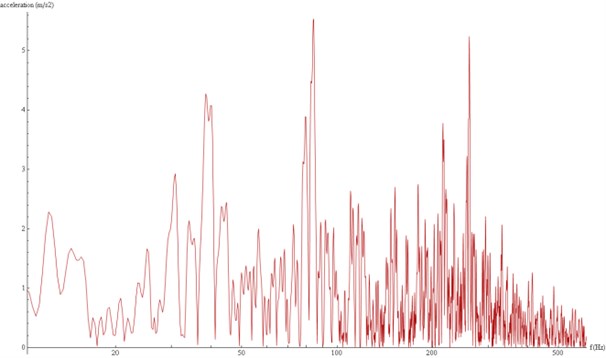
Table 8 shows the relation between the top layer stiffness (represented by the Young modulus, ), the maximum peak of acceleration modeled and the most abated frequency range. Once again it is clear that each value of implies certain frequency range abated. It is also observed from the Table that low frequency vibration seems to be predominant, as a higher induces a lower overall peak of acceleration. Therefore, in order to mitigate the full range of frequency, a combination of a very flexible material (e.g. an elastomer) with a quite rigid material (e.g. concrete) could be the most efficient choice. Otherwise, if only the low frequency range is to be abated, more rigid materials are clearly better.
Table 8Top layer stiffness, maximum acceleration peak and most abated frequency range
Young modulus (MPa) | Maximum peak (m/s2) | Most abated frequency (Hz) |
50 | 5.29 | > 1000 |
3000 | 4.82 | > 1000 |
5000 | 4.11 | > 1000 |
8000 | 3.51 | > 1500 |
15000 | 2.78 | < 800 |
30000 | 1.86 | < 800 |
Fig. 21Acceleration spectra modelled at the surface, ν= 0.2
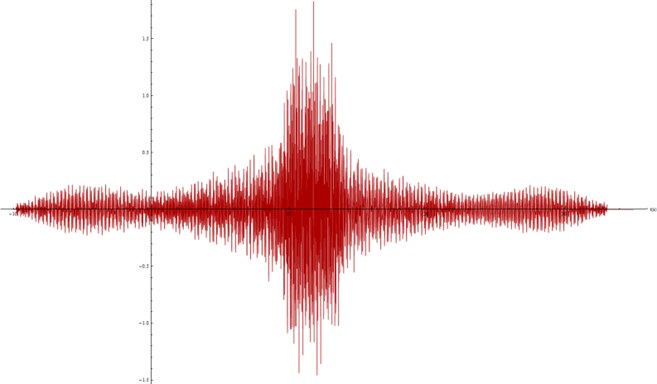
Fig. 22Acceleration spectra modelled at the surface, ν= 0.4
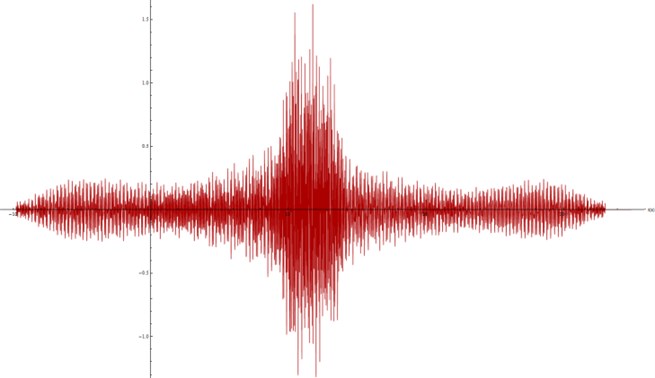
Finally, in order to assess the influence other mechanical parameters of the material may have in the vibration mitigation, Figures 21, 22, 23 and 24 show the accelerogram modeled on the surface with different values of density (2000 kg/m3 in Figure 23; 1500 kg/m3 in Figure 24) and Poisson’s ratio (0.2 in Figure 21; 0.4 in Figure 22).
Fig. 23Acceleration spectra modelled at the surface, ρ= 2000 kg/m3
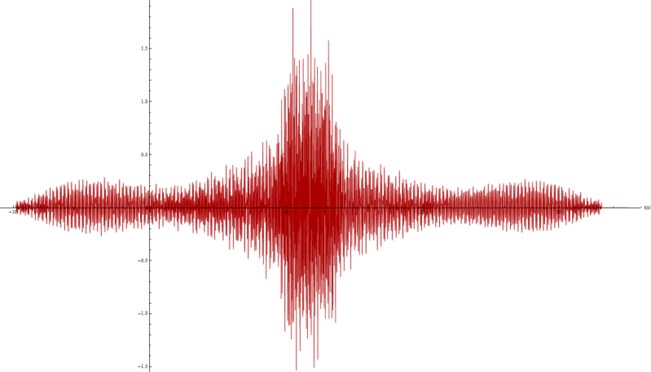
Fig. 24Acceleration spectra modelled at the surface, ρ= 1500 kg/m3
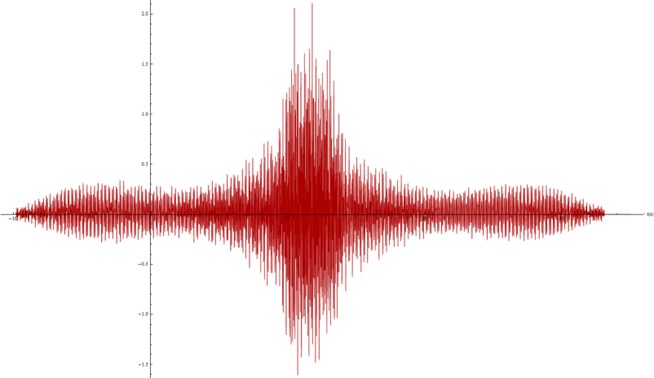
From Figures 23 and 24 it is clear that density by itself (with no changes in the rest of the parameters) does not have a direct influence in the way the material behaves. However, it is also clear that the mechanic characteristics of any material are strongly related to its internal structure and thus density may play a significant role due to its influence in other parameters.
As for the Poisson’s ratio, Figures 21 and 22 show that a significant increase of its value (0.4 vs. 0.2) causes a quite small alteration of the wave which affects neither the magnitude of the peaks nor the time of growth and decay. Therefore, the Poisson’s ratio has a reduced influence in the performance of the material against a vibration phenomenon.
5. Conclusions
Considering all the results shown and discussed in the previous section, certain conclusions can be worked out:
- There is a direct relation between the stiffness of the material (i.e. its Young Modulus) and its alleviation performance. More rigid materials such as concrete mitigate better low frequency peaks while more flexible materials such as elastomers are more efficient against high frequency peaks. Therefore, a combination of flexible and rigid materials may be more efficient than a single kind of material if the whole range of frequency must be alleviated. Otherwise, as the frequencies perceived by humans are those under 100 Hz, more rigid track typologies (e.g. concrete slab with a Young Modulus above 10000 MPa) will be far more efficient to mitigate that specific range of frequency, despite barely affecting higher frequency vibrations. These typologies, however, may be less appropriate in terms of noise generation.
- Other material parameters such as the Poisson’s ratio or the density have small or no direct influence in the way the vibration is transmitted and mitigated. However, those parameters may have certain indirect influence has they are strongly related between them and to the Young Modulus (particularly the density).
- Considering the overall alleviation of acceleration peaks, a rigid typology (concrete slab → above 10000 MPa) is much more efficient than a more flexible one (green track → around or below 10 MPa). However, more rigid typologies also transmit faster the wave generated by the trams as it takes more time to grow up and decrease than in the more flexible materials.
- Comparing the two elastomers studied in this paper, the EDILON elastomer has proved to be slightly better than the one developed by the UPV. This is due to the fact that, as flexible materials alleviate mostly high frequency accelerations, the more flexible they are (i.e. the lower Young Modulus they have), the more they mitigate the acceleration peaks due to high frequency vibration.
References
-
Grassie S. L. Dynamic modelling of railway track and wheelsets. Proceedings of the 2nd International Conference on Recent Advances in Structural Dynamics, Vol. 2, 1984, p. 681-698.
-
Grassie S. L. Dynamic models of the track and their uses. Proceedings of the International Conference on Rail Quality and Maintenance for Modern Railway Operation, 1993, p. 165.
-
Gupta S., Van den Berghe H., Lombaert G., Degrande G. Numerical modelling of vibrations from a Thalys high speed train in the Groene Hart Tunnel. Soil Dynamics and Earthquake Engineering, Vol. 30, 2010, p. 82-97.
-
Celebi E. Three-dimensional modelling of train-track and sub-soil analysis for surface vibrations due to moving loads. Applied Mathematics and Computation, Vol. 179, 2006, p. 209-230.
-
Wen-I L., Tsung-Jen T., Chau-Shioung Y. A method for the response of an elastic half-space to moving sub-Rayleigh point loads. Journal of Sound and Vibration, Vol. 84, 2005, p. 173-188.
-
Auersch L. Theoretical and experimental excitation force spectra for railway-induced ground vibration: vehicle-track-soil interaction, irregularities and soil measurements. Vehicle System Dynamics, Vol. 48, Issue 2, 2009, p. 235-261.
-
Metrikine A. V., Vrouwenvelder A. C. W. M. Surface ground vibration due to a moving train in a tunnel: two-dimensional model. Journal of Sound and Vibration, Vol. 234, Issue 1, p. 43-66.
-
Van Lier S. The vibro-acoustic modelling of slab track with embedded rails. Journal of Sound and Vibration, Vol. 231, Issue 3, 2000, p. 805-817.
-
Thompson D. J., Jones C. J. C., Waters T. P., Farrington D. A tuned damping device for reducing noise from railway track. Applied Acoustics, Vol. 68, 2007, p. 43-57.
-
Thompson D. J. Railway Noise and Vibration: Mechanisms, Modelling and Means. Elsevier, Oxford (UK), 2009.
-
Ahmad N., Thompson D. J., Jones C. J. C. and Muhr A. H. Predicting the effect of temperature on the performance of elastomer-based rail damping devices. Journal of Sound and Vibration, Vol. 322, 2009, p. 674-689.
-
Yuan J., Wu M. Z., Meng Z. B., Zhang K. Vibration isolation performance of floating slab track system. Proceedings of the Tenth International Symposium on Structural Engineering for Young Experts, Vol. 1 and 2, 2008, p. 1135-1140.
-
Markine V., de Man A., Jovanovic S., Esveld C. Modelling and optimization of an embedded rail structure. Rail International, Vol. 31, Issue 7, 2000, p. 15-23.
-
Çalim F. F. Dynamic analysis of beams on viscoelastic foundation. European Journal of Mechanics A/Solids, Vol. 28, 2009, p. 469-476.
-
Schevenels M., Lombaert G., Degrande G., Clouteau D. The wave propagation in a beam on a random elastic foundation. Probabilistic Engineering Mechanics, Vol. 22, 2007, p. 150-158.
-
Muscolino G., Palmeri A. Response of beams resting on viscoelastically damped foundation to moving oscillators. International Journal of Solids and Structures, Vol. 44, 2007, p. 1317-1336.
-
Sheng X., Jones C. J. C., Petyt M. Ground vibration generated by a harmonic load acting on a railway track. Journal of Sound and Vibration, Vol. 225, 1999, p. 3-28.
-
Koziol P., Mares C., Esat I. Wavelet approach to vibratory analysis of surface due to a load moving in the layer. International Journal of Solids and Structures, Vol. 45, 2008, p. 2140-2159.
-
Florez E. G., Cardona i Foix S., Jordi Nebot L. Time-frequency analysis of vibration signals taken on the foot from rail during pass of train. Sciencia et Technica, Vol. 35, 2007, p. 243-247.
-
Liao W. I., Teng T. J., Yeh C. S. A method for the response of an elastic half-space to moving sub-Rayleigh point loads. Journal of Sound and Vibration, Vol. 284, Issue 1-2, 2005, p. 173-188.
-
Salvador P., Real J., Zamorano C., Villanueva A. A procedure for the evaluation of vibrations induced by the passing of a train and its application to real railway traffic. Mathematical and Computer Modelling, Vol. 53, Issue 1-2, 2010, p. 42-54.
-
Real J. I., Martínez P., Montalbán L., Villanueva A. Modelling vibrations caused by tram movement on slab track line. Mathematical and Computer Modelling, Vol. 54, Issue 1-2, 2011, p. 280-291.
-
Real J. I., Asensio T., Montalbán L., Zamorano C. Analysis of vibrations in a modeled ballasted track using measured rail defects. Journal of Vibroengineering, Vol. 14, Issue 2, 2012, p. 880-895.
-
Real J. I., Asensio T., Montalbán L., Zamorano C. Analysis of vibrations in a modeled ballasted track using measured rail defects. Journal of Vibroengineering, Vol. 14, Issue 2, 2012, p. 880-895.
-
López A. Infraestructuras ferroviarias. Railway infrastructures, UPC, Barcelona, 2006.
-
Melis M. Introducción a la Dinámica Vertical de la vía y Señales Digitales en Ferrocarriles. Introduction to Vertical Track Dynamics and Digital Signals in Railways, UPM, Madrid, 2008.
-
ISO 2631-2. Mechanical vibration and shock-Evaluation of human exposure to whole body vibration. Part 2, Vibration in buildings (1 Hz to 80 Hz), International Organization for Standardization, 2003.
About this article
The authors wish to show their gratitude to:
GTP (Ente Gestor de la Red de Transporte y de Puertos de la Generalitat) for the information regarding the sections studied as well as for their permission to carry out measures in their tram network.
FGV (Ferrocariles de la Generalitat Valenciana) for the information regarding the vehicles and their support.
EDILON-SEDRA for the technical data of their elastomer.
Doctor Juan Rovira Soler (UPV) for the technical data of the elastomer developed in the UPV.
