Abstract
On the basis of the research on the morphology of the contact surfaces, a contact model is proposed, which regards the rough contact surfaces as the collections of elastic micro peaks. These micro peaks generate elastic contact force due to elastic deformation and the contact force has relationship to the morphology of the contact surfaces, the motion of the vibrator as well as the materials of the specimen and the vibrator. And using Newton’s second law to the specimen’s motion, the normal dynamical equation for the specimen with the actuation of the ultrasonic vibrator is established. Solving the dynamical equation, the normal kinetic function of specimen and the normal elastic contact force are obtained. Furthermore, the normalized contact time could be analyzed theoretically, which is defined as the ratio of contact time to period. The calculated results indicate that the normalized contact time decreases with the vibrator’s normal amplitude increasing, and increases with the standard deviation of the height of micro peaks on the contact surfaces. Finally, the average tangential velocity of the specimen, conveyed by a travelling wave ultrasonic feeding device, is discussed on the basis of the research on the normalized contact time. The formula of the specimen’s average tangential velocity is derived and it is the function of the normalized contact time, the tangential amplitude, the angular frequency and the phase difference of the tangential and the normal vibrations. Using this formula, the tangential velocity of the specimen is theoretically analyzed; in addition, the theoretical conclusions are compared with the experimental data.
1. Introduction
The history of the ultrasonic conveyance could go back to 1948 [1], but at that time this technology was not rapidly developed because of the limitations of the materials and the processing technology. Hereafter, the ongoing efforts were made by many scholars [2-5], but the conveyance by ultrasonic vibration didn’t go into a period of engineering applications until 1980s. During this period, standing wave ultrasonic motor [5] and traveling wave ultrasonic motor [6] were successively designed and made by Japanese scientists. Meanwhile, USA, Germany, France, Britain etc. have been putting in a lot of manpower and resources to develop the technology of ultrasonic conveyance [7, 8]. Nowadays, the ultrasonic motors are developing towards the directions of miniaturization and integration [9, 10], and the combination of ultrasonic vibrator and biomedical engineering is also the focus of discussion in this area [11].
With the development of ultrasonic motors, the modeling of ultrasonic motor rapidly developed. The researches were carried out on the influence of the hardness of the contact layer material, the high-frequency frictional mechanisms, motor operability and the appropriate control strategy etc. [12-15]. But these researches do however not describe the relation between the stator-rotor contact and the overall motor behavior. In 1995, Cao and Wallaschek focus on the contact layer bonded to the rotor substrate and developed a simple but useful contact model for the calculation of the torque-speed characteristics for different motor design parameters [16]. And then the similair contact models is successively proposed [17-19]. The first complete motor model relaying on design parameters was proposed by Hagood and Macfarland [20], which is important for designing the motors and controllers. Whereafter, Hagedorn and Sattel et al. extended the model proposed by Hagood and Macfarland by incorporating the rotor flexibility [21]. And Le Letty et al. developed a finite-element model together with a dynamic contact algorithm working in the time-domain [22]. On the basis of these works, some new model for special type ultrasonic motors were proposed in the last decade [23].
In recent years, as the expansion of ultrasonic motor [24-27], the ultrasonic feeding is gaining ever increasing attentions. The ultrasonic feedings have many advantages such as no electromagnetic interference, fast response, silence of vibration and stable running; furthermore, they have a longish service life due to the lower wear. With these advantages, the ultrasonic feedings have broad prospects in some fields asking for cleaning environment and low noise, such as conveying medicine and electronic components etc. [25, 26].
At present, the research on the ultrasonic feeding is still in its initial stage. Although the theory of the ultrasonic motor can be used for references, the contact between the vibrator and the specimen of the ultrasonic feeding is much more complicated than that of ultrasonic motor, for there is no precompression upon the slight and small specimen [26]. There are still many new problems that need to solve, such as the impacts, the vibrations and the adhesion in the contact process. All these need not only experimental researches but also the theoretical analysis.
To date, there are three mechanism of the ultrasonic feeding, namely, friction driving, wave action, boundary layer interaction [28, 29]. Based on these, some model for special type ultrasonic feeding were developed [28, 30] but these models mostly focus on the motion of the vibrator and as to the concerned velocity of the specimen or objects, there are only the rough formulas given. In practice, since there is no precompression upon the specimen, the contact of the specimen and the vibrator is non-linear, and the experiments on electric contact [24] have also proved that the specimens separate from the vibrator periodically. So without the quantitative research on the contact state, it is impossible for the derivation of the accurate formula of the velocity of the specimen driven by the ultrasonic feeding.
In this paper, the contact process of the travelling wave ultrasonic feeding is quantitatively researched, and the motion of the points on the working surface of ultrasonic feeding device can be resolved into the tangential motion and the normal motion. Thus the specimen’s motion actuated by such vibrator also can be resolved into the normal and the tangential motions. By analyzing the process of the specimen contacting the vibrator, a steady-state contact model is established, which account for influences of the vibrator’s vibration to the specimen’s motion, as well as the influences of the microstructure of the contact surfaces and the materials of the vibrator and the specimen. With this model, the contact force between the specimen and the vibrator is analyzed; furthermore, the definition of normalized contact time is defined as the ratio of the contact time to the period. The curves of the normalized contact time changing with the normal amplitude, the frequency and the other parameters are calculated. These results are the basis of understanding the tangential motion of the specimen. And the tangential motion of the specimen is analyzed on the basis of the research on the normal motion.
In the calculations of this paper, all the vibrators are considered as the copper vibrator and the specimens are all the copper cylinders whose heights and the diameters are all 6 mm.
2. Introduction to ultrasonic feeding device
Figure 1 shows a typical travelling wave ultrasonic feeding conveying a solid object. The vibrator is cyclic and placed horizontally. Using piezoelectric ceramic wafers, the vibrator can generate the normal and the tangential travelling waves propagating along the vibrator, these two waves have the same frequency, the same wavenumber and the constant initial phase difference. The object without load is small and light, which moves with the actuation of the vibrator.
As shown in Figure 1, the curvilinear coordinates system along the vibrator is introduced. and indicate the tangential and the normal directions of the point with the curve length apart from the origin (0), that is, the point with the curvilinear coordinate of . direction is along the tangent to the cyclic, and direction is perpendicular to the surface of the vibrator.
In the steady state, the tangential and the normal kinematical equations of some point on the ultrasonic vibrator’s working surface are expressed by:
where is the curvilinear coordinates of this point, and are the tangential amplitude and the normal amplitude respectively, and are the tangential and normal initial phases of this point, they are all the functions of .
Fig. 1The structure of a travelling wave ultrasonic feeding device and the curvilinear coordinates system fixed on the vibrator

If (, hence:
Eq. (3) indicates that the track of the mass point on the working surface is ellipse for (.
And the tangential and the normal velocities are:
Under consideration of the travelling waves propagating along the vibrator, the tangential and the normal displacements of the point with the coordinate ( are:
where is the angular wavenumber.
From all above, we can make a deduction that the movement of the solid specimen driven by the vibrator must be composed by the two movements in tangential and normal directions. In this paper, the normal and the tangential movements of the specimen are all going to be analyzed theoretically.
3. Statistical description of contact surfaces
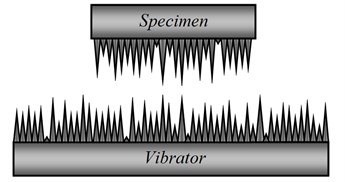
In this paper, the rough contact surfaces of the specimen and the vibrator are idealized as the collection of the discrete micro elastic peaks, with their heights obeying a specific normal distribution. The micro peaks are all fixed on the surface of the main part, as shown in Figure 2(a). Each peak can be regarded as a micro frustum of cone whose upper radius is far less than its lower radius , as shown in Figure 2(b).
Fig. 2The schematic diagrams of a) the contacting surfaces and b) the micro peak
(a)

(b)
The heights of the peaks on both the specimen and the vibrator meet the normal distribution. The distribution density functions are given by:
where and are the distribution density functions of the specimen’s peaks and the vibrator’s peaks. and denote the height of the micro peaks on the specimen and the vibrator. and are the expectations of the micro peaks’ height of the specimen and the vibrator. and are the standard deviations of the micro peaks’ height of the specimen and the vibrator.
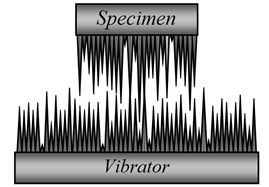
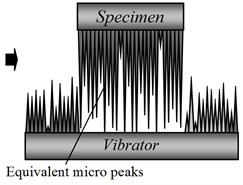
In this theoretical analysis, the assumptions are made that the vibrator’s peaks one-to-one make contact with the specimen’s and the interaction between the neighboring micro peaks on one rough surface can be ignored. So the highest micro peaks of the two surfaces make contact with each other to form the new equivalent elastic peaks firstly, and then the higher peaks of the two surfaces meet to form more equivalent elastic peaks during the contact process, as shown in Figure 3. Therefore, this normal contact between the specimen’s peaks and the vibrator’s peaks can be regarded as the normal contact between the surface of the vibrator and the discrete equivalent elastic peaks fixed on the specimen, as shown in Figure 3(b).
Fig. 3The schematic diagrams illustrating the equivalent micro peaks
(a)
(b)
And the other assumption is that the equivalent elastic peaks have one-dimensional linear elastic deformation which meets the Hook’s law. In addition, all the upper radii as well as the lower radii of the equivalent micro peaks are the same. The upper radii of equivalent peaks are represented by a, and the lower by . The height of the equivalent elastic peaks meets the normal distribution:
where , and In addition, and can be replaced by and , respectively. and are the roughness average of the specimen and the vibrator respectively.
4. Elastic force of micro peak
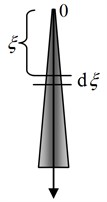
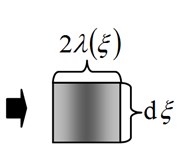
The micro peak with the height is regarded as the frustum of cone whose upper radius is far less than its lower radius . In addition, it is believed that the micro peak consists of a large number of volume elements. Here a particular volume element of the peak is analyzed, seeing Figure 4, of which the height is .
Fig. 4The schematic diagrams of the volume element of the peak: a) the micro peak; b) the volume element
(a)
(b)
Because is very small, this element can be regarded as a small cylinder whose radius is denoted by , as shown in Figure 4. According to geometry, can be given by:
where is the coordinate of this element. If deformed, the peak will generate the elastic force which denoted by . And the deformation of the peak’s elements meets Hook’s law, hence:
where is Young’s modulus of the micro peak and is the change of this volume element’s height. Integrating Eq. (12), the total change of the micro peak’s height is given by:
For equivalent micro peaks, should be replaced by equivalent Young’s modulus:
where , are the Young’s moduli of the specimen and the vibrator repectively.
5. Normal contact force between specimen and vibrator
As shown in Figure 5, when the distance between the specimen and the vibrator is , all the equivalent micro peaks of will deform, the height change of the equivalent peak of can be given by . And the elastic force of the equivalent peak with the height can be given by Eq. (13).
Fig. 5The schematic diagram illustrating the normal contact force
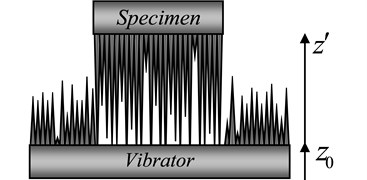
Because meets the normal distribution, the number of the equivalent micro peaks of the height can be given by:
where is the total number of the equivalent micro peaks. Here only cylindrical specimen is considered and the surface of the vibrator is big enough, so can be estimated by:
where denotes the radius of the cylindrical specimen and it is far greater than . The normal contact force between the specimen and the vibrator is the sum of the elastic forces of the equivalent peaks of , hence:
6. Normal dynamical equation of specimen
As shown in Figure 5, the one-dimensional coordinate system is established. is the normal coordinate of the vibrator’s surface relative to the ground (inertial system). is the normal coordinate of the specimen relative to the vibrator’s surface (noninertial system). The normal coordinate of the specimen in the inertial system is given by . The dynamical equation of the specimen in the noninertial system has the following form:
where is normal contact force given by Eq. (17), is normal damping coefficient, is the normal external forces, except the normal contact force, applied on the specimen; for the specimen of such ultrasonic feeding, .
In steady-state, the normal kinematical equation of the point with the coordinate , seeing Figure 1, on the vibrator’s working surface is:
where , , is the normal amplitude, the angular frequency and the initial phase of the point with the curvilinear coordinate , and is the function of .
Via solving the Eq. (18), can be obtained, and then can be calculated by Eq. (17). Thereby, the contact state of the specimen and the vibrator can be discussed as fellows: when 0, the specimen makes contact with the vibrator, when 0, the specimen separates from the vibrator.
7. Theoretical analysis of normal motion of specimen
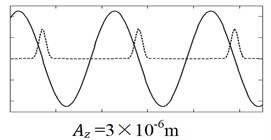
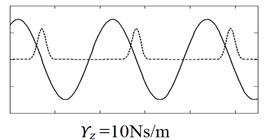
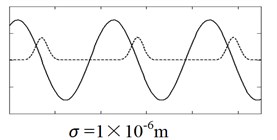
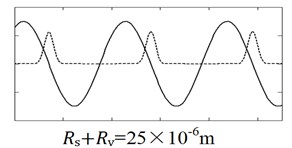
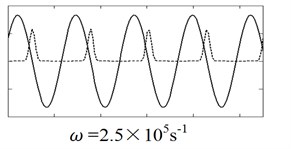
Figure 6 and Figure 7 show the typical calculated curves of the and . The calculated results indicate that has the same period as , and the phase difference of the maximum of and the maximum of always approaches to . Furthermore, see Figure 6 and Figure 7, it is obvious that the contact force approaches to the maximum at the instant when the vibrator’s normal velocity approaches to zero from the positive maximum. This means that the maximum of the contact force appears at the instant when the normal displacement of the point on the vibrator’s working surface approaches to the positive maximum. This calculated result coincides with the educated imagining of the actual contact process that the elastic contact force gets the maximum when the vibrator gets to the highest point and results in the maximal deformation of the equivalent micro elastic peaks.
Fig. 6The relationship between the normal contact force and the normal velocity of specimen. Solid line is velocity curve vz and dash line is contact force curve Fc. Az= 2×10⁻⁶ m, ω= 1.5×10⁵ s-1, Rs+Rv= 2×10⁻⁶ m, σ= 5×10⁻⁷ m, γz= 1 Nms-1
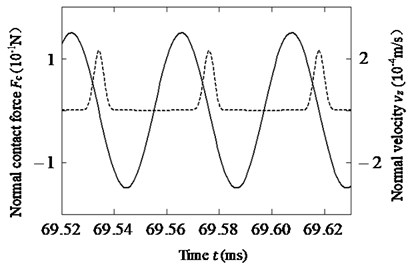
Fig. 7The calculated curves showing the relationship of the normal velocity and the normal contact force. Solid line is velocity curve vz(t) and dash line is contact force curve Fc(t). Except for the parameters showing in figures, the other parameters: Az=2×10⁻⁶ m, ω= 1.5×10⁵ s-1, Rs+Rv= 2×10⁻⁶ m, σ= 5×10⁻⁷ m, γz= 1 Nms-1 respectively
(a)
(b)
(c)
(d)
(e)
According to this model, when , the specimen and the vibrator make contact with each other; when , the specimen and the vibrator separate. So Figure 6 and Figure 7 indicate that the specimen and the vibrator touch and separate periodically, while periodically varies from zero to the maximum; and the contact period equals to the period of the vibration. In this paper, the symbol is used to indicate the contact time when the specimen touches the vibrator. And the ratio of the contact time to the vibration period is defined as the normalized contact time :
Figure 8 shows the calculated curve of changing with . This curve indicates that the normalized contact time hardly changes with the normal damping coefficient. So in the following calculation, the effects of the normal damping coefficient are not considered.
Fig. 8The relationship between the normalized contact time tnc and normal damping coefficient γz. The other diameters are in the legend
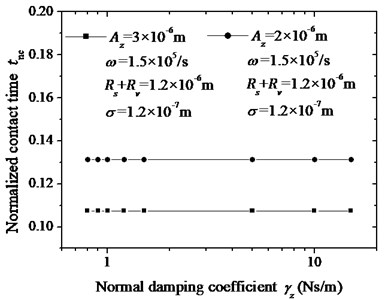
Figure 9 shows the calculated curve of changing with and . This curve indicates that the normalized contact time rapidly decreases with the normal amplitude increasing, and hardly changes with the angular frequency. By fitting the calculated results, it is found that the decrease of the normalized contact time with the normal amplitudes satisfies the exponential decay. In Figure 9, the scatter plots are the calculated results and the solid line is the fitting curve. It is found from the fitting curve that the function of the normalized contact time decreasing with the normal amplitude has the following form:
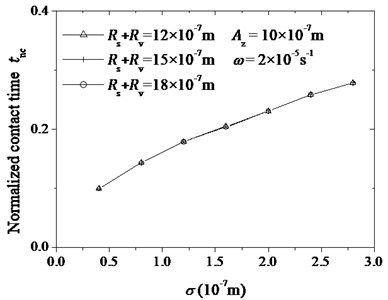
Figure 10 shows the calculated curves of changing with and . This curve indicates that the normalized contact time increases with the standard deviation, and hardly changes with the roughness. According to the statistical theory, the standard deviation represents the degree of the uniformity of the micro peaks. Therefore, Figure 10 indicates that the more uniform the micro peaks are, the smaller the normalized contact time is.
From Figure 8, Figure 9 and Figure 10, the following conclusions can be drawn that the normalized contact time has no relation to the normal damping coefficient , the angular frequency and the roughness of the contact surfaces , and it is the function of the normal amplitude and the standard deviation , it decreases with increasing and increases with increasing.
Fig. 9The relationship of the normalized contact time tnc and the normal amplitude Az as well as the angular frequency ω. The scatter plots are the calculated results and the solid line is the fitting curve. The value of angular frequency is shown in legend
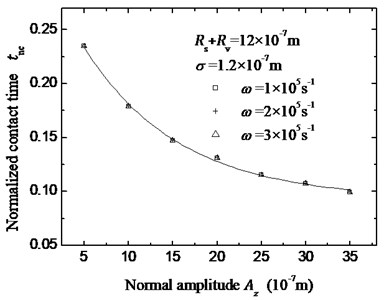
Fig. 10The calculated curve of the normalized contact time tnc changing with (Rv+Rs) and σ The value of (Rv+Rs) is shown in legend
8. Assumptions of tangential motion
In this paper, the assumptions on the tangential motion are made as fellows.
(1) When the specimen and the vibrator make contact with each other, their interaction force is statical friction force. Thus, when they make contact with each other, they have the same tangential velocity.
(2) While the specimen separating from the vibrator, the specimen’s tangential velocity doesn’t change and equals to the tangential velocity at the time instant when it separates from the vibrator, until the specimen touches the vibrator once more.
(3) The specimen is idealized as a mass point when it touches the vibrator’s working surface.
9. Average tangential velocity of specimen
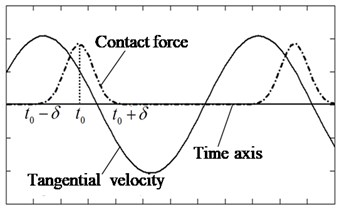
The curves in Figure 11 describe the vibrator’s tangential velocity of the point with the coordinate and its normal contact force changing with time. From Figure 11, the following is found.
(1) During the time interval , , and the specimen touches the vibrator. According to the assumptions above, when they touch each other, they have the same tangential velocity. So the specimen’s tangential velocity during this interval is the same as the vibrator’s tangential velocity. And the specimen’s tangential displacement is:
(2) If , . This means that the specimen and the vibrator separate from each other. So during this interval, the specimen keeps the constant tangential velocity until it touches the vibrator once more on the other point. Its constant tangential velocity is given by:
Fig. 11The schematic representation of the contacting state of the point with the coordinate s. The solid curve is the vibrator’s tangential velocity, and the dash curve is the normal contact force
Considering that the phase difference between the successive initial contact instants (i. e. the instant when the specimen begins to touch the vibrator) must be , using the Eq. (6) or Eq. (7), the time interval for specimen to touch the vibrator once more satisfies the following equation:
So the interval is:
and the tangential displacement during this time interval is given by:
where is the time instant for the maximal contact force appearing. The symbol represents the phase difference of the maximal contact force and the maximal normal velocity. Considering that the phase angle of the maximal normal velocity must be (), is an integer, the following is obtained:
See Figure 11, is the contact time of the point with coordinate . As mentioned above, the ratio of the contact time to the period of the vibration is defined as the normalized contact time . Thus the following is found:
Hence,
where is the phase difference of the point with the curvilinear coordinate , it always equals to the initial phase difference of the origin.
So the change in tangential direction during the time interval is:
Thus the specimen’s average tangential velocity is:
In many instances, , and is so small as to be only several microns, so 1, and thus the Eq. (34) is simplified as:
It is found from Eq. (35) that the average tangential velocity is a function of , and . is a function of . In other words, if , and 1, the specimen’s average tangential velocity is a function of frequency, tangential amplitude and normal amplitude of the ultrasonic vibrator.
10. Discuss on calculated average tangential velocities
Using Eq. (34), Figures 12-14 are obtained.
Under the condition depicted in the legend of the Figure 12, the curves in Figure 12 indicate that when is from 1 m to 2.5 m, the average tangential velocity of the specimen is proportional to the frequency as well as the tangential amplitude. This is the same as what is indicated by Eq. (35). This also proves that, if , and , the average tangential velocity satisfies the simplified formula represented by Eq. (35).
Notice from Eq. (34) that the average tangential velocity has no direct relationship with the normal amplitude of the vibrator, but has relationship with the normalized contact time . According to the calculated results in Figure 9, the normalized contact time decreases with the normal amplitude ; and for 0.5 m 3.5 m, the normalized contact time decrease with the normal amplitude as exponential decay and isn’t greater than 0.5. Thus, the normal amplitudes of vibrator have consequences in the specimen’s average tangential velocity by changing the normalized contact time. In this case, using Eq. (31), it is found that, while the normalized contact time decreases with the normal amplitude increasing as mentioned above, the magnitude of the constant velocity of the specimen increases. Whereas, the interval of the Eq. (30) is roughly unchanged, for the . So the value of calculated by using Eq. (32) becomes greater while the vibrator’s normal amplitude increasing. Meanwhile, in this case, , the change of could be ignored. So the average tangential velocity increases with the vibrator’s normal amplitude increasing, just as shown in Figure 13.
Fig. 12The calculated curves of the specimen’s average tangential velocity ν changing with frequency (ω/2π) and tangential amplitude Aτ. The tangential amplitudes and the other parameters are given by legend
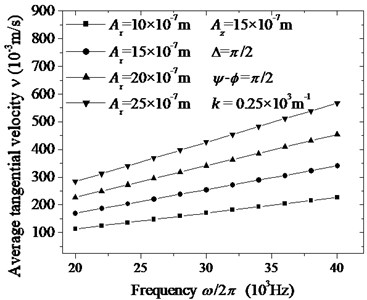
Fig. 13The calculated curves of the specimen’s average tangential velocity ν changing with normal amplitude Az and frequency (ω/2π). The frequencies and the other parameters are given by legend
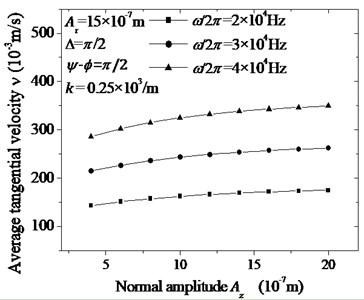
Moreover, if the vibrator’s normal amplitude approaches zero, the specimen never separates from the vibrator, thus the normalized contact time approaches 1. Under such condition, using Eq. (29), is zero, using Eq. (30), is zero, and further also is zero. Substituting and into Eq. (34), the average tangential velocity is zero, that is, the specimen vibrates with vibrator in tangential direction and has no macroscopic tangential displacement. On the other hand, if approaches 0.5 and , , the specimen’s constant tangential velocity calculated from Eq. (31) is zero; in this case, the main part of the specimen’s tangential displacement is , and the average tangential velocity became smaller and approaches , which is just in accordance with the result of the Eq. (35).
To sum up, for the ultrasonic vibrator of which the phase difference of the tangential and the normal vibrations is , the normal amplitude must not be too small in case the normalized contact time is too big.
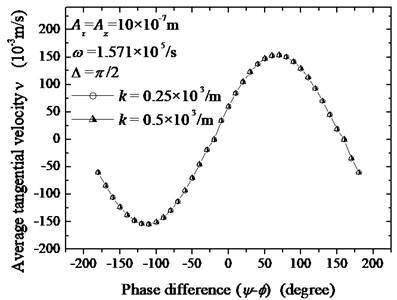
Figure 14 shows the calculated specimen’s average tangential velocity changing with the phase difference and the angular wavenumber. The calculated results indicate that the angular wavenumber has no obvious correlation with the average tangential velocity of specimen . But the phase difference obviously influences the average tangential velocity of specimen. Under the condition depicted by the legend in Figure 14, if approaches , that is, if the track of the points on the vibrator’s working surface is ellipse, the magnitude of the specimen’s average tangential velocity approaches the maximal value. This can be analyzed in more detail: when is very small compared with 1, the main part of the tangential displacement is and change with phase angle () as a sinusoidal function for , because in Eq. (32) is roughly unchanged in this instance. As is well known, sine function has the maximal value when the phase angle is . In the instance depicted in Figure 14, is very small, and thus the maximum of the average tangential velocity appears when approaches
Whereas, if approaches 0 or and is very small, calculated by Eq. (29) approaches zero, calculated by Eq. (32) is also very small. So, seeing Eq. (34), the average tangential velocity is roughly zero when is around 0 or , just as shown in Figure 14.
From Figure 14, it is found important to optimize the phase difference of the tangential and the normal vibrations to approach in order to obtain the maximal average tangential velocity.
Fig. 14The theoretical relationship between the specimen’s tangential velocity and the phase difference
11. Discuss on the experimental results
In the laboratory, the experiments to research the average tangential velocity were accomplished by author’s team [30]. The devices are shown as the Figure 1.
The cyclic vibrator is made of copper, whose outer diameter and inner diameter are 100 mm and 80 mm respectively. It works in two different modes and . The parameters of the two modes are given in Table 1. The specimen in this experiment is a copper cylinder and its height and diameter are all 6 mm. As shown in Figure 1, FS-V31 optical fiber sensor is applied to measure the average tangential velocity.
Table 1The parameters of the vibration modes
1.08 m | 1 m | 24.69 kHz | 0.24 / mm | ||
1.485 m | 1 m | 39.31 kHz | 0.31 / mm |
Under the conditions of and , the experimental values of the specimen’s average tangential velocities are 148.38 mms-1 and 316.65 mms-1 respectively [30].
Taking the parameters of the Table 1 into Eq. (34), the calculated values of the average tangential velocity are found to be 144.269 mms-1 and 315.834 mms-1. The calculated results are roughly identical to the experimental results. At the same time, the calculated results by using Eq. (35) are 144.268 mms-1 and 315.832 mms-1. It is once again proved that, if , and , the simplified formula represented by Eq. (35) gives the same results as Eq. (34).
Another experiment on the specimen’s tangential motion is also accomplished by this team [31]. The experimental device is shown in Figure 15 [31].
The piezoelectric vibrator is elastic straight beam which have proper structure to synchronize the vibrations of all mass points on the working surface. So every point on vibrator’s working surface has the same amplitude, the same frequency and the same initial phase. The two piezoelectric ceramic wafers are applied to generate vibrations in direction and direction. All the points actuated by such two vibrations on the working surface rapidly move in step along the same ellipse in the plane . The semi-major axis and the semi-minor axis are controlled by the voltage amplitudes and [31].
The specimen actuated by such vibrator must has an average tangential velocity satisfying Eq. (34) with 0. If a cantilever is placed close to the specimen’s initial position, while the specimen begins to move, the cantilever should have a bending deformation. And it is certain that there is some correlation between the specimen’s tangential velocity and the deformation of the cantilever. Anyhow, it must be educated guess that the specimen has no macroscopic displacement while deformation of the cantilever is zero, and the greater deformation indicates that the specimen has the greater average tangential velocity.
Fig. 15The schematic representation of the experiment on the specimen’s tangential motion

The experimental results indicate that if either or is zero, the deformation of the cantilever is zero; if , the deformation of the cantilever approaches zero; and if , the deformation approaches the maximum. This could be understood as follows: if either or is zero, the specimen’s average tangential velocity is zero; if , the specimen’s average tangential velocity also approaches zero; and if , the specimen’s average tangential velocity approaches the maximum. Such results agree with the calculated results above.
12. Conclusions
The specimen’s motion with actuation of the vibrator of the ultrasonic feeding is considered as the composition of the tangential and the normal motions.
In the normal direction, the normal contact force arises by the elastic deformation of the equivalent micro peaks whose heights satisfied a specific normal distribution. Using the Newton’s second law of motion, the dynamic equation of the specimen’s motion is established, of which the solution is used to calculate the normal contact force and analyze the contact process. The calculated results imply that the specimen touches the vibrator periodically, and the period equals to that of the vibration. And the maximum of the contact force always appears at the instant when the vibrator’s normal displacement approaches the positive maximum. So the phase difference of maximum of the contact force and the maximum of the vibrator’s velocity always approaches .
The ratio of the contact time to the period is defined as the normalized contact time. The calculated results show that the normalized contact time has no relationship with the angular frequency, the normal damping coefficient and the roughness average. And it increases with the standard deviations of the equivalent peaks’ heights and decreases with the normal amplitudes increasing. The standard deviation represents the degree of the uniformity of the equivalent peaks’ height. So the more uniform the equivalent micro peaks are, the smaller the normalized contact time is.
And in tangential direction, the average specimen’s tangential velocity is proportional to the vibrator’s tangential amplitude and the vibrator’s frequency for , and , according to the model of this paper. The vibrator’s normal amplitude influences the specimen’s tangential velocity by changing the normalized contact time. In general, the normalized contact time decrease with the vibrator’s normal amplitude increasing. If the vibrator’s normal amplitude is so small as to cause to be 1, the specimen has no macroscopic tangential displacement; if approaches 0.5, the specimen’s average tangential velocity also becomes small and approaches to ; and if is less than 0.5 and , and , the specimen’s average tangential velocity increases with the vibrator’s normal amplitude increasing. Thus, under the condition of , and , the specimen’s normal amplitude must be not too small in case that is too big.
Meanwhile, the vibrator’s phase difference of the tangential motion and the normal motion also has effects on the specimen’s tangential motion. The calculated results indicate that if approaches , the specimen’s average tangential velocity approaches its maximum; if approaches 0 or , the specimen’s average tangential velocity is roughly zero. And so it is important to optimize the phase difference of the tangential and the normal vibrations to approach in order to obtain the maximal average tangential velocity. Furthermore, the experiments on the specimen’s average tangential velocity are analyzed in detail. The experimental results coincide with the theoretical results calculated by using this model.
References
-
Willams W., Brown W. Piezoelectric motor. US Patent, 1948, p. 8-20.
-
Barth H.V. Ultrasonic Drive motor. IBM Technical Disclosure Bulletin, 1973.
-
Vishnevsky V., Kavertsev V., Kartashev I., et al. Peizoelectric motor structures. US Patent, 1975, p. 8-12.
-
Vasiliev P., Klimavichjus R., Kondratiev A.,et al. Vibration motor control. UK Patent, 1979, p. 11-21.
-
Sashida T. Trail construction and operation of an ultrasonic vibration driven motor. Oyo Butsiuri, Vol. 56, Issue 6, 1982, p. 713-718.
-
Sashida T. Motor device utilizing ultrasonic oscillation. US Patent, 1984, p. 5-16.
-
Zhao C.S. Ultrasonic motor techniques for 21st Century. Engineering Science, Vol. 4, Issue 2, 2002, p. 86-91.
-
Zhao C.S. Some proposals for development of ultrasonic motor techniques in China. Micromotors Servo Technique, Vol. 8, 2005, p. 64-69.
-
Fujimoto A. M., Sakata M., Bart M.,et al. Miniature electrostatic motor. Sensor and Actuators, 1990, p. 43-46.
-
Koc B., Cagatay S.,Uchino K. A Piezoelectric motor using two orthogonal bending modes of a hollow cylinder. IEEE Transactions on Ultrasonics, Ferroelectrics and Frequency Control, Vol. 4, Issue 49, 2002, p. 495-500.
-
Higuchi T., Arai T. Developmet of a micro-manipulation system having a two-fingered micro-hand. IEEE trans. Rovot. Autom. Vol. 15, 1999, p. 152-162.
-
Endo A., Sasaki N. Investigation of frictional material for ultrasonic motor. Japanese Journal of Applied Physics, Vol. 26, Issue 1, 1987, p. 197-199.
-
KamanoT.,et al. Characteristics and model of ultrasonic motor. Japan. J. Appl. Phys, p. 189-191.
-
Maas J.,et al. Model-based control of traveling wave type ultrasonic motors. Proc. of 3rd Int. Heinz Nixdorf Symposium, Heinz Nixdorf Institut, University of Paderborn, 1999.
-
Rehbein P., Wallaschek J. Friction and wear behaviour of polymer/steel and alumina/alumina under high-frequency fretting conditions. Wear, Vol. 216, 1998, p. 97-105.
-
Cao X., Wallaschek J. Estimation of the tangential stresses in the stator/rotor contact of travelling wave ultrasonic motors using visco-elastic foundation models. Contact Mechanics II, 1995, p. 53-61.
-
Sattel T., Hagedorn P., Schmidt J. The contact problem in ultrasonic traveling wave motors. Journal of Applied Mechanics, Vol. 77, Issue 3, 2010.
-
Schmidt J. Ein mechanisches modell des Stator-Rotor-Kontaktes beim Ultraschall-Wanderwellen-Motor. PhD thesis, Darmstadt University of Technology, Germany, 1999.
-
Schmidt J., Hagedorn P., Bingqi M. A note on the contact problem in an ultrasonic travelling wave motor. Int. J. Non-Linear Mechanics, Vol. 31, Issue 6, 1996, p. 915-924.
-
HagoodIV N. W., McFarland A.J. Modeling of a piezoelectric rotary ultra-sonic motor. IEEE Trans. on Ultrasonics, Ferroelectrics, and Frequency Control, Vol. 42, Issue 2, 1995, p. 210-224.
-
Hagedorn P., Sattel T., Speziari D., Schmidt J., Diana G. The importance of rotor fexibility in ultrasonic traveling wave motors. Smart Mater. Struct., Vol. 7, 1998, p. 352-368.
-
Le LettyR.,et al. Combined finite element-normal mode expansion methods in elcetroelasticity and their application to piezoactive motors. International Journal for Numerical Methods in Engineering, Vol. 40, 1997, p. 3385-3403.
-
Zohra Kebbab F., Boumous Z., Belkhiat S. Traveling wave ultrasonic motor type Daimler-Benz AWM90–X: modeling and simulation mechanical characteristics. Journal of electrical systems, 2009, p. 24-29.
-
HE Q., WU A. Z. Test and analysis of a dynamic contact process of the ultrasonic feeding. Mechanical Science and Technology for Aerospace Engineering, Vol. 28, Issue 9, 2009, p. 1130-1134.
-
Mracek M, Wallaschek J. A system for powder transport based on piezoelectrically excited ultrasonic progressive waves. Materials Chemistry and Physics, Vol. 90, 2005, p. 378-380.
-
He Q., Wang H. X.,Yu W. Study of a novel feeding device with vibration of high frequency and low amplitude. Mechanical Science and Technology for Aerospace Engineering, Vol. 26, 2007, p. 758-760.
-
Ueha S., Tomikawa Y. Ultrasonic motors – theory and applications. Clarendon, Oxford, 1999.
-
Yang Y., Li X. C. Experimental and analytical study of ultrasonic micro powder feeding. J. Phys. D: Appl. Phys., Vol. 36, 2003, p. 1349-1354.
-
Nyborg W. L. M. Acoustic streaming. Physical Acoustics, ed. W. P. Mason, New York: Academic, 1965, p. 355-358.
-
He Q., Dong R. F., Wang H. X. Research on the feeding ability of ultrasonic experimental apparatus for solid objects. Piezoelectrics and Acoustooptics, Vol. 32, Issue 1, 2010, p. 145-148.
-
He Q., Wang Y.,Wang H. X. Experimental research on micro-friction driving force of ultrasonic vibrating feeding system. Piezoelectrics and Acoustooptics, Vol. 33, Issue 3, p. 407-410.
About this article
This paper is supported by the National Natural Science Foundation of China (50675094). This support is gratefully acknowledged.
