Abstract
The aim of the work is to determine of the complex influence of pathology degree and type as well as blood flow turbulence on blood pressure and stress patterns and values in the pathology blood vessels and to find out of the most dangerous pathology cases. Atherosclerosis with single symmetric plated stenosis, symmetric double plated and asymmetric plated stenosis and aneurysm influence on the blood pressure, stresses and flow rate in the pathologic blood vessels were analyzed. Some blood vessels pathological contact points were obtained by ultrasonic double-scanning duplex method. The calculations show us that blood flow rate in damaged blood vessel areas depending on blood pressure could be 3.4 times bigger than in healthy blood vessels and stresses depending on the pathology type – up to 6.8 times bigger. The most dangerous pathology is double symmetric stenosis case. Turbulent blood flow increases blood pressure and stresses in pathology area up to 1.8 times, as compared to laminar flow. It was found out that blood vessel damage degree has the biggest influence on local blood pressure and stresses.
1. Introduction
Many people in the world die of cardiovascular dysfunction: atherosclerosis, aneurysms, arterial deflections and other irregularities. Such irregularities change blood vessel radius, wall thickness, strength properties and other parameters [1, 2, 3, 4]. Depending on formed damage degree and type, blood flow rate, blood pressure and stresses in damaged blood vessels areas are significantly increased and changes of blood flow patterns appear. Such changes affect blood vessel wall and cause critical stresses in damaged blood vessel areas that can cause blood vessels splits [5, 6]. Most of blood pressure and stresses research results are fragmentary because of a lack of: 1) an analysis of the complex influence of the pathology degree and kind on the distribution of stresses and pressure along the length of a blood vessel; 2) a comparative analysis of the influence of pathology of different degrees and kinds in damaged blood vessels and blood flow turbulence on blood pressure and stresses in pathology area [7, 8, 9, 3].
Many scientists use different diagnostic experimental ways, such as ultrasonic double-scanning duplex method, to determine vascular pathologies and some studies have been carried out by invasive method [10, 11]. On measuring blood pressure, general increase in blood pressure is set; however, it is difficult to determine blood pressure in damaged blood vessels areas, because it is local blood pressure and its value could vary even few times from total pressure [12, 13]. Using experimental measurement of blood pressure, only for certain patients with certain pathology, mentioned above blood pressure could be set, but to determine pressure, blood vessels walls tensions dependence on the size of pathology it is practically impossible. Besides, experimental diagnostic researches need sophisticated equipment [10, 11]. There are inaccuracies while determining experimental values. However, there are digital methods which allow to model these processes varying degrees of pathology in a wide range [14, 15, 16], and to obtain sufficiently accurate results. These digital methods could append obtained experimental results and let have much more detailed information about blood flow velocity variations, blood pressure and tensions in the damaged blood vessels areas.
Using numerical methods, we could wider evaluate the complex influence on blood flow velocity variations, blood pressure and tensions value in the pathology blood vessels areas, assessing human age, gender and other parameters.
The aim of this work – to determine the complex influence of pathology degree and type as well as the blood flow turbulence on blood pressure and stresses patterns and values in the pathology blood vessels and to determine the most dangerous pathology cases.
2. Methods
Atherosclerosis with single symmetric plated stenosis, symmetric double plated and asymmetric plated stenosis and aneurysm influence on the blood pressure, stresses and flow rate in the pathologic blood vessels were analyzed. Navier-Stokes and elastic body deformation equations were used to solve this task.
Some blood vessels pathological contact points were obtained by ultrasonic double-scanning duplex method [17]. Atherosclerosis-caused (Figure 1) damage degree was from 0 to 95 %. Expanding aneurysm (Figure 2) varies up to 250 %.
Fig. 1Arterial stenosis
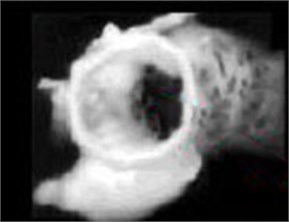
Fig. 2Arterial aneurysm

Investigation was performed upon applying ANSYS 12 software package. Using the finite elements method, linear two-dimensional and three-dimensional blood vessels models were formed of rectangular and cubic finite elements. Different step finite elements grid was applied. To determine precisely the maximum values of stresses and pressure, the above-mentioned grid in the damaged areas was compacted [17]. Using the initial results of the modeling as a base, the volumes of blood vessel models were divided to 1800 finite elements; cycles of 10, 40 and 80 iterations were applied. On presetting the coordinates, the grid was compacted two times in points of pathology [6, 17].
For investigation the turbulent flow upon using scientific references [18, 19], k-E turbulence model was chosen. For the calculations, turbulent blood flow in the vessels was chosen: blood is incompressible Newtonian fluid; the average statistical blood flow velocity in systolic pressure v=0.5 m/s (blood flow is normal); dynamic viscosity of blood μ=0.0035 kg/ms; blood density ρ=1060 kg/m3; t=37°C; blood flow is impulsive in nature, cycle duration 0.8 s, where 0.4 s – systole, that is blood supply, and 0.4 s – diastole. To describe blood flow patterns, sinusoidal law was used [17].
The following assumptions will be used in the work: blood is a Newtonian fluid, blood dynamic viscosity μ=const [20]; when there is laminar blood flow, Reynolds number Re=1700, turbulent blood flow – Re=7800; blood temperature is constant t=const; blood vessel has linear elasticity characteristic E=const [19]; stationary blood flow in the segment is not pulse like, because blood system almost always is pulse like [21]; the chosen blood vessels are free of mechanical defects, wall thickness is the same; there is normal stress in the blood vessel wall and shear stress is second and is not evaluated.
The blood flow was examined by solving Navier-Stokes equations for equilibrium form Newtonian fluids, Cartesian coordinate system with coordinates (x,y,z), the operator is defined in terms of partial derivative operators as [19]:
continuous flow equation:
where ρ is the fluid density; v is the flow velocity; ∇ is the del operator; ∇p is the gradient of pressure of surfaces; μ is the (constant) dynamic viscosity; f is stands for other body forces; p is the pressure.
The main finite elements elastic body matrix equations (3) and (4) are:
where [Ms], [Mf] – mass matrixes; [Ks], [Kf] – stiffness matrixes; {P}, {¨P} – pressure and second derivative of pressure variation matrixes; [R] – connection matrix; [R]T – transpose connection matrix; {Fs}, {Ff} – forces variation vectors; ρ0 – density; {U} and {¨U} – displacements and second derivative of displacements variantion matrixes. [R] matrix unites the impact of the fluid upon an elastic body, i. e. unites the equations (1) and (2) with the equations (3) and (4) [6, 17].
On making the calculations, it was considered that blood vessel elastic module is E=4.66 MPa, Poisson's ratio v=0.49, blood vessel wall density ρ2=1100 kg/m3. Blood vessel wall is smooth, isotropic and its strength characteristics do not vary along its length.
Boundary conditions in the beginning of blood vessel were determined so that on any determination of arterial systolic pressure, the maximum value will be consistently increased p∈ [16…27] kPa or p∈[120…200] mm Hg.
3. Results
Fig. 3 and 4 show the displacements appearing in the points of stenosis and aneurysm of an artery. The analysis of influence of the type and degree of pathology on pressure and stresses was made for different atherosclerosis cases, but in the paper, only some typical cases showing pathology risk blood vessel to crack (Figures 5-10) are discussed upon. From the given results, we could see that significant increase of pressure and stresses in the pathology area was typical for all damage degrees and types (Figures 5, 6). It was find out that depending on pathology type and its degree, the maximal blood pressure in damaged area could increase up to 3.4 times, while stresses could increase up to 6.8 times (Figures 6, 7).
Fig. 3Arterial stenosis displacements
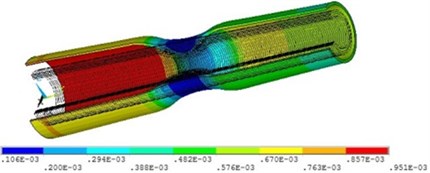
Fig. 4Arterial aneurysm displacements
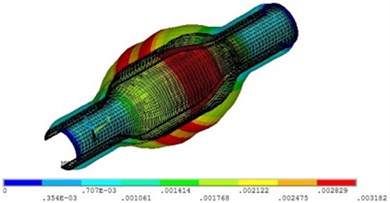
Fig. 5Distribution of maximal local pressure in the pathological blood vessel
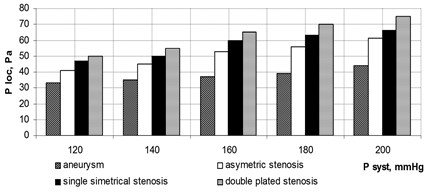
Fig. 6Distribution of maximal local stress in the pathologicald blood vessel
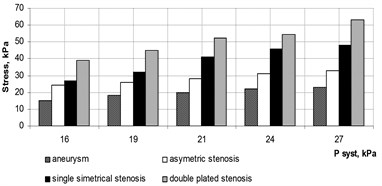
On analyzing different pathology types influence, it was find out that in case of symmetric double plated stenosis, the local blood pressure increases in stenosis area up to 3.4 times, the stresses – 6.8 times; in case of symmetric single stenosis, the local blood pressure increases up to 2.9 times, stresses – 5.9 times; in case of asymmetric single stenosis, the local blood pressure increases in stenosis area up to 2.8 times and stresses – 4.1 times (Figure 7), these data provide the maximum stenosis. That’s why blood vessel cracks not because of systolic blood pressure and stresses, but because of increased local blood pressure and stresses in the damaged blood vessel area (Figure 8) appear.
Fig. 7Distribution of local pressure in the blood vessel with different stenosis
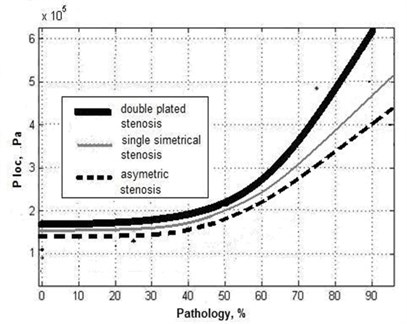
Fig. 8Stress distribution in the blood vessel with according length: 1– double symmetrical stenosis, 2 – with single symmetrical stenosis, 3 – asymmetrical stenosis
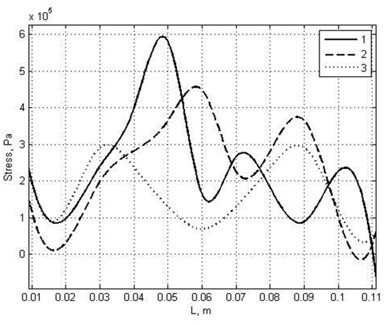
It was shown that blood pressure and stresses in the damaged blood vessels area mostly increase (stresses to 6.8 times) in case of symmetric double plated stenosis (Figures 7, 8). On analyzing Figure 5, we could see that when pathology degree is till 50 %, pressure and tensions vary slightly in all analyzed cases. That’s why for these pathology degrees the employable person could still feel well.
The research results show that in all types of pathology types and damage degrees, blood pressure and stresses values are maximal before damage and in damaged areas are smaller (Figure 9). While in aneurysm case (Figure 10), blood pressure and stresses values are maximal in pathology middle and in exit from damage area – the smallest.
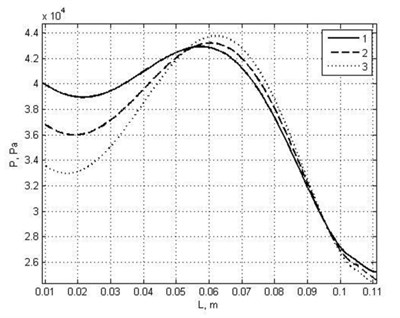
It was found that when aneurysm increases, blood pressure and stresses values vary according to non-linear dependence and approximately could be expresed as square root of ratio √dF/dn, where dF– the actual aneurysm diameter, dn – non-enlarged (normal) blood vessel diameter. When aneurysm increases up to 1.25 times, blood pressure increases 1.1 times; when aneurysm increases 1.5 times – pressure increase 1.2 times (Figure 8). That is if aneurysm increases 1.25 times then √1.25≅1.11 or √1.25≅1.1, when aneurysm increases 1.5 times then we have √1.5≅1.22 or √1.5≅1.2. On comparing the calculated values of blood pressure with the results of numerical research, we could notice that the blood pressure increase could be approximately assessed by calculating square root of relative aneurysm increase.
Fig. 9Pressure distribution in pathologic blood vessels according to blood vessel length: 1 – double symmetrical stenosis, 2 – single symmetrical stenosis, 3 – asymmetric stenosis
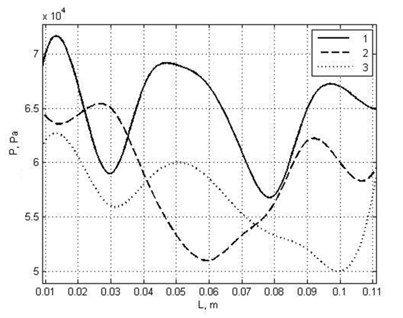
Fig. 10Pressure distribution in aneurysm according to blood vessel length: 1 – widening 150 %, 2 – widening 200 %, 3 – widening 250 %
It was found in the said that in all blood vessel damage cases blood pressure and stresses are maximal in the blood vessel damage areas. In double damage areas, two maximal values of blood pressure and stresses appear and they could cause cracks of the damaged blood vessel.
Taking into account that aneurysm causes a considerable change of the blood vessel structure and worsening of its strength properties, a considerably lower blood pressure and stresses could be dangerous for damaged blood vessels, as compared to other cases.
In course of calculations, it was found that blood flow rate in damaged blood vessel areas grows considerably (up to 10 times) as well. That’s why the conditions for turbulent blood flow appear in damaged blood vessel areas. The comparative calculations of blood pressure, stresses and blood flow rate enabled to determine that upon assessing blood turbulence, the blood pressure and stresses values increased 1.8 times.
4. Conclusion
1. It was found out that maximal values of blood pressure and stresses are before the pathology area, except an aneurysm case. In presence of the maximal pathology degree (95 %), the maximal blood pressure values, as compared to systolic blood pressure, could increase up to 3.4 times and stresses – to 6.8 times.
2. In an aneurysm case, blood pressure and stresses are maximal in pathology middle area, minimal – in the exit and its values depend on the aneurysm degree. It was found out that for approximately calculations, when aneurysm expands up to 250 %, the simplified non-linear dependence expressed as square root of aneurysm diameter and normal (non-enlarged) blood vessel diameter ratio could be used to determine pressure and stresses increase.
3. It was found that most maximal stresses occur in double plated symmetric stenosis case, as compared to other stenosis cases.
4. Blood flow rate in pathology areas, as compared to non-damaged blood vessel areas, increase approximately 10 times. That’s why the real conditions for blood flow turbulence in blood vessel damaged areas appear.
5. The provided calculations enable to determine that when pathology degree is till 50 %, pressure and stresses vary slightly and human employable do not decrease.
References
-
Majesky M. W., et al. Parsing Aortic Aneurysms. Circulation Research, Vol. 108, 2011, p. 528-530.
-
Shalman E., et al. Numerical modeling of the flow in stenosed coronary artery. Computers on biology and medicine, Vol. 32, Issue 5, 2002, p. 329-344.
-
Shulze-Bauer C. A., Holzapfel G. A. Determination of constitutive equations for human arteries from clinical data. J. Biomech., Vol. 36, 2003, p. 185-169.
-
Wang J. J., Parker K. H. Wave propagation in a model of the arterial circulation. J. Biomech., Vol. 37, Issue 4, 2004, p. 457-470.
-
Mariūnas M., Kuzborska Z. Influence of load magnitude and duration on the relationship between human arterial blood pressure and flow rate. Acta of Bioengineering and Biomechanics, Vol. 13, Issue 20, 2010, p. 67-72.
-
Mariūnas M., Kuzborska Z. Pressure dynamics of blood vessels when modeling pathological processes. Journal of Vibroengineering, Vol. 13, Issue 2, 2011, p. 269-275.
-
Kleinstreuer C., Li Z., Farber M. A. Fluid-Structure Interaction Analyses of Stented Abdominal Aortic Aneurysms. J. of Biomedical Engineering, Vol. 9, 2007, p. 169-204.
-
Kumar S., Kumar S. Oscillatory MHD flow of blood through an artery with mild stenosis. International Journal of Engineering, Vol. 22, Issue 2, 2009, p. 125-130.
-
Leung J., Hughes A., et al. Fluid Structure Interaction of Patient Specific Abdominal Aortic Aneurisms: A Comparison with Solid Stress Models. Biomedical Engineering, 2006, p. 256-281.
-
Panniera B. M., Avolio A. P., Hoeksc A., Mancia G., Takazawa K. Methods and devices for measuring arterial compliance in humans. Am. J. Hypertens, Vol. 15, Issue 8, 2002, p. 743-753.
-
Pickering T. G. Principles and techniques of blood pressure measurement. Cardiology Clinics, Vol. 20, Issue 2, 2002, p. 207-223.
-
Figueroa C. A., Hughes T. J., Taylor C. A., et al. A coupled momentum method for modelling blood flow in three-dimensional deformable arteries. Comput. Methods Appl. Mech. Engrg., 2006, p. 1-22.
-
Vignon-Clementel I., Figueroa C. A., Jansen K. E., Taylor C. A. Outflow boundary conditions for 3D simulations of non-periodic blood flow and pressure fields in deformable arteries. Computer methods in Biomechanics and Biomedical Engineering, Vol. 13, Issue 5, 2010, p. 625-640.
-
Steele B. N., Wan J., Ku J. P., Hughes T. J., Taylor C. A. In Vivo Validation of a One-Dimensional Finite-Element Method for Predicting Blood Flow in Cardiovascular Bypass Grafts. IEEE Trans Biomed Eng., Vol. 50, Issue 6, 2003, p. 649-656.
-
Taylor C. A., Draney M. T. Experimental and Computational Methods in Cardiovascular Fluid Mechanics. Annual Review of Fluid Mechanics, Vol. 36, 2004, p. 197-231.
-
Vignon I., Taylor C. A. Outflow Boundary Conditions for One-Dimensional Finite Element Modeling of Blood Flow and Pressure Waves in Arteries. Wave Motion, Vol. 39, Issue 4, 2004, p. 361-374.
-
Mariūnas M., Uzdilaitė G. Reserch on the Influence of Pathology Level to Stresses in Elastic Arterines. Journal of Vibroengineering, Vol. 8, Issue 3, 2006, p. 30-34.
-
Ryval J., Straatman A. G., Steinman D. A. Two-equation turbulence modeling of pulsatile flow in a stenosed tube. Journal of Biomechanical Engineering, Vol. 126, Issue 5, 2004, p. 625-35.
-
Milnor W. R. Hemodynamics. Williams and Vilkins, 2009, p. 413-419.
-
Mandal P. K. An Unsteady Analysis of Non-Newtonian Blood Flow through Tapered Arteries with a Stenosi. International J. of Non-Linear Mechanics, Vol. 40, 2005, p. 151-164.
-
Long Q. Numerical Investigation of Physiologically Realistic Pulsatile Flow Through Arterila stenosis. Journal of Biomechanics, Vol. 34, 2001, p. 1229-1242.
-
Taylor C. A., Steinman D. A. Flow Imaging and Computing: Large Artery Hemodynamics. Annals of Biomedical Engineering, Vol. 33, Issue 12, 2005, p. 1704-1709.
-
Williamson S. D., et al. Technical Brief. On the Sensitivity of Wall Stresses in Deseased Arterines to Variable Material Properties. Journal of Biomechanical Engineering, Vol. 125, Issue 2, 2003, p. 147-155.
