Abstract
It is difficult to develop an accurate fault diagnosis model for aero-engines due to their complex structure. In present paper, a new method for classifying and identifying fault modes according to the effective information extracted from history fault samples was proposed. This method includes three steps: firstly, find out independent source vibration signals through diagnosing and separating vibration signals. Secondly, find out the features that have great contribution to fault analysis using kernel principal component analysis (KPCA), and extract the eigenvector that is sensitive to status. Finally, classify the eigenvectors characterizing fault nature using support vector machine (SVM), meanwhile, select and analyze the parameters affecting classification effect. Two typical fault samples of aero-engine were used for verifying the feasibility of this method. Results show that for fault classification, this method has high identification accuracy, fast diagnosis speed, and is applicable to solving the classification and identification of small and nonlinear faults.
1. Introduction
Fault diagnosis refers to placing existing faults into identified fault categories according to a group of eigenvectors that can reflect system working status, and its nature is the classification and identification of fault. The fault diagnosis technologies for large systems include analytical model method, graph theory method, the method of expert system, qualitative simulation, etc. These methods need either massive participation of expert or developing an accurate static (or dynamic) model [1]. However, the experts’ description of results according to their experience is uncertain, and some proposed assumptions in modeling are not reasonable. Hence, it is hard to get an accurate mathematical model, which affects fault diagnosis accuracy.
With the development and application of information collection, storage and processing technology, repair companies have collected a large amount of sample data that can reflect the various working status of device [2]. These samples imply the feature information of various statuses. If we can gain the information contained in these sample date, the identifying veracity of device faults is expected to be improved.
In present paper, a novel method for identifying aero-engine faults was proposed, in which the data collected by repair companies in the process of engine fault repair were used as samples, through sample data processing using fault signal separation, feature extraction of kernel principal component, and mode classification, etc, the fault information contained in fault samples were extracted, so as to realize accurate status identification for a given device. It was proved to be feasible for the fault identification of aero-engine which is characterized by small sample and nonlinear nature.
2. Diagnosis procedure based on fault sample
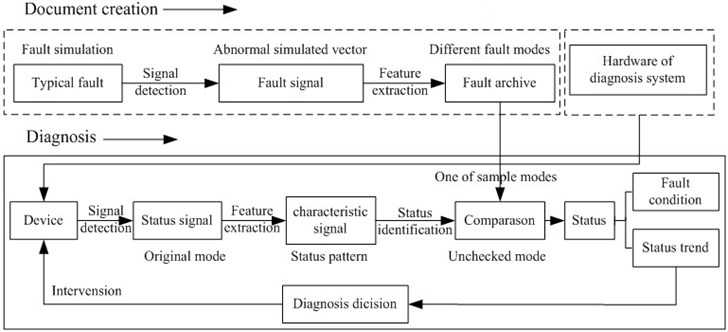
Fig. 1 shows the self-developed classification method for aero-engine faults according to fault samples. The implementation process mainly includes the creation of fault document library and diagnosis, and they all consist of three steps: vibration signal acquisition, feature information extraction, and the classification and identification of status. The first step is to separate information, i.e., to decompose mixture signals into every vibration source, and then collect the amplitude, phase position, and frequency of a single vibration source signal. These indicators are correlated with each other, leading to high characteristic dimension for describing fault. In this case, even there are many fault samples, the identifying veracity of faults will not be high [3]. Hence, it is necessary to extract the features of information indicators and remove the interference information and redundant information, so as to form new independent features [4]. The final step is to compare undetected feature mode and sample feature mode, categorize existing fault feature mode into a given sample mode, and finite the classification and identification of faults [5].
Fig. 1Implementation process of condition monitoring and fault identification
3. Separation of fault sample mixture signals
A certain type of civil aviation engine consists of low-pressure rotor, intermediate pressure rotor, and high-pressure rotor. These rotors are concentric, and are outer shaft, intermediate shaft, and inner shaft, in order. They are installed in engine via the bearing seat of case, and rotate at different speeds. The vibration signals collected by vibration transducer include mixture signals from various excitation sources (such as compressor, turbine, and other attachments in every shaft). Meanwhile, there exist noise and other interfering signals. General processing method is to directly analyze the mixture signals without through signal decomposition, hence has such disadvantages as large fault identification difficulty and low fault diagnosis accuracy.
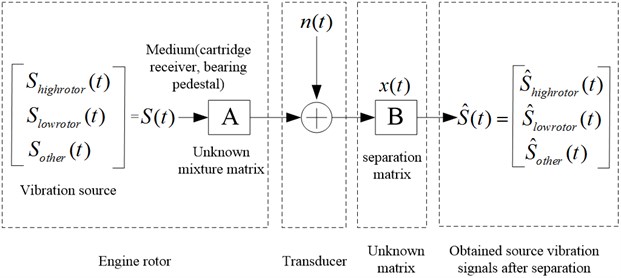
The vibration signals were separated according to different excitation sources using independent component analysis. Assume that there are three signal sources, and the vibration signals were measured by three acceleration transducers at different positions [6]. The linear weighted sum of vibration signal generated by signal source is , and it can also be expressed as Eq. (1), where are weighting coefficients, and is related with the distance between signal source and transducer. Determine source signal from transducer signal , and construct a separation matrix .
After transform , the output column vector can be expressed as:
where is global transmission matrix, and it can be converted into a unit matrix, hence , in this way separated source signal can be obtained.
The fault identification has high accuracy after removing interference and extracting excitation source signals. The separation process of mixture vibration signals is shown in Fig. 2.
Fig. 2Separation process of engine vibration mixture signal
4. Feature extraction of fault sample signal
KPCA can reduce the dimensionality of complex data [8]. The vibration fault signals of civil aviation engine are nonlinear, and KPCA does not perform well for these features, because the nonlinear feature extracted by KPCA based on linear transformation can not replace original feature [9], in other words, the substitutability between new feature and original feature is very low.
KPCA is an extension of linear principal component analysis method [10]. This link map input data set to a high dimensional feature space through selected nonlinear mapping on the basis of original data space, and construct a new variable to replace the original one, because the dimension of new variable is lower than that of the original one. New variable contains some feature information of the original one, hence the dimension of mapping space can be reduced greatly, while making input data have better divisibility.
Take and as training samples and input space, respectively. Transformation function is labeled , and following conditions need to be satisfied:
Its covariance matrix is:
If condition (3) is not satisfied, the operation steps are given in literature [11]. can be considered to be in the subspace constituting of the space expanded by , , …, , i.e.:
where .
Actually, the corresponding objective function in the feature space can be described with following Lagrange function:
where . When takes maximum, the following condition must be met:
Set , and Eq. (7) is equivalent to the following characteristic equation:
According to Eq. (8), the eigenvalues of the training sample set are , and the eigenvectors are . Assume the unit conversion axis is :
It can be easily noticed that , and and are orthogonal [12]. The projection of on can be determined according to Eq. (9), and the feature extraction result of sample in the feature space is:
In actual application, the value of is determined based on the actual situation, and fault classification can be performed according to the obtained feature extraction result.
5. Classification and recognition algorithm of fault sample
The most fault information is retained after feature extraction. Which fault category does abnormal signal sample belong to? It is a problem of mode classification and identification. In present paper, a multi-class classification algorithm based on hierarchical structure was used for determining the fault classification model.
Fig. 3Multi-class classification algorithm based on hierarchical structure [13]
![Multi-class classification algorithm based on hierarchical structure [13]](https://static-01.extrica.com/articles/10068/10068-img3.jpg)
Firstly, divide all categories into two subtypes, and then divide the each obtained subtype into two subtypes. Such division was repeated until many single categories were obtained, as shown in Fig. 3. The classification effect of an algorithm depends on the type of kernel function and parameter value. Through massive experiments and theoretical analysis [14], it was found that for the high-speed rotor with prominent nonlinear movement characteristics in civil aviation engine, the classification and prediction using RBF kernel function had high accuracy, but it was affected by parameters and .
6. Fault sample identification for aero-engine
The vibration of this aero-engine was evaluated through measuring the vibration acceleration of the outer case using rugged and reliable piezoelectric accelerometer, and the acceleration transducer was installed on the right of the fixture fringe in low-pressure compressor case, as shown in Fig. 4.
The measuring system consists of tracking filter, accelerometer, signal adjuster (charge amplifier, filter, integrator), and connecting cable. Integral circuit and computer-controlled narrow-band pass filter (or automatic rotate speed tracking filter) were used for outputting the data about the amplitude-frequency characteristics and phase characteristics of vibration. The frequency of engine speed and the vibration acceleration component of harmonic were extracted out from broadband vibration signal.
Fig. 4Installation and structure of a certain type of engine transducer
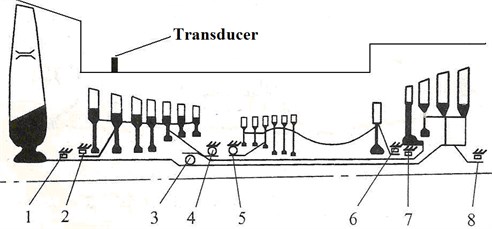
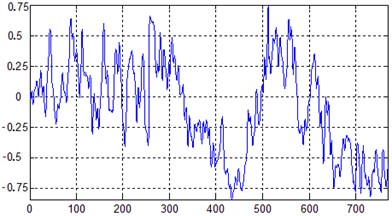
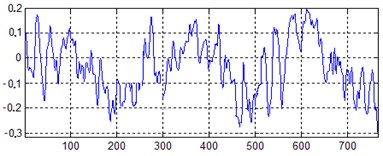
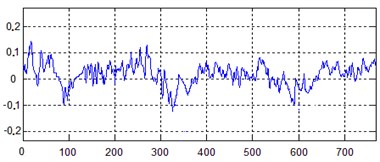
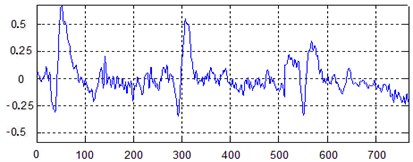
Fig. 5Signal time-domain waveform graphs
a) Horizontal direction of the front case
b) High pressure rotor vibration waveform
c) Middle pressure rotor vibration waveforms
d) Low pressure rotor vibration waveform
7. Separation of mixture vibration signals
In order to conveniently analyze the rule of signal data, the points that change slowly and have invisible characteristics were removed, so as to improve the statistical property of signal. There exist some nonlinear factors during the high-speed rotation of aero-engine rotor. The changing vibration excitation force and frequency make the vibration band very wide. It was found that at frequency below 1000 Hz, the frequencies of the rotor were distinct, hence the cut-off frequency was set as 1000 Hz. 780 sample points were selected for analysis. Fig. 5(a) shows the time-domain waveforms of the mixture vibration signals measured by a level sensor installed in the front case. A separation algorithm based on independent analysis was used for separating the mixture signals, and the obtained waveforms of high, intermediate and low pressure rotator are shown in Fig. 5(b)-(d).
8. Vibration fault identification and parameter selection
In order to establish a fault classification model based on multi-class support vector machine, process monitoring was carried out to two typical faults. Firstly, some vibration data about pedestal looseness and engine pipeline fracture were collected. For each type of working status, six transducer data were selected for feature extraction, and they included exhaust gas temperature (EGT), fuel flow (FF), wastage of fuel (WF), engine pressure ratio (EPR), low pressure rotating speed N1, and low pressure vibration V1.
KPCA was adopted in data feature extraction. For every working status, 40 groups of sampling data were acquired through sampling 40 times at a certain frequency. As the contribution of the first two principal components are less than 85 % in normal status, while principal component feature extraction requires that the contribution exceed 85 %, hence the number of principal component were increased by one to meet the requirement. 20 samples randomly extracted from pedestal looseness samples and another 20 samples randomly extracted from pipeline fracture samples were selected for test. Fig. 6 shows the primary component distributions of normal samples and fault samples.
Fig. 6Sample distribution map of PCA
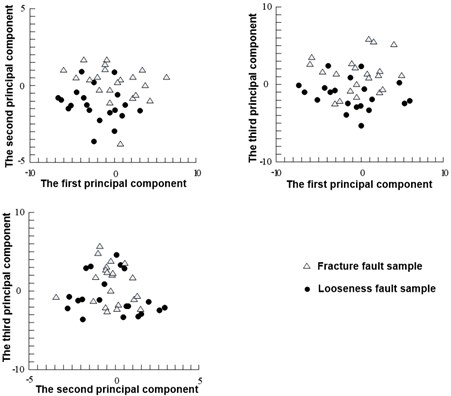
It can be found that KPCA can reduce the dimension of characteristic vector, but the two fault samples were mixed together without obvious interface as shown in Fig. 6. Hence, the obtained principal components can not identify the abnormal vibration fault induced by cracks.
When the parameter in radial basic function RBF is optimized to be 1.75, the classification results are shown in Fig. 7. It can be seen that the two types of fault sample have been separated from each other. This indicates that KPCA is more effective than principal component analysis method in feature extraction of nonlinear fault for civil aviation engine. The value of has a great effect on sample classification results. The optimum value of can be obtained using cross validation, genetic algorithm, or other optimization algorithm.
Fig. 7Sample distribution map of KPCA RBF σ= 1.75
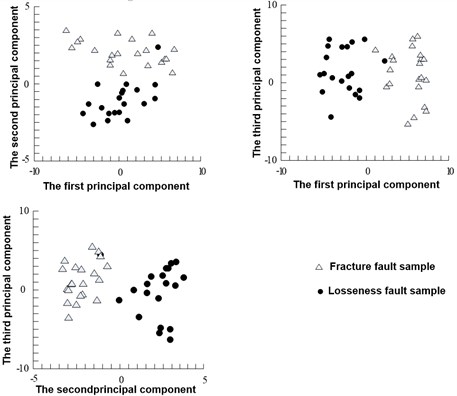
Results showed that KPCA could effectively reveal the essential difference between different modes, is suitable for extracting the nonlinear characteristics of different fault signals, and can distinguish the different aviation engine fault modes.
The data used in KPCA is the normalized testing sample data. The signals collected directly by transducer have strong randomness due to the disturbance of environmental noise. Hence, KPCA is not suitable for directly extracting feature from original signals.
9. Conclusions
Traditional time-frequency analysis method performs not well in separating fault excitation source. The independent component analysis method can effectively eliminate interference and can extract independent excitation source signal from mixture signals, which makes the algorithm has wider application scope and stronger robustness, and the separation signals exhibit prominent fault features.
The correlation between mode type and eigenvector can not be characterized when linear method is used for processing nonlinear features. As the fault emerged when aero-engine run exhibits nonlinear feature, kernel principal component analysis method is need to analyze fault signals.
Feature extraction technology and support vector machine technology were combined, and utilized to classify the fault mode of aviation engine. This method has high diagnosis accuracy, fast diagnosis speed, and better performance than others.
Owing to the effect of parameter value, even RBF radial basic function has not very high accuracy. Because classification accuracy is affected not only by parameter, but also some influence factors may interact with each other, as a result, the whole effects are much larger than that of each single factor. Hence, when selecting kernel function, penalty parameter and parameter of kernel function , it is necessary to fully consider the effect of the interaction of the three factors on system classification accuracy.
References
-
Loutas T. H., Roulias D., Pauly E. The combined use of vibration, acoustic emission and oil debris on-line monitoring towards a more effective condition monitoring of rotating machinery. Mechanical Systems and Signal Processing, Vol. 25, Issue 4, 2011, p. 1339-1352.
-
Kamali M., Ataei M. Prediction of blast induced vibrations in the structures of Karoun III power plant and dam. Journal of Vibration and Control, Vol. 17, Issue 4, 2011, p. 541-548.
-
Zarei Jafar Induction motors bearing fault detection using pattern recognition techniques. Expert Systems with Applications, Vol. 39, Issue 1, 2012, p. 68-73.
-
Mahvash Ali, Lakis Aouni A. A novel approach to evaluation of vibration source separation based on spatial distribution of sensors and Fourier transforms. Journal of Dynamic Systems, Measurement and Control, Transactions of the ASME, Vol. 133, Issue 6, 2011, p. 1-9.
-
Van Zyl H. V., Mathews E. H. Quadratic mode shape components from linear finite element analysis. Journal of Vibration and Acoustics, Transactions of the ASME, Vol. 134, Issue 1, 2012, p. 1-8.
-
K. Umezawa, T. Suzuki, H. Houjoh Estimating of Vibration of Power Transmission Helical Gears by Means of Performance Diagrams on Vibration. JSME International Journal, Vol. 31, Issue 4, 1998, p. 598-605.
-
Stappenbelt Brad Vortex-induced motion of nonlinear compliant low aspect ratio cylindrical systems. International Journal of Offshore and Polar Engineering, Vol. 21, Issue 4, 2011, p. 280-286.
-
Mamandi Ahmad, Kargarnovin Mohammad H. Dynamic analysis of an inclined Timoshenko beam traveled by successive moving masses/forces with inclusion of geometric nonlinearities. Acta Mechanica, Vol. 218, Issue 1-2, 2011, p. 9-29.
-
Zhu Ning, Feng Zhigang, Wang Qi Fault diagnosis of rocket engine ground testing bed based on KPCA and SVM. Journal of Harbin Institute of Technology, Vol. 41, Issue 3, 2009, p. 81-84.
-
Bossi L., Rottenbacher C., Mimmi G., Magni L. Multivariable predictive control for vibrating structures: an application. Control Engineering Practice, Vol. 19, Issue 10, 2011, p. 1087-1098.
-
Xiangyang Jin, Xiangyi Guan, Lili Zhao Spectral analysis and independent component separation for aero-engine rotor vibration. International Review on Computers and Software, Vol. 7, Issue 5, 2012, p. 2740-2744.
-
Sunage T. Differential reducers using internal gears with small tooth number difference. Bulletin of JSME, Vol. 108, Issue 5, 2005, p. 28-39.
-
Moschioni G., Saggin B., Tarabini M. Prediction of data variability in hand-arm vibration measurements. Measurement: Journal of the International Measurement Confederation, Vol. 44, Issue 9, 2011, p. 1679-1690.
-
Srinil Narakorn Analysis and prediction of vortex-induced vibrations of variable-tension vertical risers in linearly sheared currents. Applied Ocean Research, Vol. 33, Issue 1, 2011, p. 41-53.
About this article
This work was supported by Scientific Research Fund of Heilongjiang Provincial Education Department (No. 1252CGZH18), Twelfth Five-Year Plan Issues for Heilongjiang High Education Scientific Research (No. HGJXHB2110792), and the Youth Science and Technology Innovative Talents Project of Harbin Science and Technology Bureau (No. 2012RFQXG076).
