Abstract
In this paper we present a low power wireless network sensor module and its proof-of-concept. We analyze the energy consumption of the device on long term operation. Main goal of the simulation was to ascertain that the device will remain operational for 2 years, while working on set sleep/active mode conditions. Secondary objective was to test the synchronization possibilities of the sensor modules, since it is one of the key aspects of the energy consumption while considering multi-hop wireless networks.
1. Introduction
Currently computer systems and wireless transmitters are getting smaller and less energy demanding. This allows an opportunity to create more advanced small sized data gathering devices – sensors. Sensors have an autonomous energy source and are able to perform simple data gathering or process control task autonomously. Wireless data transfer capabilities allow these sensors to be connected to large scale networks called sensor networks (WSN). Recently these networks are becoming increasingly popular in various scientific, medical and agricultural fields [1-3] where distributed data gathering is required. Despite all advantages, small size also introduces certain difficulties. From the energy consumption perspective, biggest problem of wireless sensors is limited energy resources. Sensors are usually mounted with low to medium sized (thus low capacity) batteries. Operational time of sensor device, operating at full capacity, usually does not surpass several months. On some applications such duration is acceptable but for long term applications operational duration must be at least several years long.
With the surging popularity of the wireless sensor networks, many different methods targeted at reducing or optimizing energy consumption are being developed. Some of these methods are based on energy efficient hardware solutions or energy scavenging [4], while others focus on new algorithms or operating systems [5]. The complexity of such devices varies according to their application – from Linux based complex systems to on-chip operating systems [6] mounted with a low power transceiver.
Low power systems are usually based on slower, less powerful microcontrollers, thus measurement of high frequency signals (i. e. ultrasound) becomes difficult. In case of a high frequency measurement procedure, an expansion board with a more powerful CPU and data acquisition system can be connected by using designated port. However, since this topic does not fall into the scope of this paper, we shall consider the sensor module as a low frequency measurement device.
2. Device concept and applications
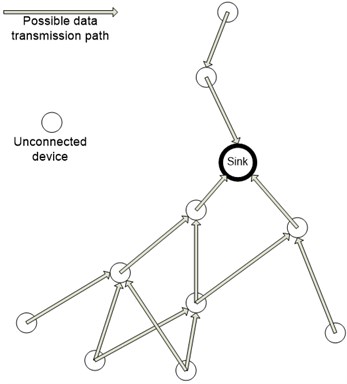
Our nodes are made based on Ad-Hoc wireless network model that is widely used by researchers [1, 7, 8]. In other words sink has direct link with all level 1 devices. Each level 1 device has direct link with sink and possibly with level 2 device and so on (Fig. 1).
Experimental module is comprised of Texas Instruments MSP430F2350 microcontroller and Analog Devices AT86RF212 Zigbee transmitter. Sink additionally has serial interface to PC. This module can perform simple measurements (i. e. temperature, humidity, etc.) on its own using the F2350’s internal analog to digital converter (ADC). Zigbee module is set to work in the European SRD band (863-870 MHz). The device is configured to work on 250 kbits/s data link and offers around 100 m data transfer distance in buildings (with proper antenna orientation) and 300 m and beyond on the open space.
Fig. 1Model of the WSN

Features:
• 250 kbit/s data transfer rate (can be increased up to 1000 kbit/s);
• Operational range of 300 m and beyond;
• European SRD band @863 MHz;
• Low energy consumption (0.9 μA in sleep mode);
• Programmable output power up to +10 dBm;
• Sensitivity up to -95 dBm;
• Supply voltage 3.5~2.2 V (without extension module).
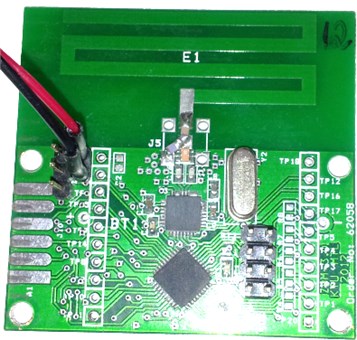
For RF propagation in standard cases we are using on board (printed on PCB) antenna. In case of requirement for better RF link quality there’s an expansion slot for external antenna (helix/whip, etc.). Printed antenna length for 863 MHz band is 25 cm.
3. Theoretical model of energy consumption
The aim of the simulation was to ascertain the claim that with provided active/sleep timing the device would be able to function for at least 2 years without replacing or recharging it’s enegy source. To test this we set the duration of the simulation to 3 years and use the energy consumption values of the main elements which are provided below. To make simulation simpler, the following two parameters were selected: device distribution through logical levels and listening time after sending packet. As these 2 parameters were sufficient for our task, we ignored other parameters, such as energy leakage, natural battery deterioration.
Devices are distributed within the field randomly while fulfilling two conditions:
• At the beginning of simulation device has connection to at least one device of lower logical level;
• Currently there is no other device at the placement location of the new device.
According to the device specific datasheets the following energy costs were applied:
• Energy consumption while in sleep mode: 0.9 μA;
• Energy consumption while in active mode with transmitter off: 305.2 μA;
• Energy consumption while in active mode with transmitter in transmission mode (TX mode): 17 mA;
• Energy consumption while in active mode with transmitter in receiving mode (RX mode): 9.2 mA.
Previously mentioned measurement cycle starts at the moment when the measurement function is started and ends right before the start of the next measurement function. Transmission cycle includes processing of data packet and transmitting it to the sink, including any retransmissions. Also after each transmission cycle each device goes into listening mode for predefined time interval and retransmits any packets that it receives. Basic simulation model is presented in Fig. 2.
To make simulation less complex it was decided that devices are ideally synchronized and no additional synchronization is necessary during the time of operation. Each device keeps track of lower level devices and when one of those devices disappears from the network, device is able to choose another lower level device for retransmission. Transmission cycle is being initialized after a predefined number of measurement cycles. After distributing and interconnecting the devices, the logical view of the network should look like the example shown in Fig. 3. In this model successful transmission of the packet was not required. Minimizing energy consumption was being held more important aspect of the network than a guaranteed transmission of each packet. Thus each data packet is being retried 4 times upon unsuccessful transmission. Upon failure device tries to send the packet using a different lower level device. If there are no more lower level devices, system goes into the listening mode.
Fig. 2Simulation algorithm

Fig. 3Possible structure of the WSN
In the first experiment (Fig. 4) we chose an equal device distribution through the network with percentage values of 20 %, 20 %, 30 %, 30 % for the levels 1 to 4. In this and the three following experiments listening window will be set to 3 seconds. Since guaranteed packet delivery is not required and successful packet transmission rate is set to 97 %, energy consumption lost to retransmission is not noticeable.
Retransmission energy cost of the packets is barely noticeable (devices 30 to 50). Biggest energy loss in this case falls to the listening mode (~2/3rd of total energy). In Figure 4 we can also notice that some level one devices also use quite a lot of energy servicing (transferring the data packets of the level 2-4 devices) remaining devices (up to 25 % total). It is worth noting that this value depends on the device position on the field and amount of higher level devices it needs to service. Similar energy consumption increase also applies to level 2 and level 3 devices, although it is less significant. Sink device (device No. 0) is connected to a PC and has unlimited energy resources, thus on the energy consumption graph it is shown as having lost no energy.
For the second experiment we changed the device distribution to one that is more favorable for long term operation. 60 % of all devices were spread in the first two levels of the network. This had desired effect on energy consumption – servicing cost for higher level devices was reduced from 25 % to 15 % maximum energy value (Fig. 5).
For the third experiment we created a network with an unfavorable distribution of devices: 10 % of devices in each of the first two, 30 % in the third and 50 % in the fourth levels. But even if distribution is different, energy consumption shows even greater changes (Fig. 6).
Fig. 4Remaining energy for Experiment 1 after 3 years of operation
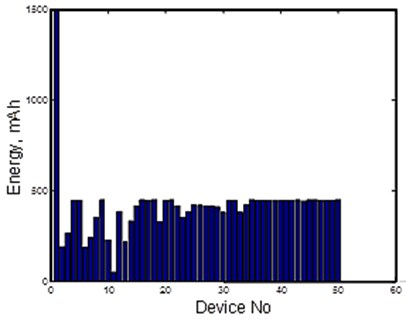
Fig. 5Remaining energy for Experiment 2 after 3 years of operation
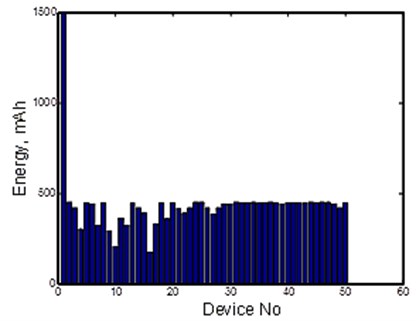
Fig. 6Remaining energy for Experiment 3 after 3 years of operation
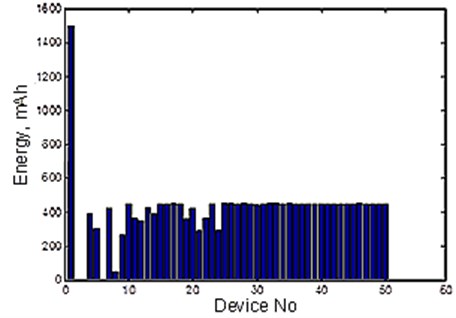
For all three experiments all the network and device parameters except for the distribution were constant. In the first two experiments devices still had some energy left after 3 years. But in this case 2 devices in level 1 and 1 device in level two had used up all the provided energy or were very close to that mark. Thus after analysis of the simulation results we can conclude that in higher levels number of devices should not increase logarithmically, unless increased energy consumption is acceptable. Despite that such distribution allows the network to cover field more equally and the effects of the servicing of devices can be lessened to some extent by smart routing (distributing load between devices in real time) or by energy harvesting. But from economical viewpoint selecting an appropriate topology is more efficient than other solutions to this case.
Of course this simulation had technical limitations. While performing simulation, link quality was expressed as a probability of successful transmission of the packet, which was uniform for the whole field. Also some technical aspects, such as natural deterioration of the battery, device malfunction or loss of transmition path were not accounted for. Despite that, since the aim of this simulation was to provide proof of the hardware concept, these limitations were not critical for the final results.
Energy consumption on the real device (Fig. 7) was measured to be ~3 μA in sleep mode and 18.3 mA in RX active mode. The measured values are acceptable for long term operation. From this we can conclude, that the energy consumption values of the prototype device are comparable with simulation values and that calculated operational time can be achieved by using high quality energy sources.
Fig. 7Prototype of the sensor node
4. Synchronization capabilities
For certain measurements all devices in the network need to be on a single time scale either to be able to record time stamp, or be able to perform specific tasks on the exact time. Depending on the needed accuracy and task various synchronization algorithms (such as RBS, TPSN, NTP, etc.) are employed. We performed a frame broadcast and visualized the distribution of the event flag that is raised after radio transceiver completes the verification of the received frame.
Fig. 8Visualization of the “frame received” event
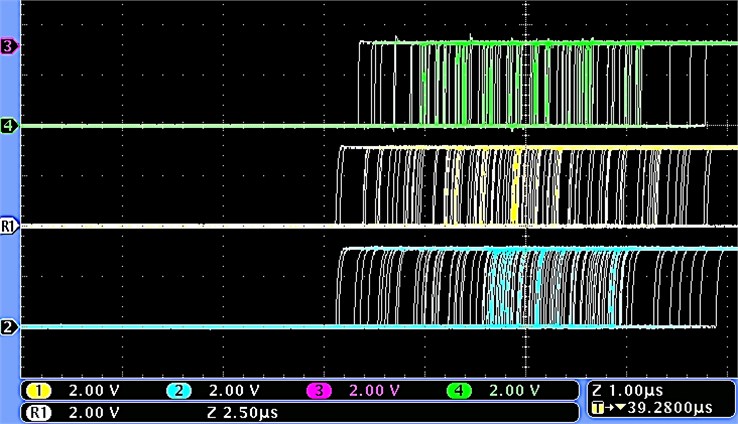
As shown in Fig. 8, variance of the verification of received frame is 10 µs. In this experiment the synchronization signal for the oscilloscope was generated by the transmitter sending the broadcast packet, thus there is a delay that occurs because of the transmition/receiving process. In this experiment all the devices that were being synchronized were in the same logical level. Because of that the delay resulting from transmition of the packet can be considered similar to all devices and thus can be evaluated by using the reference broadcast synchronization algorithm [9].
5. Conclusions
In this paper we presented a wireless sensor designed for long term operation. In the proof-of-concept simulation that was performed during the design phase, operational time of 3 years was achieved, without accounting some parameters, such as variance of the transmission medium due to obstacles and outside interference and natural deterioration of the batteries. Even after accounting factors that are not present in the simulation, energy source should be sufficient for the devices to function for the target duration of 2 years. Energy consumption of the prototype device did not have significant differences from the simulations, thus currently we believe the devices to have the capabilities for long term monitoring.
For measurements that require precise synchronization, this system provides synchronization with 10 µs accuracy (not accounting for the clock drift affecting the accuracy after the syncronization event). Time delays occurring because of the data transfer protocols can be evaluated using the RBS synchronization algorithm.
References
-
Willis L. S., Kikkert C. J. Radio propagation model for long-range ad hoc wireless sensor network. International Conference on Wireless Networks, Communications and Mobile Computing, 2005, p. 826-832.
-
Chilibon I., Magoldea M., Mogildea G. Module with piezoelectric sensor for acoustic emission applications. Sensors & Transducers, Vol. 18, Special Issue, 2013, p. 59-65.
-
Wesnarat A., Tipsuwan Y. A power efficient algorithm for data gathering from wireless water meter networks. IEEE International Conference on Industrial Informatics, 2006, p. 1024-1029.
-
Naveen Pasupuleti H., Rao R., Selvakumar D., SrinivasanReddy S. R. K. Energy aware self powered wireless sensor mote. Sixth International Conference on Sensing Technology (ICST), 2012, p. 630-636.
-
Reddy A. M., Kumar P., Janakiram D., Kumar G. A. Operating systems for wireless sensor networks: a survey technical report. International Journal of Sensor Networks (IJSNet), Vol. 5, Issue 4, 2009, p. 236-255.
-
TinyOS. 2013 05 16, http://tinyos.net/.
-
Salbaroli E., Zanella A. A statistical model for the evaluation of the distribution of the received power in ad hoc and wireless sensor networks. Sensor and Ad Hoc Communications and Networks, 2006, p. 756-760.
-
Freris N. M., Kowshik H., Kumar P. R. Fundamentals of large sensor networks: connectivity, capacity, clocks and computation. Proceedings of the IEEE, Vol. 98, Issue 11, 2010, p. 1828-1846.
-
Sichitiu M. L., Veerarittiphan C. Simple, accurate time synchronization for wireless sensor networks. Wireless Communications and Networking, 2003, p. 1266-1273.
-
Raicu I., Schwiebert L., Fowler S., Gupta Sandeep K. S. E3D: an energy-efficient routing algorithm for wireless sensor networks. Intelligent Sensors, Sensor Networks and Information Processing Conference, 2004, p. 25-30.
-
Schurgers C., Srivastava M. B. Energy efficient routing in wireless sensor networks. Military Communications Conference, 2001, p. 357-361.
