Abstract
Non uniformity of tension of flock printing material in the printing device decreases the quality of printed images. In order to reduce this non uniformity of tension a method based on the analysis of the shape of the first eigenmode of vibrations is proposed. Also when defect in the flock printing material takes place, it is important to perform its diagnostics as soon as possible. This is also performed from the distorted shape of the first eigenmode of vibrations obtained by using time averaged projection moiré. For this purpose not only the first eigenmode is to be used, but for some types of defects located in specific places of the sheet of flock printing material the analysis of several first eigenmodes is required. It is assumed that a sheet of flock material is an elastic layer with the elastic modulus and the density linearly varying in the thickness direction and having zero values on the lower plane. The square sheet of flock material is analyzed. On the upper plane of the lower and upper boundaries all the displacements are assumed equal to zero, except on the upper plane of the upper boundary linear variation of the displacement in the direction of the y axis is assumed. The first eigenmodes are determined and investigated. Investigation of vibrations of flock material by taking the layer of glue and separate flocks into account by using a two dimensional model is performed. This model is used for the determination of parameters of the previous model. It is assumed that flock material consists from a number of narrow two dimensional elastic strips and their upper parts are connected by an elastic layer. The first eigenmodes are determined and investigated. Experimental investigations of the eigenmodes of vibrations have been performed. The obtained experimental results show satisfactory agreement with the numerical ones. The obtained results are used in the process of design of packages made from flock material.
1. Introduction
Flock printing materials [1-10] find wide applications in packaging of industrial products and have superior qualities when compared to conventional paper or paperboard. Thus it is important to investigate the printing process and behavior of flock printing materials in the printing devices with the purpose of improvement of the quality of obtainable printouts.
In the printing device a tape of flock material experiences tension. Non uniformity of this tension decreases the quality of printed images. Thus it is important to reduce this non uniformity of tension. For this purpose a method based on the analysis of the shape of the first eigenmode of vibrations is proposed. Also when defect in the flock printing material takes place, it is important to perform its diagnostics as soon as possible. This is also performed from the distorted shape of the first eigenmode of vibrations obtained by using time averaged projection moiré. For this purpose not only the first eigenmode is to be used, but for some types of defects located in specific places of the sheet of flock printing material the analysis of several first eigenmodes is required.
The model for the analysis of vibrations of a sheet of flock material is proposed on the basis of the models described in [11, 12]. It is assumed that a sheet of flock material is an elastic layer with the elastic modulus and density linearly varying in the thickness direction and having zero values on the lower plane. The square sheet of flock material is analyzed. On the upper plane of the lower and upper boundaries all the displacements are assumed equal to zero, except on the upper plane of the upper boundary linear variation of the displacement in the direction of the y axis is assumed.
The first eigenmodes are determined and investigated.
Investigation of vibrations of flock material by taking the layer of glue and separate flocks into account by using a two dimensional model is performed. This model is used for the determination of parameters of the previous model. The model for the analysis of vibrations of flock material by taking the layer of glue into account is based on the material presented in [11, 12].
It is assumed that flock material consists from a number of narrow two dimensional elastic strips and their upper parts are connected by an elastic layer of glue. The first eigenmodes are determined and investigated.
Experimental investigations of the eigenmodes of vibrations on a specially developed experimental setup have been performed. The obtained experimental results show satisfactory agreement with the numerical ones.
The obtained results are used in the process of design of packages made from flock material.
2. Model of a sheet of flock printing material
Further x, y and z denote the axes of the system of coordinates. The finite element has six nodal degrees of freedom: the displacements of the lower plane of the sheet of flock material u1, v1, w1 in the directions of the axes of coordinates and the displacements of the upper plane of the sheet of flock material u2, v2, w2 in the directions of the axes of coordinates.
The mass matrix has the form:
where ρ|z=H is the density of the material on the upper plane, H is the thickness of the sheet of flock material and:
where Ni are the shape functions of the finite element. Here the following integrals were taken into account:
The stiffness matrix has the form:
where:
where K|z=H=E|z=H3(1-2ν),G|z=H=E|z=H2(1+ν), where E|z=H is the modulus of elasticity on the upper plane, ν is the Poisson’s ratio and the stresses on the upper plane are determined from the static problem:
where {δ} is the solution of the static problem. Here the following integrals were taken into account:
3. Results of analysis of vibrations of a sheet of flock printing material
The square sheet of flock material is analyzed. Length and width of the structure are equal to 0.2 m. The following parameters are assumed: modulus of elasticity on the upper plane E|z=H=6⋅108Pa, Poisson’s ratio ν=0.3, density of the material on the upper plane ρ|z=H=785kgm3, thickness H=0.04 m.
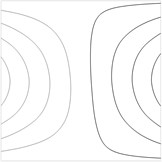
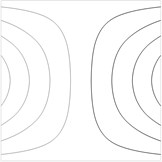
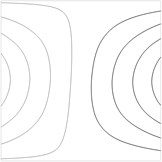
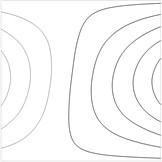
On the upper plane of the lower and upper boundaries all the displacements are assumed equal to zero, except on the upper plane of the upper boundary linear variation of the displacement v is assumed with v=0 on the left side of the boundary and v=a on the right side of the boundary.
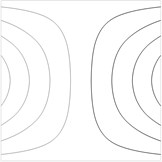
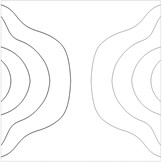
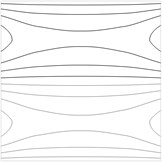
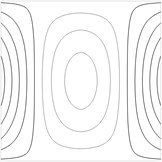
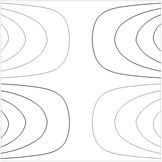
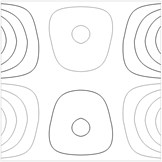
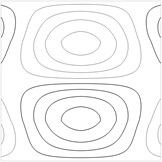
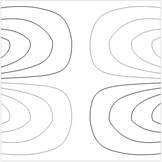
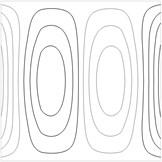
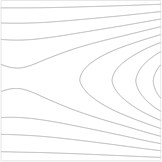
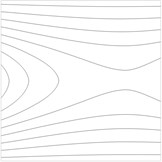
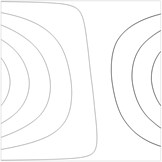
Contour plots of the transverse displacement for the upper plane for the first eigenmodes when a=0 m are presented in Fig. 1. Contour plots of the transverse displacement for the upper plane for the first eigenmode for various values of a are presented in Fig. 2. Contour plots of the transverse displacement for the upper plane for the second eigenmode for various values of a are presented in Fig. 3.
Fig. 1Contour plots of the transverse displacement for the upper plane for the a) first eigenmode, b) second eigenmode, …, j) tenth eigenmode when a= 0 m

a)
b)
c)
d)
e)
f)
g)
h)
i)
j)
Fig. 2Contour plots of the transverse displacement for the upper plane for the first eigenmode for various values of a: a) a= –0.02 m, b) a= –0.01 m, c) a= 0 m, d) a= 0.01 m, e) a= 0.02 m
a)

b)

c)
d)

e)
Fig. 3Contour plots of the transverse displacement for the upper plane for the second eigenmode for various values of a: a) a= –0.02 m, b) a= –0.01 m, c) a= 0 m, d) a= 0.01 m, e) a= 0.02 m
a)
b)
c)
d)
e)
4. Two dimensional detailed model of flock printing material
Investigation of vibrations of flock printing material by taking the layer of glue and separate flocks into account by using a two dimensional model is performed. This model is used for the determination of physical parameters of the previous model. The determination of E|z=H and ρ|z=H of the previous model can be performed from the conditions of approximate coincidence of the first eigenfrequencies of special problems with the results obtained by using this model.
Usual expressions of the mass and stiffness matrixes of the plane strain problem are assumed for the flock printing material and for the elastic layer of glue.
Length of the structure is equal to 0.2 m and thickness of the structure is equal to 0.08 m. The following parameters of flock material are assumed: modulus of elasticity E=6⋅108Pa, Poisson’s ratio ν= 0.3, density of the material ρ=785kgm3.
32 strips representing elastic flock material are taken into account. The upper layer which is one fourth of the thickness of the structure represents the layer of glue and thus consists of elastic finite elements. It is assumed that the thickness of elastic element representing a separate flock is equal to the interval between adjacent flocks. On the upper boundary the displacements of the first and the last nodes are assumed equal to zero.
Fig. 4The first eigenmode
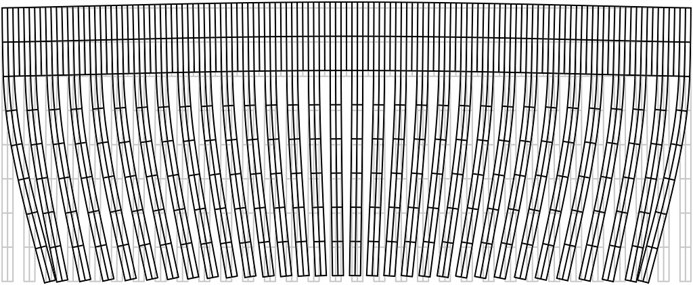
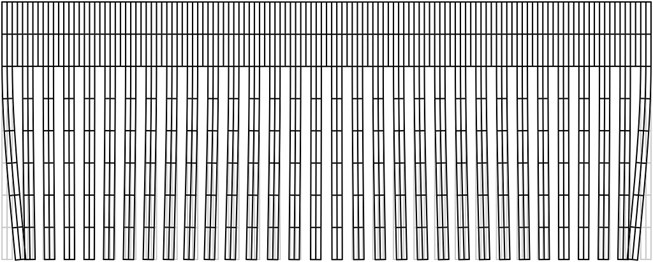
The first eigenmode is presented in Fig. 4, the second eigenmode is presented in Fig. 5 and the third eigenmode is presented in Fig. 6.
Fig. 5The second eigenmode
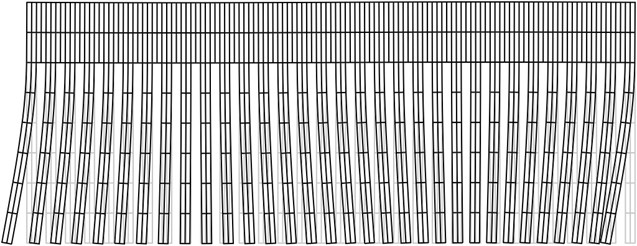
Fig. 6The third eigenmode
5. Experimental measurement of non uniformity of tension and diagnostics of defects of a sheet of flock printing material
In the printing device a tape of flock material experiences tension. Non uniformity of this tension decreases the quality of printed images. Thus it is important to reduce this non uniformity of tension. For this purpose a method based on the analysis of the shape of the first eigenmode of vibrations is proposed. While observing the first eigenmode using the experimental method of time averaged projection moiré it is possible to determine the similarity of the obtained image to the images presented in Fig. 2. When the deviation of the shape of the first eigenmode is not too big (between the images presented in Fig. 2b and Fig. 2d) the non uniformity of tension is considered acceptable. But when the deviation of the first eigenmode becomes substantial (similar to Fig. 2a or Fig. 2e), then the operator of the printing machine has to stop the printing process immediately and perform the necessary adjustments. Also when defect in the flock printing material takes place, it is important to perform its diagnostics as soon as possible. This is also performed from the distorted shape of the first eigenmode of vibrations obtained by using time averaged projection moiré. For this purpose not only the first eigenmode is to be used, but for some types of defects located in specific places of the sheet of flock printing material the analysis of several first eigenmodes is required.
Experimental investigations of the eigenmodes of vibrations on a specially developed experimental setup have been performed. The obtained experimental results show satisfactory agreement with the numerical ones. The fourth eigenmode is presented in Fig. 7.
A schematic representation of a sheet of flock printing material with defect – tear is shown in Fig. 8.
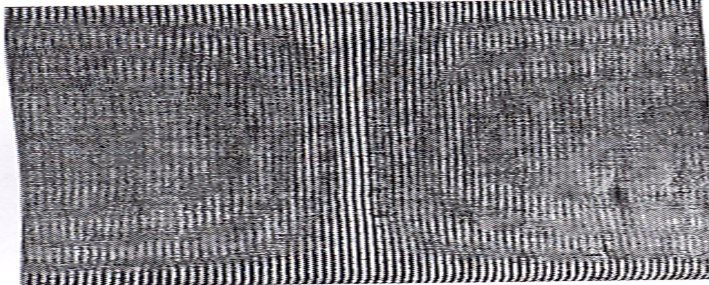
The second eigenmode of vibrations obtained in the process of experimental investigations is presented in Fig. 9.
From the results obtained in the process of experimental investigations it is determined that the defects are identified and their size can be approximately measured by using this technique.
Fig. 7Experimental fourth eigenmode of vibrations: frequency of vibrations 420 Hz, amplitude 3·10-6 m
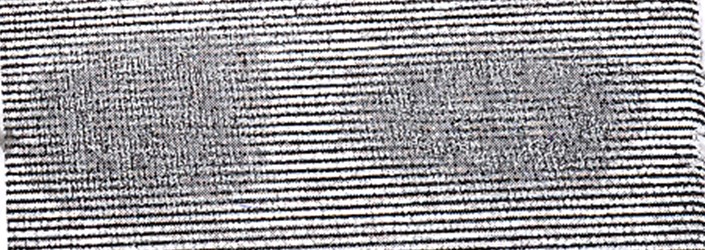
Fig. 8Sheet of flock printing material with defect – tear: 1 – sheet of flock printing material, 2 – defect – tear
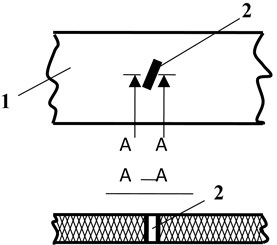
Fig. 9Experimental second eigenmode of vibrations with a defect – tear (frequency of excitation 160÷170 Hz)
6. Conclusions
In the printing device a tape of flock material experiences tension. Non uniformity of this tension decreases the quality of printed images. A method based on the analysis of the shape of the first eigenmode of vibrations is proposed. While observing the first eigenmode using the experimental method of time averaged projection moiré it is possible to determine the similarity of the obtained image to the images obtained numerically and presented in the paper. When the deviation of the first eigenmode becomes substantial, then the operator of the printing machine has to stop the printing process and perform the necessary adjustments.
When defect in the flock printing material takes place, it is important to perform its diagnostics as soon as possible. This is performed from the distorted shape of the first eigenmode of vibrations obtained by using time averaged projection moiré. For this purpose not only the first eigenmode is to be used, but for some types of defects located in specific places of the sheet of flock printing material the analysis of several first eigenmodes is required.
The square sheet of flock material is analyzed. On the upper plane of the lower and upper boundaries all the displacements are assumed equal to zero, except on the upper plane of the upper boundary linear variation of the displacement in the direction of the y axis is assumed.
Contour plots of the transverse displacement for the upper plane for the first eigenmodes are obtained and analyzed.
Investigation of vibrations of flock printing material by taking the layer of glue and separate flocks into account by using a two dimensional model is performed. This model is used for the determination of physical parameters of the previous model. 32 strips representing elastic flock material are taken into account. The upper layer which is one fourth of the thickness of the structure represents the layer of glue and thus consists of elastic finite elements. It is assumed that the thickness of elastic element representing a separate flock is equal to the interval between adjacent flocks. On the upper boundary the displacements of the first and the last nodes are assumed equal to zero.
The first eigenmodes are determined and investigated.
The proposed approach enables to investigate the interaction of elastic elements of the flock material through the elastic layer of glue interconnecting them.
Experimental investigations of the eigenmodes of vibrations on a specially developed experimental setup have been performed. The obtained experimental results show satisfactory agreement with the numerical ones.
The obtained results are used in the process of design of packages made from flock material.
References
-
Kleber W., Schmidt H. J. Computer aided optimizing of electrical fields for flocking operation. Proceedings of 11th International Flock Seminar, Buedingen, Germany, 1992, p. 1001-1024.
-
Bershev E. N. Developing the Physical Principles of Electrostatic Flocking Procedures. Moscow, 1977.
-
Kim Y. K., Lewis A. F. F97-D01: “Scientific Study of Flock Materials and the Flocking Process”. Annual Report 1998, National Textile Center, 1998.
-
Bershev Е. N., Lobov V. F. Technology and Equipment for Nap Causing in the Powerful Electric Fields. Moscow, VNIIESM, 1976, 60 p., (in Russian).
-
Zhong J., Liu L. F., Yu J. Y., Xie H. Electrostatic flocking of superfine fiber. Proceedings of International Conference on Fibrous Materials, China, 2009, p. 276-278.
-
Yang S. Z., Yu J. Y., Liu L. F.,Yang J. S. Investigation on electrostatic flocking process of sea-island fiber. Textile J., Vol. 28, Issue 7, 2007, p. 9-11, (in Chinese).
-
Sung B. J., Aly A., Lee S. H., Takashima K., Kastura S., Mizuno A. Fine-particle collection using an electrostatic precipitator equipped with an electrostatic flocking filter as the collecting electrode. Plasma Process. Polym., Vol. 9, 2006, p. 661-667.
-
Lifang Liu, Longdi Cheng, Jianyong Yu, Hao Xie Evaluation of the availability of easy cationic dyeable copolyester fibers as electrostatic flocking piles. Journal of Applied Polymer Science, Vol. 120, Issue 1, 2011, p. 195-201.
-
Mizyuk O., Kibirkštis E. Study of mechanical characteristics of package from flock printing materials at compression. Strain, Malden, Blackwell Publishing Ltd., Vol. 46, No. 2, 2010, p. 205-208.
-
Kabelkaitė-Lukoševičė A., Gegeckienė L., Kibirkštis E., Havenko S., Bivainis V., Ragulskis K., Ragulskis L. Analysis of vibrations and stability of flock printing material. Journal of Vibroengineering, Vol. 13, Issue 2, 2011, p. 237-244.
-
Zienkiewicz O. C. The Finite Element Method in Engineering Science. Moscow, Mir, 1975.
-
Bathe K. J. Finite Element Procedures in Engineering Analysis. New Jersey, Prentice-Hall, 1982.
